

The big news of the week occurred last Tuesday when President Trump threatened additional tariffs on some European countries who objected to his bid to acquire Greenland, as well as the heavy selling of Japanese government bonds.
Treasuries and the dollar fell while the S&P 500 dropped more than 2%, its steepest decline in more than three months.
European leaders were not pleased and said they were willing to launch a retaliatory “bazooka” to maintain sovereignty over Greenland.
There was also a lot of talk on the “weaponization of capital,” where European investors could reduce exposure to U.S. assets (i.e., “sell America”). The Danish pension fund AkademikerPension said it will sell its US Treasuries by the end of the month, which Treasury Secretary Bessent dismissed as immaterial.
Gold and silver rocked on the news, concern for higher inflation, and geopolitical tensions. Silver exceeded $100 for the first time in history with a 43% year-to-date gain. Gold, up 15% so far in January, hit another record and is hovering just below $5,000 an ounce.
Trump later walked them back in another TACO move (i.e., “Trump always chickens out”) when he said during his Davos speech that he would not seize Greenland by force and dropped his tariff threats against eight European countries.
Markets rebounded on this announcement as Trump backed off his threats and claimed a “framework of a future deal” over Greenland.
After the week’s whiplash was done, the broader markets were marginally down, leaving the charts in a messy trading range (although the IWM might set up a Buy Setup).
The U.S. dollar had its steepest weekly decline since May as investors flag concern about the U.S.’s fiscal outlook. Long-dated Treasurys sold off, pushing up yields and increasing borrowing costs (although they retraced a lot since the Tuesday gap).
In fact, Citadel’s Ken Griffin said at the World Economic Forum in Davos that the heavy selling of Japanese government bonds should serve as an “explicit warning” to US politicians to improve the nation’s finances. Our nation’s debt is unconscionable, particularly during peace time and solid employment.
Over the weekend, Trump warned of 100% tariffs on Canadian goods if Canada “makes a deal with China.” Additionally, there was another agent shooting death in Minneapolis, escalating immigration tensions and protests there, setting up another government shutdown as many Dems are refusing to fund DHS.
We will see how the Futures respond when they open on Sunday night.
There will be no shortage of headlines capable of moving markets this week. As always, our focus will remain on price, structure, and risk, not opinions.
There’s also the lingering possibility of a Supreme Court ruling on tariffs, which has been delayed twice already. The administration sounds confident. Markets will decide whether that confidence is justified.
On the positive side, the broader market indexes—the NYSE Composite, Transports, and the Russell 2000—remain in confirmed uptrends. The equally weighted S&P 500 (RSP) is also trending higher, which is encouraging from a participation standpoint.
However, for most indices and sectors, the last two weeks have been persistently choppy and uneven, creating an extremely selective trading environment. This is not a market rewarding broad exposure.
The concerns and headlines already discussed are driving this behavior. These periods always pass, but while uncertainty is elevated, traders are forced to choose between SOH (Sitting on Hands) and the fear of missing an opportunity. That’s simply part of professional risk management.
As I write this, Donald Trump has escalated rhetoric in a brewing trade dispute, warning of potential 100% tariffs on Canadian goods should Canada pursue a trade deal with China.
By the time you read this, that headline—or its market impact—may already be obsolete. That’s the point: news is moving faster than price can be rationalized.
Our internal market gauges remain neutral, but sentiment is drifting toward a bearish extreme. That does not mean it must get there, nor do we try to anticipate it. When sentiment and breadth align at an extreme, we act. Until then, there is no gray area—only patience.
This week also brings a policy decision from the Federal Reserve. Based on data and technicals, the expectation is that rates will remain unchanged. The market’s attention will be squarely on the Chairman’s comments and any nuance around future policy.
Earnings will be another major driver, particularly in technology. Key reports on deck include Microsoft, Apple, Meta, IBM, Lam Research, KLA, and Western Digital.
Outside of tech, Caterpillar also reports—now a meaningful market mover due to its exposure to infrastructure and data-center buildouts.
Nothing changes in how we operate. We will continue to trade the same price patterns, manage risk the same way, and let the market—not opinions—tell us when opportunity is present.
If you're not in the Green Room with us, log in to YouTube, Facebook, or Twitter to get our pre-market review at 9 AM ET. If you can't make it, you can view the recording.
Good trading.
TREND MATRIX
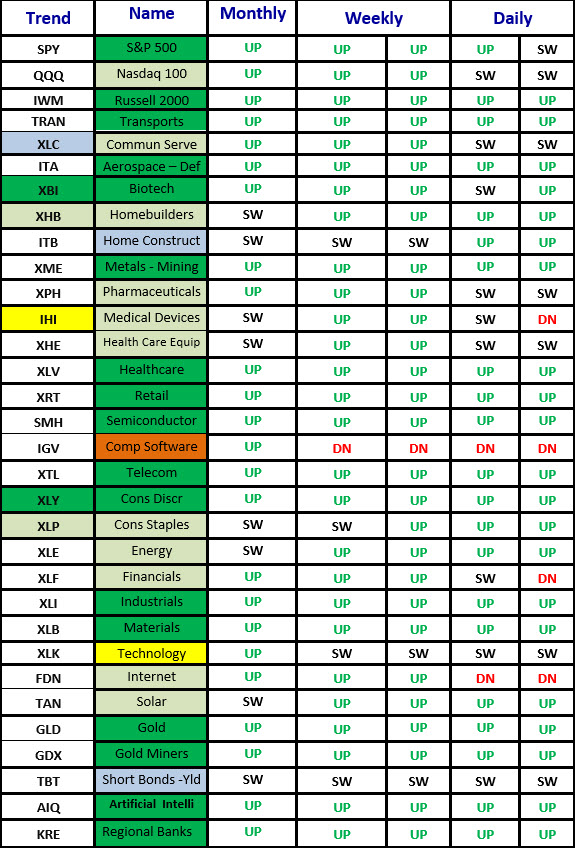
I reviewed the Trend Matrix in the video below
S&P Sector ETFs – Sorted by Weekly Percent Change
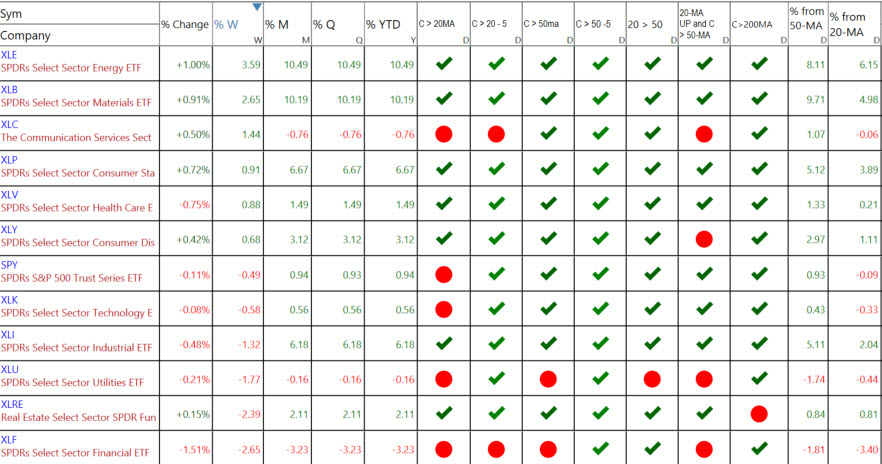
Last week’s percentage changes.
The percentage changes tell you which sectors were the strongest or weakest on Friday and for the week, month, quarter, and year.
There are seven columns after the percent changes in the sector listed above.
You can see the ETFs that are the strongest getting stronger or weakening.
- Close above or below the 20-MA.
- Close above or below the 20-MA 5 Days Ago. C>20 -5
- Close above or below the 50-MA.
- Close above or below the 50-MA 5 Days Ago. C>50 -5
- 20-MA above or below the 50-MA.
- 20-MA is pointed up, and the close is above the 50-MA
Other ETF Sectors – Sorted by Weekly Percent Change
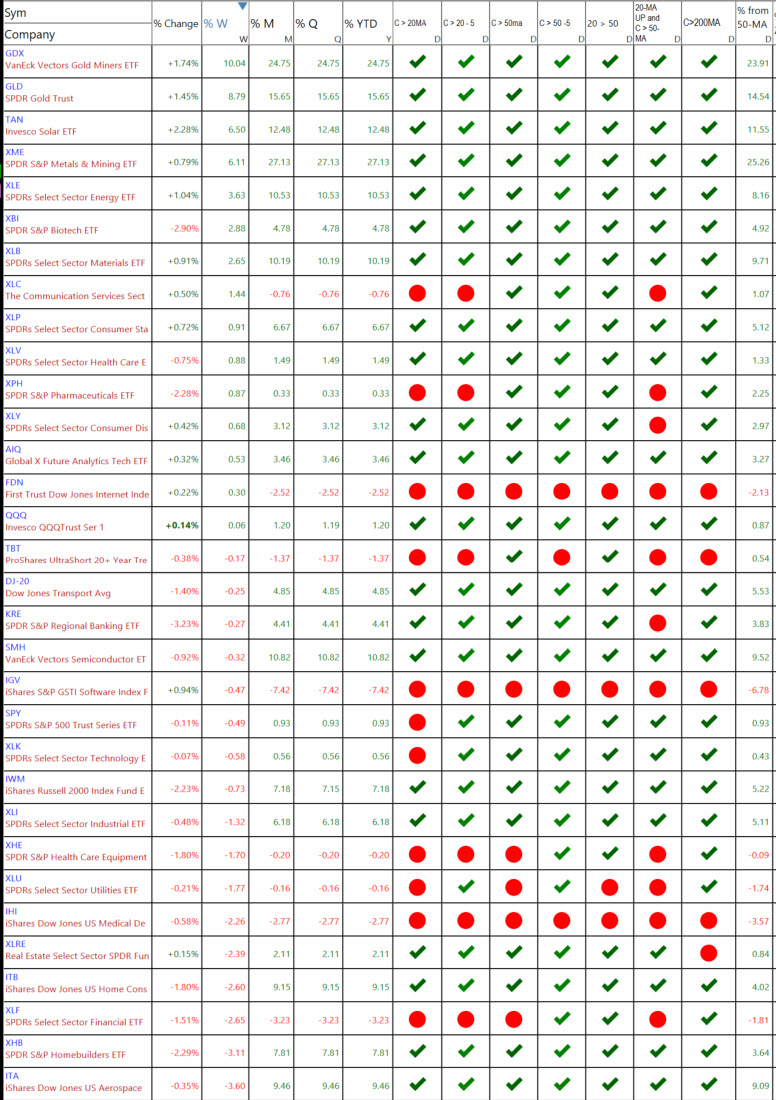
See the Video Below
VIDEO REVIEW OF ETF SECTORS - Click lower right to open Full Screen.
NEW ETF TRADE IDEAS
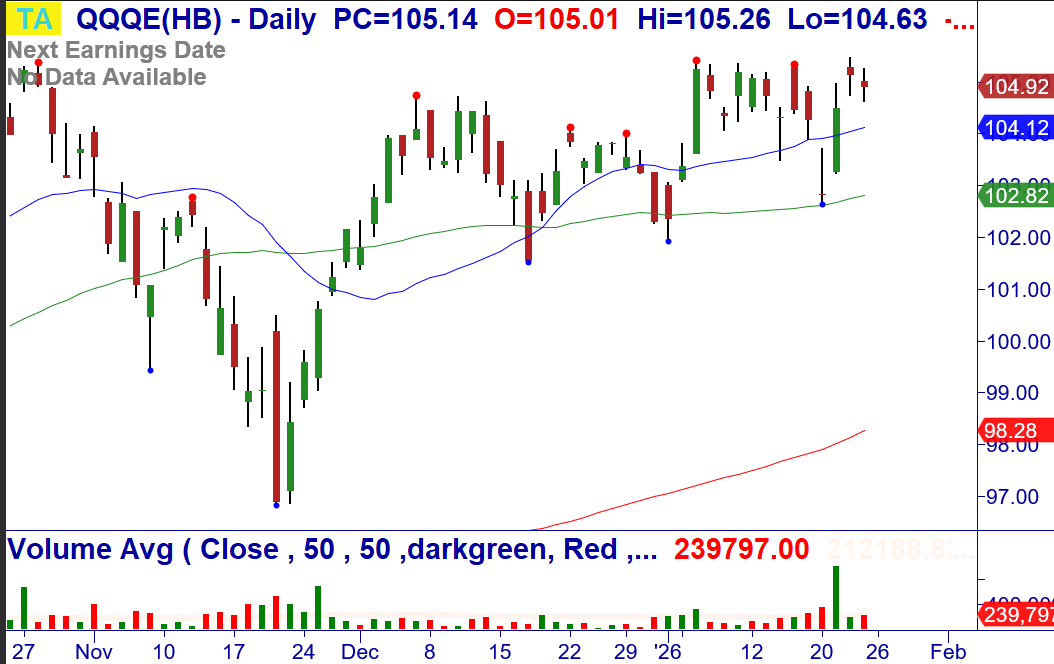
1/26: Direxion NASDAQ-100 Equal Weighted Index Shares (QQQE) – Over $105.47, consider buying the ETF. Breakout to all-time highs. Stop $102.63.
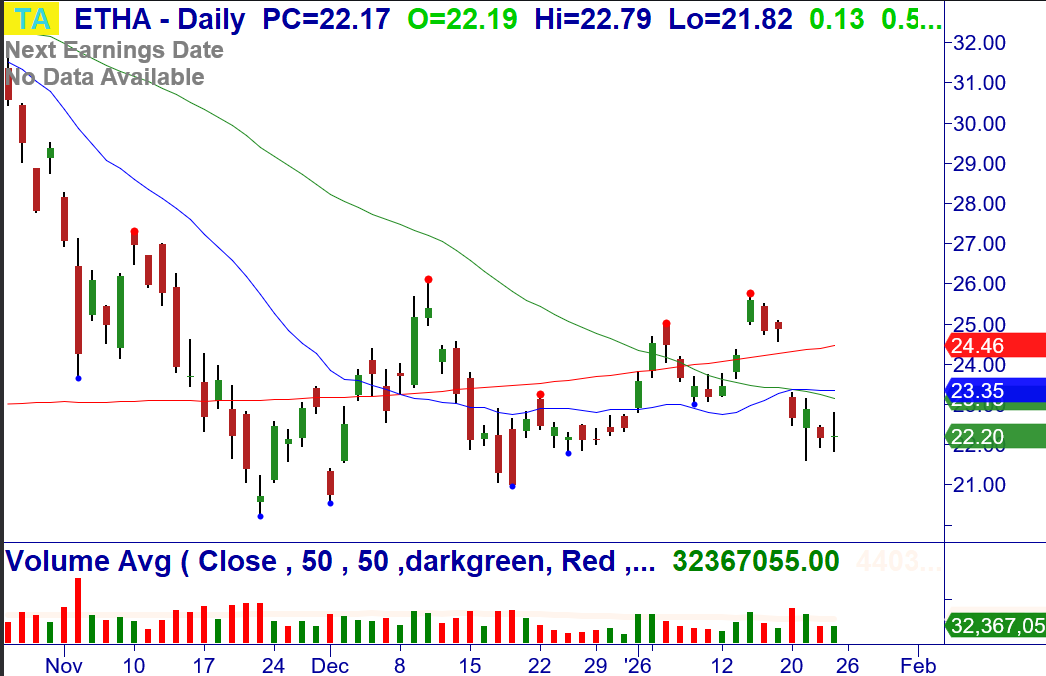
1/26: iShares Ethereum Trust ETF (ETHA) - Under $21.62, consider shorting a ½ lot of the ETF. Breakdown daily/weekly. Stop $24.46 (200-MA).
OPEN AND CLOSED ETF POSITIONS WITH TRADE UPDATES (NOTE: Also in Member's Area in Open/Closed Trade Sheet)
12/23: ARK Innovation ETF (ARKK) - Bought a 1/2 lot of the ETF at $82.58. +WRB from consolidation at the 20/50-MA, bullish weekly/monthly. 1/24: Buy 1/2 over $82.46. Stop $78.34.
12/22: Grayscale Ethereum Trust ETF (ETHE) – Bought a ½ lot of the ETF at $25.09. Breakout from bullish reversal at the 20-MA, bullish retest weekly, Buy Setup monthly. 1/2: Bought ½ at $25.23. Stopped.
1/16: Federal Realty Investment Trust (FRT) - Bought a ½ lot of the ETF at $103.67. +WRB Breakout from a bullish inverse Head and Shoulders at the 20-MA, bullish weekly/monthly. 1/17: Buy ½ over $103.86. Stop $100.84.
11/25: SPDR Gold Shares (GLD) - Bought the at $380.59. Breakout at the 20/50-MA, bullish weekly. 1/16: Sold 1/3 at $420.06. 1/20: Move Stop $417.03.
1/12: AdvisorShares Pure US Cannabis ETF (MSOS) - Bought the ETF at $5.02. +WRB Breakout from consolidation at the 20/50-MA, Buy Setup and reversal weekly. Stop $4.38.
1/5: VanEck Uranium and Nuclear ETF (NLR) - Bought a 1/2 lot of the VanEck Uranium and Nuclear ETF (NLR) at $134.50. +WRB Breakout of a bottoming pattern at the 20-MA, bullish retest and reversal weekly. 1/15: Bought 1/2 at $145.70. 1/22: Sold 1/3 at $153.53 for a $19 point gain. Move Stop $145.14.
12/3: abrdn Physical Palladium Shares ETF (PALL) - Bought the ETF at $134.03. Breakout, Bull Flag consolidation weekly. 12/17: Sold 1/3 at $149.27. 12/23: Sold 1/3 at $169.80. 1/20: Move Stop $157.92.
1/12: State Street SPDR Portfolio S&P 500 Value ETF (SPYV) – Bought the ETF at $58.23. Bear Sandwich +180 Breakout at the 20-MA to all-time highs. Stopped.
1/13: CoinShares Bitcoin Mining ETF (WGMI) - Bought a 1/2 lot of the ETF at $48.90. Breakout from a bottoming pattern at the 50-MA, bullish weekly/monthly. 1/16: Bought 1/2 $49.53. Stop $44.33.
11/17: State Street SPDR S&P Health Care Equipment ETF (XHE) – Bought the ETF at $82.71. Buy Setup at the 20/200-MA, Breakout weekly/monthly. 1/16: Move Stop $87.45.
1/15: State Street PDR S&P Retail ETF (XRT) - Bought a 1/2 lot of the ETF at $91.01. Bull Rectangle Breakout, bullish weekly/monthly. 1/22: Bought ½ at $91.26. Stop $87.76.
Master Trader and You Building Your Financial Future Together!
Happy trading! If you have any questions or comments, please e-mail Greg Capra at Greg@mastertrader.com or Dan Gibby at Dan@mastertrader.com
All the best,
Greg Capra Managing Director of Master Trader
Dan Gibby Chief Options Strategist
NOTE: Master Trader will show the opening and closing prices of all stock and options trades. We recommend that all traders and investors use proper share sizing for positions and money management. However, we cannot recommend what that is for your particular trading style, risk tolerance, or account balance. We urge you to calculate your own share/position size based on your individualized risk parameters, Trading Plan, and familiarity with the proposed trade strategy and risk. Advanced Management Strategies (AMS) covers in detail foundation and advanced position and money management.
NOTE: Master Trader and its representatives may have existing positions in actual or other trade recommendations before or after suggested herein. Additionally, we may manage them differently for internal purposes based on different risk parameters than noted herein. All trade ideas and content are for informational and educational purposes only. It is not, nor is it intended to be, trading or investment advice or a recommendation that any security, option, or investment strategy is suitable for any person. Trading securities can involve high risk and the loss of any funds. Significant gaps or volatility can increase these losses, particularly for short option strategies. Investment or trading information provided may not be appropriate for all investors, and is provided without respect to individual financial sophistication, financial situation, investing time horizon or risk tolerance. Supporting documentation for any claims (including claims made on behalf of options programs), comparison, statistics, or other technical data, if applicable, will be supplied upon request. Master Trader Consulting, Inc. is not a licensed financial advisor, registered investment advisor, or a registered broker-dealer. Options, futures, and futures options are not suitable for all investors.
