The broader markets all retraced after SPY, DIA, and IWM making record highs the prior week on the $1.9 trillion stimulus package being approved and positive vaccine news.
The Nasdaq and high-valued stay-at-home stocks have been underperforming with the rise in 10-year yields rising to new weekly highs.
Higher bond yields increase borrowing costs (hurting profits) and produce a lower present value for assets like stocks (hence, the pressure on high P/E stocks).
The FOMC met last week and kept its supportive policies. It plans to keep short-term rates low through 2023 and the $120 billion per month of securities purchases. The bond market is fighting the Fed as the 10-year yield rises on increasing inflation expectations.
About $242 billion of the stimulus bill was deposited into Americans’ bank accounts on Wednesday. Bank of America stated that a record $68.3 billion flowed into equity funds last week confirming our prediction that some of the stimulus is going to speculation rather than spending.
The Dems continue to want to spend more and tax more. During the Presidential campaigning last year, the media was suggesting that would kill the markets. It hasn’t – so far.
With the volatility into Friday’s close from the quarterly expiration of stock and index options, we will start cautiously at the beginning of the week to see what follow-through we get.
TREND MATRIX
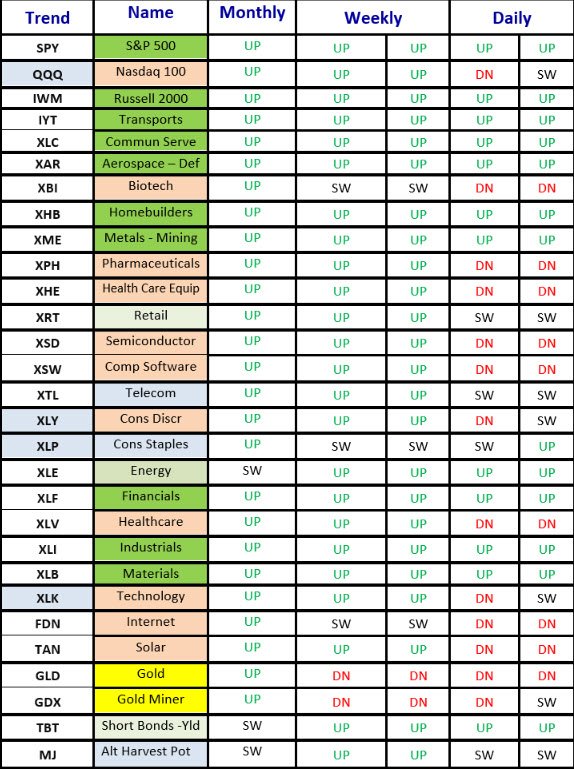
The changes to the Matrix that occurred last week were relatively insignificant. However, the whipsaw price action has continued.
The depth of retracement in the weaker sectors was a small positive, but the gap lower on Thursday and continued to move lower was significant.
The price pattern is seen in the S&P 500. For example, historically, we would not see a retracement back down to March 5 low.
Like those seen in the Technology sector, the price patterns that were more damaged may go down to that low or even below it.
We hope that they do move down to that low or break those lows, which would create an excellent buying opportunity.
TREND MATRIX PERCENTAGE CHANGES
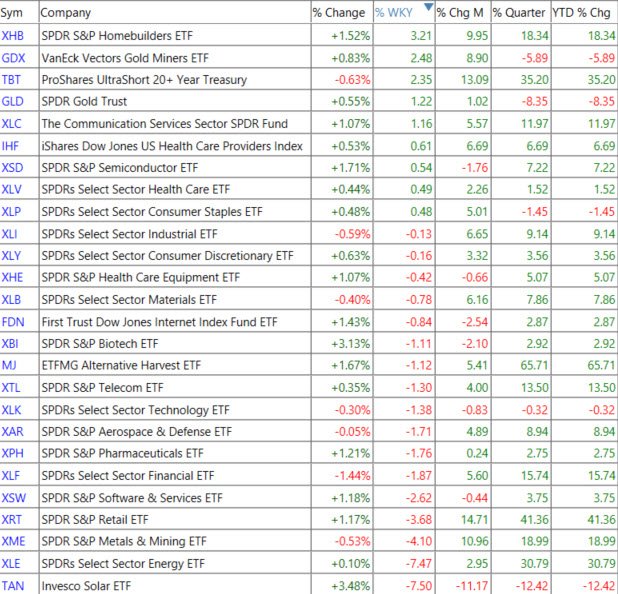
In a week where the continued rise in interest rates and their gap higher Thursday dropped the market sharply at the end of the week, the Homebuilding ETF was the top performer.
Maybe the rise in rates that began last year motivated pent-up demand to buy. As the 10-Year yield continues high toward the 2.0% area it fell from, the homebuilding sector ETF is likely to underperform.
Gold Miners and Gold did okay last week as they form buying interest at their long-term price support, they are at the last breakdown area, which is resistance.
TBT (short bonds – rising rates) moved and the daily and weekly trend suggests it will continue to.
Most sectors whipped up and down.
Two weeks ago, we said the potential for a pullback is increasing in Energy.
The XLE ETFs, the most diversified of the energy ETF’s, pulled back less than others. OIH and XES are down just over 12% and 13% respectively.
Crude oil futures fell from a high of $68.02 weeks ago to an intraday low near $58 on Thursday.
VIDEO REVIEW OF MARKETS AND INTERNALS
[s3mm type=”video” s3bucket=”mastertrader2″ files=”greg-letters-2021/MarketUpdate_3_22_21.mp4″ source=”cloudfront” /]
NEW ETF TRADE IDEAS
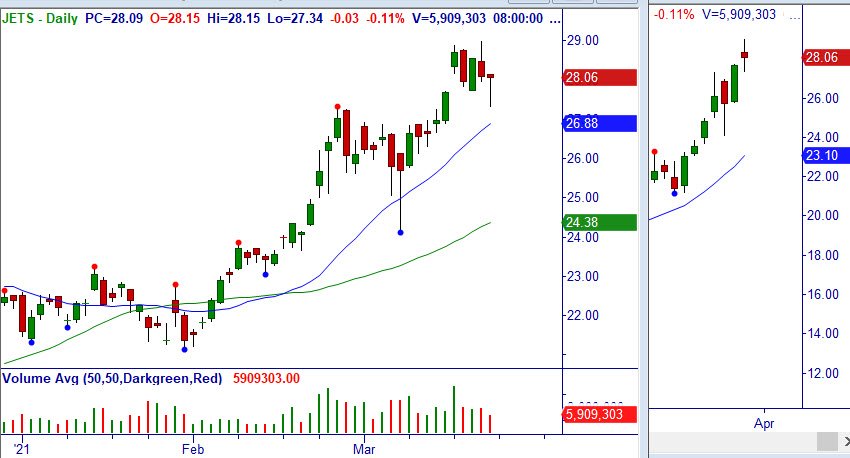
3/22: Global X Robotics & Artificial Intelligence ETF (BOTZ) – Under $32.96, consider shorting the ETF. Sell Setup at 20/50-MA. Stop half at $33.96 and half at $34.71
3/22: U.S. Global Jets ETF (JETS) – Over $28.15, consider buying the ETF. +Gap and retracement after +WRB Breakout. Stop $25.76.
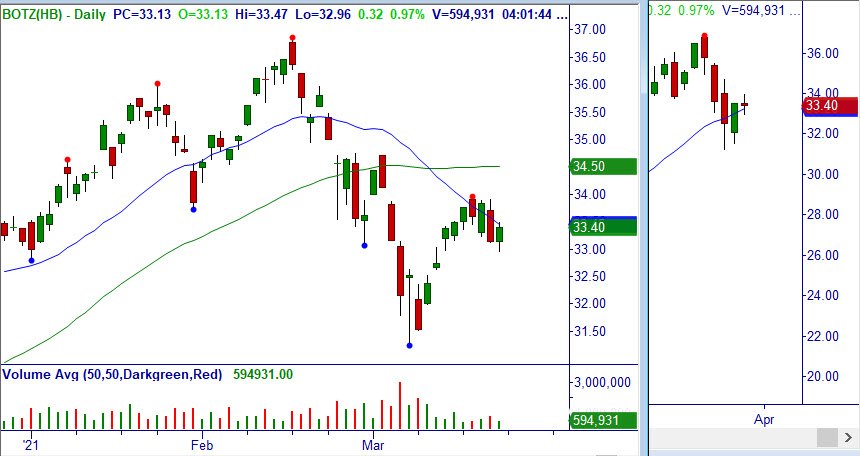
3/22: U.S. Global Jets ETF (JETS) – Over $28.15, consider buying the ETF. +Gap and retracement after +WRB Breakout. Stop $25.76.
OPEN AND CLOSED ETF POSITIONS WITH TRADE UPDATES (NOTE: Also in Member’s Area in Open/Closed Trade Sheet)
3/22: Global X Robotics & Artificial Intelligence ETF (BOTZ) – Under $32.96, consider shorting the ETF. Sell Setup at 20/50-MA. Stop half at $33.96 and half at $34.71
3/22: U.S. Global Jets ETF (JETS) – Over $28.15, consider buying the ETF. +Gap and retracement after +WRB Breakout. Stop $25.76
3/15: ETFMG Alternative Harvest ETF (MJ) – Bought the ETF at $24.24. Breakout daily, Buy Setup and bullish engulfing reversal weekly. Stop $19.50
2/16: SPDR S&P Metals and Mining ETF (XME) – Bought the ETF at $36.04. 3/20: Move Stop $38.57
2/18: SPDR S&P Oil & Gas Exploration & Production ETF (XOP) – Bought the ETF at $75.63. 3/8: Sold half at $87.71. 3/17: Stopped at $86.07
Thank you for being a loyal subscriber and feel to email us with any questions or comments on anything.
Click Here – to Access the Options Credit Spread Program that puts you on the Master Trader Income Path.
Click Here to Learn The Master Trader Swing Trading Strategies to profits over a few days to weeks.
Our comprehensive Master Trader All-Inclusive Advisory Market Edge Membership includes the Master Trader Advisory Swing and Options Trader — plus much more – in providing ongoing, invaluable trading information for active investors and traders.
Our Master Trader Weekly Lessons for Investors and Traders will build your investing and trading knowledge and confidence to profit in all markets! Each lesson can change your financial future — only $11.97/month!
Master Trader and You Building Your Financial Future Together!
Happy trading! If you have any questions or comments, please e-mail Greg Capra at Greg@mastertrader.com or Dan Gibby at Dan@mastertrader.com
All the best,
Greg Capra Managing Director of Master Trader
Dan Gibby Chief Options Strategist
NOTE: Master Trader will show opening and closing prices of all stock and options trades. We recommend that all traders and investors use proper share sizing for positions and money management. However, we cannot recommend what that is for your particular trading style, risk tolerance, or account balance. We urge you to calculate your own share/position size based on your individualized risk parameters, Trading Plan, and familiarity with the proposed trade strategy and risk. Advanced Management Strategies (AMS) covers in detail foundation and advanced position and money management.
NOTE: Master Trader and its representatives may have existing positions in actual or other trade recommendations before or after suggested herein. Additionally, we may manage them differently for internal purposes based on different risk parameters than noted herein. All trade ideas and content are for informational and educational purposes only. It is not, nor is it intended to be, trading or investment advice or a recommendation that any security, option or investment strategy is suitable for any person. Trading securities can involve high risk and the loss of any funds. Significant gaps or volatility can increase these losses, particularly for short option strategies. Investment or trading information provided may not be appropriate for all investors, and is provided without respect to individual financial sophistication, financial situation, investing time horizon or risk tolerance. Supporting documentation for any claims (including claims made on behalf of options programs), comparison, statistics, or other technical data, if applicable, will be supplied upon request. Master Trader Consulting, Inc. is not a licensed financial advisor, registered investment advisor, or a registered broker-dealer. Options, futures and futures options are not suitable for all investors.