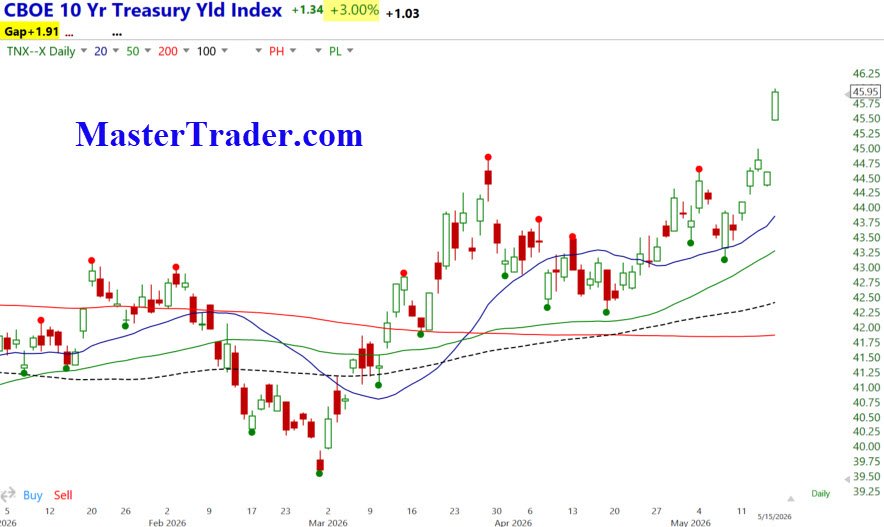
A market-moving event last week was the breakout in interest rates. Chart Below.
We reviewed this possibility before it happened because the daily chart of the CBOE 10-Year Treasury Yield Index was already setting up in a way that suggested higher yields were possible.
But that word — possible — is important.
In trading and investing, possibilities do not equal action. A chart can suggest that something may happen, but taking action before confirmation is often where traders get themselves into trouble.

More...
In trading and investing, possibilities do not equal action. A chart can suggest that something may happen, but taking action before confirmation is often where traders get themselves into trouble. The professional approach is to recognize the setup, define what would confirm it, and then act only when the evidence supports the trade.
That is what happened here.
In the middle of the week, CPI and PPI reports were released, confirming that inflation pressures remained a concern. Yet yields did not move very much at first. My view is that yields were, in a sense, being held in check ahead of options expiration at the end of the week.
Then on Friday, yields moved significantly higher.
That move had bearish implications for the broader markets, especially for interest-rate-sensitive sectors such as homebuilders, utilities, and real estate investment trusts.
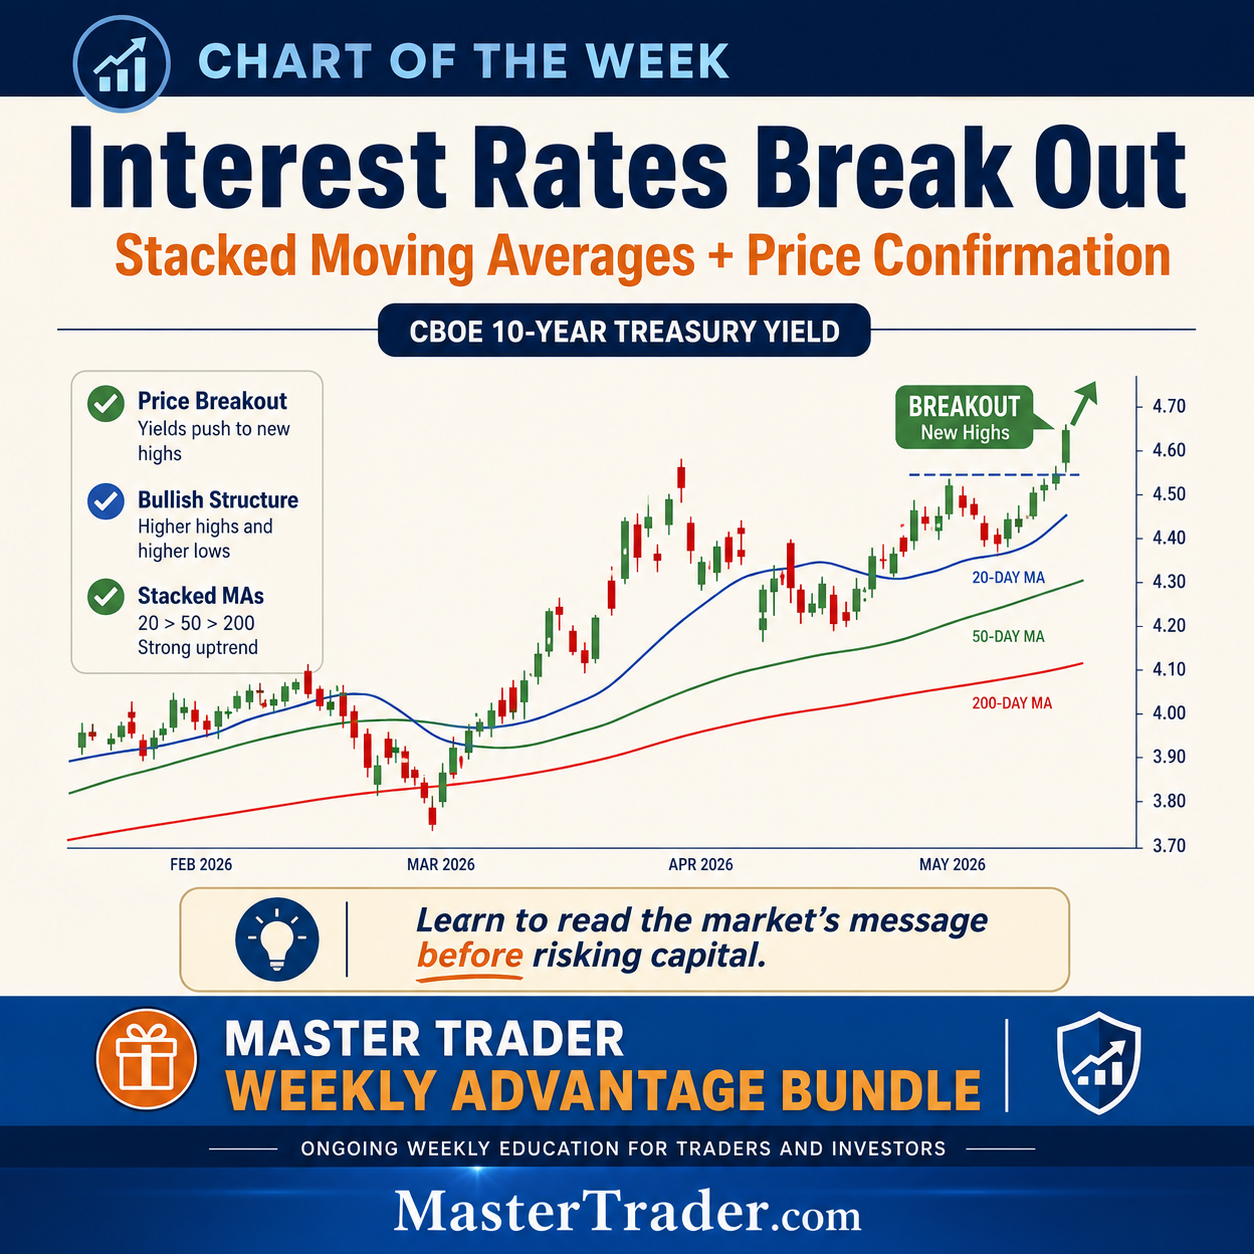
This week’s chart gives us a good opportunity to review an important Master Trader Technical Strategies concept: Stacked Moving Averages.
On the chart below, we are looking at the CBOE 10-Year Treasury Yield Index using the 20-, 50-, 100-, and 200-day moving averages.
Notice that the shorter-term moving averages are above the longer-term moving averages. The 20-day is above the 50-day, the 50-day is above the 100-day, and prices are trading above them. The 200-day moving average is flatter, suggesting that the longer-term monthly relationship is more bullish-to-neutral than fully bullish.
That alignment matters.
When moving averages are stacked in bullish alignment, it indicates that multiple time frames support the same directional bias. In simple terms, the short-, intermediate-, and long-term trends are mostly in agreement.
This does not mean prices must move higher every day. Nothing in the markets works that way. But it does tell us that the probability favors higher prices, or in this case, higher yields, as long as price remains above those rising moving averages and prior support levels.
This is where education becomes critical.
Many traders look at moving averages as magical support or resistance lines. That is not how we use them in MTS. Moving averages are visual aids. They help us see trend alignment, slope, compression, expansion, and relationships across multiple time frames.
The real message comes from the combination of price action, moving average alignment, prior pivots, support and resistance, and the broader market environment.
From a Techno-Fundamental perspective, higher interest rates mean higher borrowing costs. That affects consumers, businesses, housing, credit, and ultimately investor risk appetite.
That is why the breakout in yields continued to pressure homebuilders and home construction stocks.
These areas had already been under selling pressure as rates pushed higher. The rapid move in yields also weighed on utilities and REITs, which are typically more sensitive to interest-rate changes.
In addition, shorter-term yields such as the 2-year and 5-year also moved higher. When shorter-term Treasury yields become more attractive, money can rotate away from higher-risk equities and into lower-risk Treasury instruments.
That is intermarket analysis. At Master Trader, we teach traders and investors how to combine Technical Analysis, Intermarket Analysis, and Market Internals into a complete decision-making method
That’s what separates random trades from a repeatable process.
We review charts like this every week in our MT Weekly Advantage.
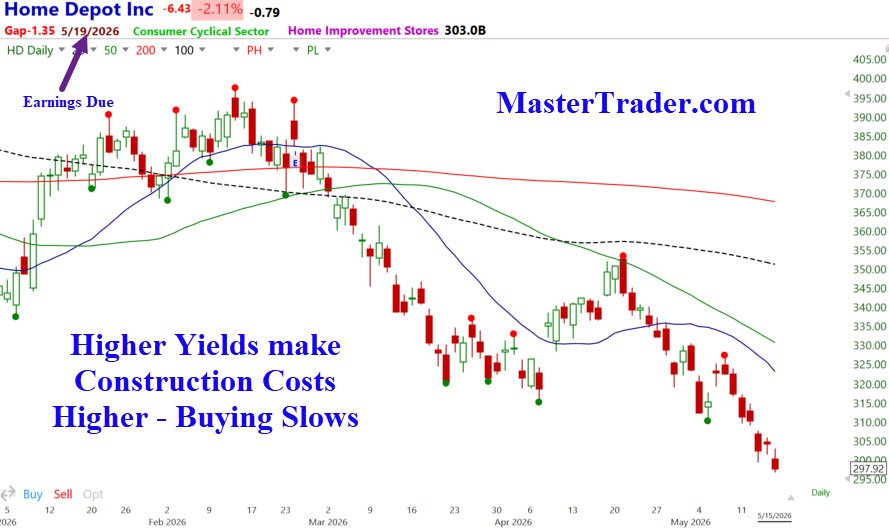
With all moving averages pointing lower in Home Depot (HD), and yields above its MAs, a bullish reversal in HD is likely to fail.
A self-reliant trader learns to ask better questions:
What is happening with interest rates?
What is happening with market internals?
Which sectors are showing relative strength?
Which sectors are showing relative weakness?
Is money rotating into risk or away from risk?
Does the price action confirm the bias?
That is how you begin to move beyond opinions, headlines, and emotional decision-making.
The Chart of the Week gives you a glimpse into how we think.
The Master Trader Weekly Advantage Bundle helps you continue that education week after week, so you can better understand what is happening, why it matters, and how to apply the Master Trader Method with greater confidence.
Before risking capital, educate yourself.
The market will always provide opportunities. The real question is whether you have the structure, discipline, and method to recognize them — and manage the risk when you act.

MT Weekly Advantage = Continuous Education Every Week
If you have found this post helpful, Share it Forward with other Traders. Questions? Email me.
All the best
Greg Capra
Greg@mastertrader.com