Many credit-spread traders begin with the option chain. They search for a low-delta strike, calculate the probability of expiring out of the money, and assume that time decay will provide the edge.
That approach overlooks the most important question:
More...
What does the chart say prices are likely—or unlikely—to do before expiration? See Chart Below of MAGS
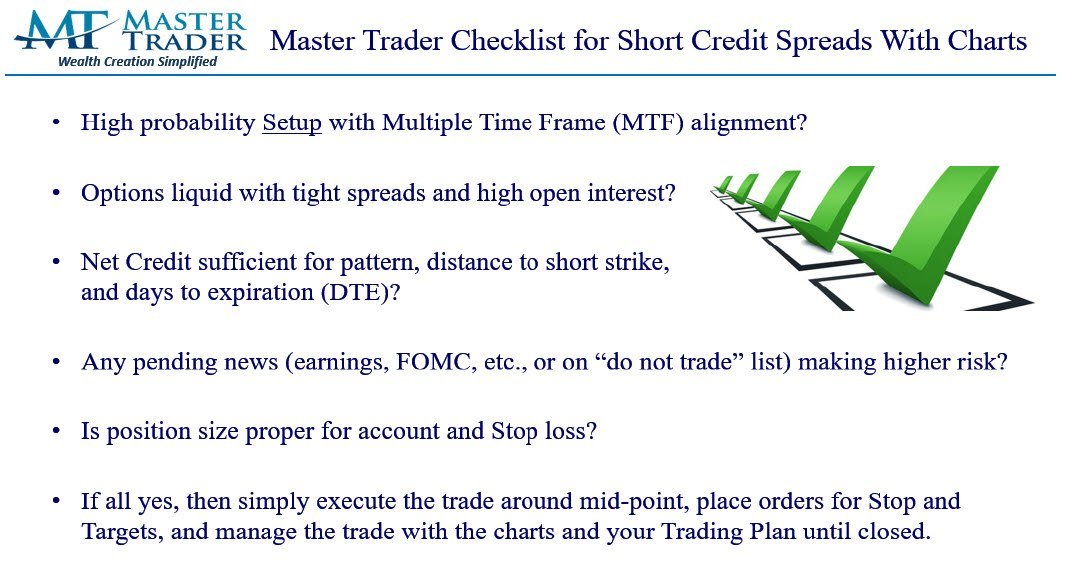
At Master Trader, we never start with the option chain and then search for a chart to support the trade. We begin with the chart, establish an objective directional bias, and identify where prices should not go. Only then do we select the expiration and strikes and decide whether the available premium justifies the risk.
The Master Trader Credit-Spread Method
Before considering a credit spread, we evaluate:
- The daily and weekly trends
- Major Support and Major Resistance
- Multiple Timeframe alignment
- The quality and depth of retracements
- The distance between support and resistance
- Price Voids
- Pivot highs and pivot lows
- Failed breakouts and breakdowns
- Bottoming Tails, Topping Tails, 180 reversals, and other price patterns
- The strength or weakness of the broader market and relevant sector
When the technical bias is bullish, we may sell a put credit spread below Major Support. When the bias is bearish, we may sell a call credit spread above Major Resistance.
The objective is not simply to predict that a stock will move higher or lower. It is to identify a significant technical barrier that makes it less likely that prices will reach the short strike before expiration.
That is the edge provided by the chart. META is in the Weekly Options Letter 7/20/26 - See Below
Why Greeks Alone Are Not Enough
Greeks are valuable tools, but they do not evaluate the quality of the price structure.
A low-delta option may appear statistically safe. However, if its strike is positioned inside a Price Void, below weak support, or in the path of increasing momentum, the chart may offer little protection.
A bullish put spread positioned below Major Support can provide several potential layers of protection:
The stock must first decline.
It must reach Major Support.
It must break through that support.
It must continue declining toward the short strike.
It must do all of that before expiration.
The same logic applies in reverse to a bearish call spread placed above Major Resistance.
We want statistical probabilities and technical structure working together—not probabilities standing alone.
Strike Selection Comes After the Technical Bias
Once we identify support or resistance, we select a short strike beyond that technical area. We then purchase an option farther out of the money to define the maximum risk and reduce the buying-power requirement.
We also evaluate:
- The distance from the current price to the short strike
- The strength of the technical barrier
- Current volatility
- Time remaining until expiration
- Scheduled earnings and other market-moving events
- Option liquidity and bid-ask spreads
- The premium available relative to the defined risk
An attractive chart does not automatically make an attractive credit spread. Poor liquidity or unusually wide bid-ask spreads can make a trade expensive to enter, exit, or adjust.
The chart determines whether an opportunity may exist. The options market determines whether that opportunity can be traded responsibly.
Selectivity Is Part of the Strategy
Some market environments offer clearly defined trends, aligned sectors, reliable support and resistance, and attractive option premiums. Other periods are choppy, overlapping, and difficult to trade.
We do not believe traders must initiate the same number of spreads every week. That mindset can lead to lower-quality setups, poor strike selection, and inadequate premium.
Trading is not a production quota.
When conditions are favorable, we act. When the technical pattern, liquidity, premium, and risk do not align, capital preservation becomes the priority.
The Weekly Options Trader Letter gives you:
- Bull put and bear call credit-spread recommendations
- Specific strikes and expiration dates
- Suggested entry prices
- Technical stop levels
- Real-time trade-management updates
- The technical reasoning supporting each trade
- Continuing education in credit-spread selection and management
- Monthly Group Coaching Session.
Monthly Membership — $49
Receive the Weekly Options Trader Letter without a long-term commitment.
Annual Membership — $399
With the annual membership, you receive:
- Twelve months of the Weekly Options Trader Letter
- A savings of $189 compared with paying monthly
- The Entry-Level Credit Spread Course—a $297 value—FREE
- A combined value of $885 for only $399
You save a total of $486.
Don’t simply follow credit-spread trades. Learn how Master Trader combines chart analysis, option structure, probability, and disciplined risk management to identify higher-quality opportunities.
Join the Weekly Options Trader Letter and trade credit spreads with more than Greeks working in your favor.
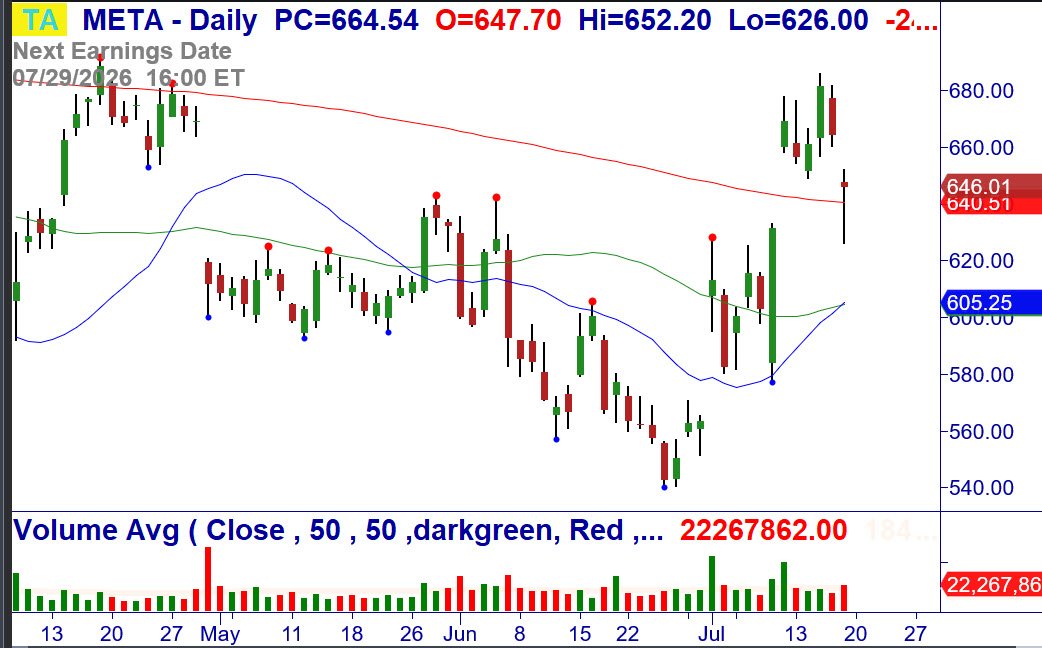
7/20: META – Provided it does not gap over $5.00 in either direction, consider shorting Jul (7/22) $600/605 bull put credit spread and shorting Jul (7/22) $690/695 bear call credit spread (called an Iron Condor) for a limit of $.78/share (closed at $.80/share). -Gap leaving rangebound. Stops: $599.98 and 687.22.