
Investors and Traders can use a watch list to see sectors that money is moving into and out of in different time frames.
Many website services display percentage gainers and losers daily, weekly, and monthly time frames.
It’s simple and a useful starting point for your analysis.
We can make the watch list much more useful to guide our bias and shorten our search for opportunities.

If you like this watch list setup, and use TC2000, there is a link to download it below.
Above is my watch list for the S&P ETFs. I also have a list of other ETFs and Stocks.
The list setup is great for Swing Trading starting the analysis.
It shows change on the day, week, month, and year to start.
Then I have other columns. The firsts show me if the close is above the 20-MA. If it is, that filter tells me if the ETF has at least some strength, but we need more.
Next column, if the close is above the 50-MA. Suppose it is, plus number two. However, is the 20-MA above the 50-MA?
We can see in the next column that XLV close is above its 20-MA and 50-MA, but the 20 is not above the 50.
So, it must have bounced within a downtrend since it is down 8% this year.
Only Energy (XLE) has its 20-MA above the 50-MA, but the close is below both MAs. This information tells me that there has been a recent correction.
The last column tells us if the 20-MA is rising and if the close is above the 50-MA.
There isn’t one ETF with the 20-MA rising and the close above the 50-MA.
This watchlist tells that the overall market is bearish. There is no doubt.
With my watch list, I know the market environment and what sectors see money flowing into or out of short-term and intermediate term.
You don’t need to be a market guru to know what’s happening in the market and sectors.
After viewing each sector chart, we decide if there are trading setups for directional buys, shorting or options.
Price Chart of XLE Climactic Buy Setup or Bull Put Credit Spread
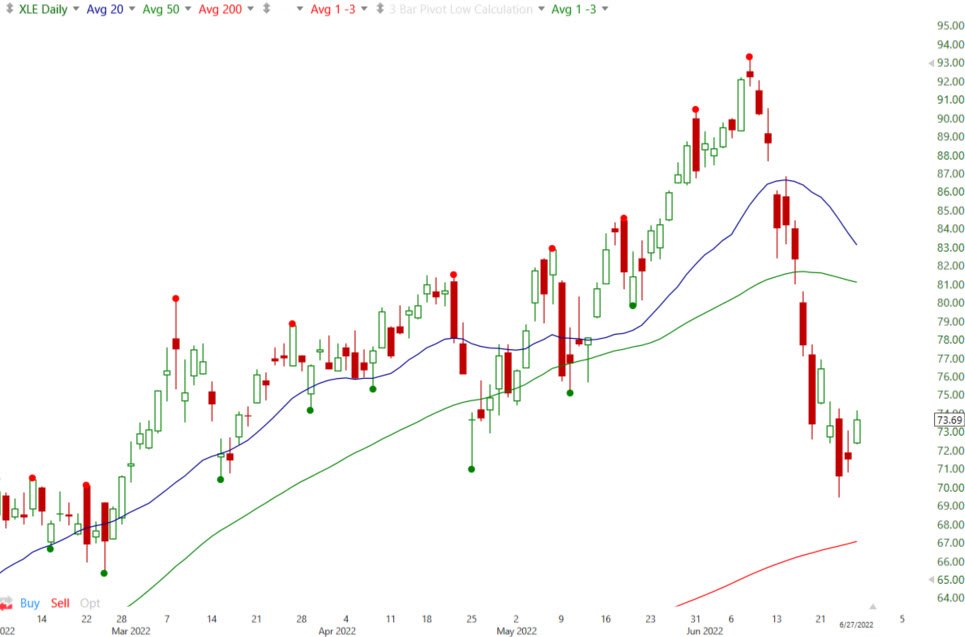
For example, XLE shows a climatic buy setup. It’s a counter-trend strategy that expects a bounce in an extended move lower.
A Bull Put Credit Spread could also be used. Based on the current chart, we would have to see if there is a premium in options and what time to expire makes sense.
Also, we can look at stocks in each sector, apply the same list analysis and see which stocks are showing relative strength or weakness.
For intra-day trading, we add percentage change on the day and change from the open. It’s a simple way to see what’s strong and weak.
If the stock or sector is above its prior close and open, it’s strong that day.
Go to the chart to see if the trend and chart setup meets your plan.
Below is a Link to Download a TC2000 Layout with the Watch List Setup
The Weekly Options Trader letter scans for credit spreads that expire in ten days or less. Some trades may be one or two days—others maybe five or ten.
We do the scanning, explain the pattern and trade to you and either email them or text them. And we update intra-day through text messages in real-time.
Dan sends video updates on weekends and when new trades are opened.
The trades are excellent for creating weekly income. The education is priceless.
This month the weekly options letter is offered at a ridiculously inexpensive $33/week billed annually.
Get started by clicking here.
Monthly coaching for options is next Tuesday, so sign up for the letter and get access to the live coaching session. The session will be recorded for review.Master Trader and You Building Your Financial Future Together!
Happy trading! If you have any questions or comments, please e-mail Greg Capra at Greg@mastertrader.com or Dan Gibby at Dan@mastertrader.com