
In the Chart of the Week, I'll show you how using SMH How a Downtrend Becomes a Bullish Continuation Pattern.
Semiconductors and artificial intelligence have provided much of the market's underlying strength, even as many consumer-related groups remain in downtrends. The VanEck Semiconductor ETF (SMH) now offers a useful lesson in how Master Trader Technical Strategies uses price action to recognize a change in trend and define what should happen next.
Technical analysis should not be a collection of opinions or indicator signals. It should give you an objective process for identifying trend, support and resistance, price patterns, and the price level that would prove your analysis wrong.
How the Trend Changed
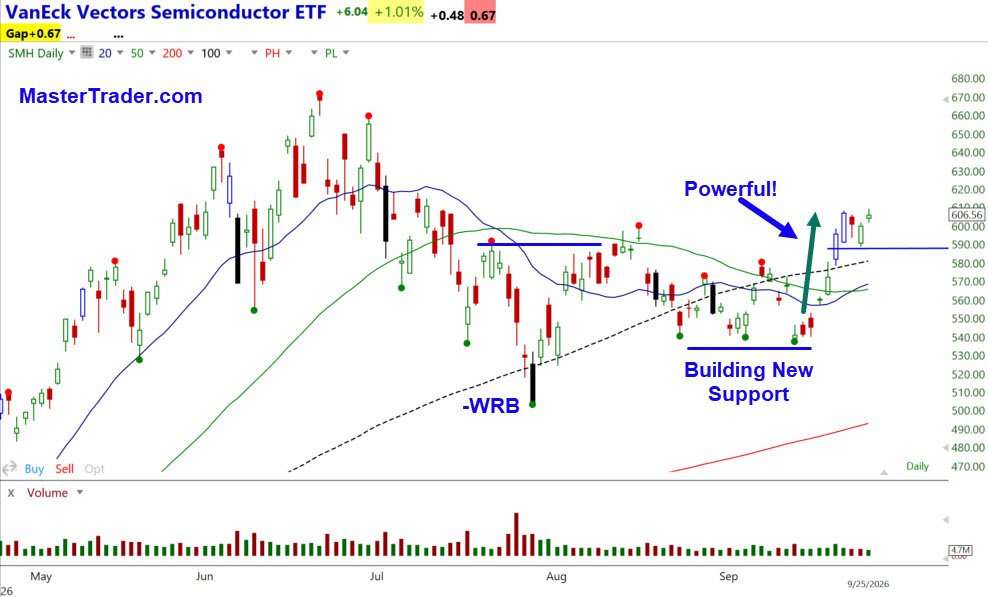
SMH declined from its June high. By late July, the decline produced a bearish wide-range bar near a semi-climactic low. At that point, a bounce was possible, but the existing downtrend still favored another move lower.
The bounce then did something important: it rallied above a prior pivot high and retraced deeply into the preceding decline. In MTS, that price action breaks the established downtrend. It doesn't immediately confirm an uptrend; it tells us to stop assuming the prior sequence of lower highs and lower lows will continue.
The next step was to watch for a higher low. That higher low formed in mid-August. Several tests of the same area then built support and established a trading range. In September, SMH advanced above multiple pivot highs, changing the trend from sideways to up.
This sequence is what makes technical analysis objective: first the downtrend was broken, then support formed, and finally the breakout confirmed the new direction.
Each conclusion came from price action, not prediction.
What the Current Pattern Says
After the September breakout, SMH formed a bullish continuation pattern. Rather than pulling all the way back to the prior resistance area, which should now act as support, the ETF held higher and reversed quickly on Thursday, September 24. That shallow retracement tells us buyers were willing to step in before price reached the obvious support area.
Above Friday's high, the pattern favors continuation and the potential for a measured move higher. Once triggered, price should hold above Thursday's low. A move below that low before a breakout would weaken the immediate setup and require a fresh bar-by-bar evaluation. It would not justify arguing with the chart or forcing the original bias.
Master Trader Tip: A chart provides a working bias, not a guarantee. Every new bar either confirms, mildly contradicts, or changes that bias. Bar-by-Bar Analysis keeps the trader aligned with current price action.
Learn an Objective Process for Any Market
The same MTS principles apply whether you trade or invest in stocks, ETFs, futures, foreign exchange, or other liquid markets. The time frame may change, but trend, support and resistance, multiple-time-frame alignment, price patterns, entry, stop placement, and reward-to-risk remain the foundation.
Master Trader Education Bundles combine focused courses into complete learning paths. The Technical Trader bundles teach you how to read price action and build a repeatable plan.
Options traders can choose bundles that combine that technical foundation with directional options, credit spreads, volatility, and strategy selection. Because finding a setup is only part of the job, Advanced Position and Money Management teaches you to size positions, control total account risk, manage open trades, and protect capital when the market does something unexpected.
Explore the Master Trader Education Bundles and learn how to evaluate opportunities with an objective, price-based process.
Questions? Email me at greg@mastertrader.com.
If you have found this post helpful, Share it Forward with other Traders. All the best Greg Capra
