In this Chart of the Week, I’ll review how ESTC transitioned from a bottom, to up and looks higher.
Elastic N.V. (ESTC) has rebuilt its technical structure after an earnings gap, a sharp retracement, and a successful retest of support. The chart now presents a potential bullish setup, but price confirmation and disciplined risk management remain essential. Details below.
What Elastic Does
Elastic develops the Elasticsearch platform used for enterprise search, observability, security analytics, and AI-powered applications. Its software helps organizations search, analyze, and secure large amounts of data across cloud and on-premise environments.
Why Institutions Are Watching ESTC
In its latest quarter, Elastic reported $478 million in revenue, an increase of approximately 15% from the prior year. Adjusted earnings of $0.70 per share exceeded expectations, and management raised its full-year outlook. The company also continues to report momentum across search and AI, security, and observability.
Analyst coverage remains broadly positive, but analyst targets do not determine an MTS trade. The chart must provide the setup, entry confirmation, stop, and favorable reward relative to the planned risk.
The MTS Technical Story
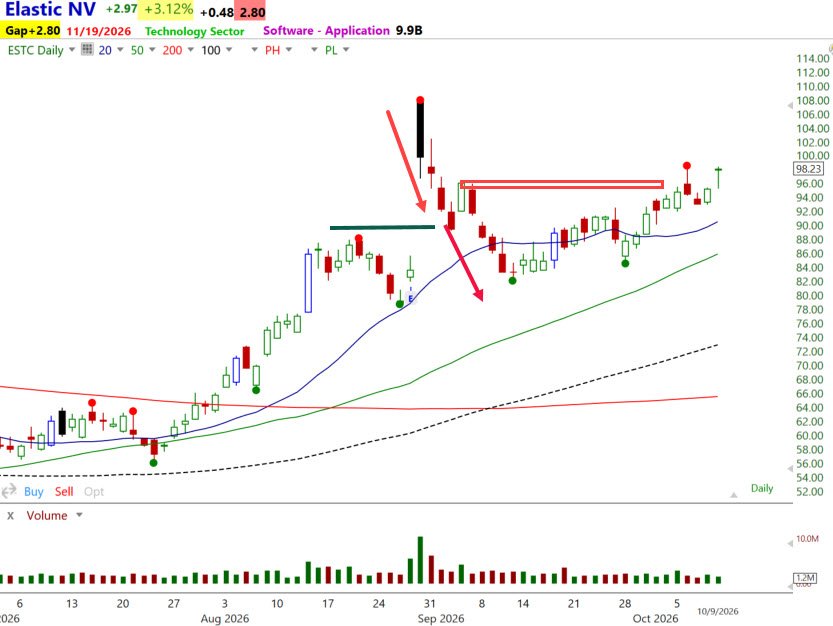
ESTC formed a bottom in July. At that time, the 20-, 50-, and 100-day moving averages began stacking bullishly, while the 200-day moving average was still declining. That arrangement showed improving short- and intermediate-term momentum, but the longer-term trend had not fully turned.
The stock then gapped sharply higher after reporting earnings in late August. The gap and wide-range advance confirmed strong demand, but profit-taking followed. ESTC first attempted to hold Minor Support, failed, and continued lower toward Major Support in a measured move.
The September pivot low stabilized the decline. That low was retested near the end of the month and confirmed in early October when buyers stepped in again. The successful retest established the foundation for the current bullish retest-and-reversal pattern.
Since then, price has moved back toward the supply created by the early-September decline. That prior breakdown area is the resistance zone ESTC must overcome. The moving averages are now stacked bullishly, with the shorter averages above the longer ones, supporting the improving trend.
The Potential Trade Setup
The entry trigger is a move above last week's high and the nearby resistance zone. That confirmation would signal that buyers have absorbed the available supply and are ready to continue the advance.
A trader should not assume that the breakout will occur. If ESTC triggers, the stop must be placed where the setup is proven wrong, and the position size should be calculated from the distance between the entry and stop. A close back below the consolidation near the $91 area would weaken the bullish pattern and require reevaluation.
Master Trader Tip A bullish pattern identifies potential. The entry trigger confirms demand, the stop defines where the analysis is wrong, and position sizing controls the dollar risk. All four parts are needed before a chart pattern becomes a complete trade plan.
Elastic is expected to report earnings on November 19. Anyone considering a position should include that scheduled event in the holding-period and risk-management decision.
Learn and Apply the MTS Method
This ESTC example brings together the core concepts behind Master Trader Technical Strategies: trend, support and resistance, gaps, moving-average alignment, Bar-by-Bar Analysis, entry confirmation, stop placement, and position sizing.
- MTS Education Learn the complete thought process through focused courses and education bundles designed for stocks, ETFs, futures, and options.
- Master Trader Membership Letters Follow the method in current markets through researched trade ideas, technical commentary, alerts, tracking, and educational video updates.
- MT Green Trading Room See MTS applied live each trading day through market analysis, trade planning, management discussions, and direct mentoring with Greg Capra.
The goal is not to depend on someone else's prediction. It is to develop the knowledge and confidence to evaluate a chart, build a trade plan, and manage risk for yourself.