At Master Trader, we teach that less is more when it comes to your charting to make money in the markets.
Candlestick Patterns are an excellent start to creating a technical analysis trading strategy. However, candlestick analysis alone is not a complete strategy.
For example, the addition of trend direction and the location of a candle reversal will increase your odds of a successful trade exponentially.
To increase the odds overwhelming in our favor, a Master Trader will look for candlestick patterns that have Multiple Time Frame (MTF) alignment as well.
These are the “Concepts” that make up the Master Trader Method (MTM).

The charts below will reference a number of those factors; however, today’s lesson will focus on these two concepts: (1) Compelling Price Pattern with Price Void – No Pattern No Trade!; and (2)Multiple Time Frame (MTF) Alignment for larger gains.
The below examples will demonstrate how Master Trader Strategies (MTS) aligns its bullish or bearish bias on Multiple Time Frames (MTF), which applies equally to any underlying instrument and any investing or trading time frame.

As the Tip states, the benefit is that MTF gives us a higher-probability Setup. It’s not that the trend or Setup has to be the same on MTF; rather, the Setup comes from the time frame being traded, and the larger time frames support that bias (bullish or bearish).
These examples will show how MTF — with a Price Void on larger time frames — are setting up Core Trading ideas (i.e., holding period of weeks to months).
Let’s start with an open trade of ours.
AR – Technical Setup and management of one of our open Core Longs in Advisory Swing and Options Trader:

The longer time frames supported the bullish bias, with a huge Price Void — meaning, we are looking for a large target.
Although we sold 1/3 of our position into strength for an impressive 41% return on capital (ROC), it is consolidating so well that we might go back to full size on a breakout.

We found the following three core long candidates during our weekend scanning.
Notice how our systematic, objective approach is the same.
We start with a compelling pattern on the daily (or weekly chart), then look to a higher time frame (monthly) to see if there is a Price Void (i.e., meaning there is no significant resistance to the left), for a longer-term hold.
The daily chart of CLVS is a nice bullish Wide Range Bar (+WRB) Breakout.

The monthly chart is a beautiful bottoming pattern and Breakout after retest.

The daily chart of TPH is a nice bullish Wide Range Bar (+WRB) Breakout.

The weekly and monthly charts both support a bullish bias with a Price Void.

The daily chart of UUUU is also a nice bullish Wide Range Bar (+WRB) Breakout from consolidation.
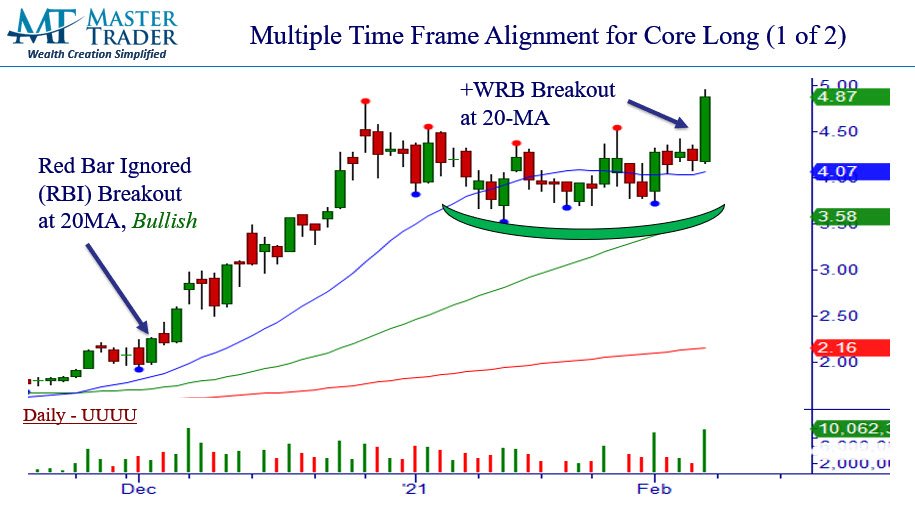
The weekly and monthly charts both support a bullish bias with a Price Void.

Master Trader Swing Trading Strategies empowers you to trades any liquid stock, ETF, option, commodity, or currency with a compelling bullish or bearish pattern on MTF.
Learn The Master Trader Swing Trading Strategies to profits over a few days to weeks to get stock and option trades on great patterns like discussed above!
For an overview of our educational offerings on trading stocks and options, CLICK HERE

Master Trader and You Building Your Financial Future Together!
Happy trading! If you have any questions or comments, please e-mail Greg Capra at Greg@mastertrader.com or Dan Gibby at Dan@mastertrader.com