
Many traders today talk about liquidity hunts as if they are some brand-new phenomenon created by algorithms. The truth is, this is nothing new. Decades before algos dominated trading floors, market makers and specialists were already doing the same thing. The only difference is that now, computers do it faster and with greater consistency.
Back in the 1990s, when I was teaching Technical Analysis (TA) to market makers and specialists, they were learning how to identify where the majority of retail traders placed stops. They understood that by running prices just past those levels, they could create liquidity for themselves. The same game is being played today — only now it’s automated.
The Classic Pattern: Stop Hunts After a 100% Retracement
One of the timeless principles I have taught for years is this:
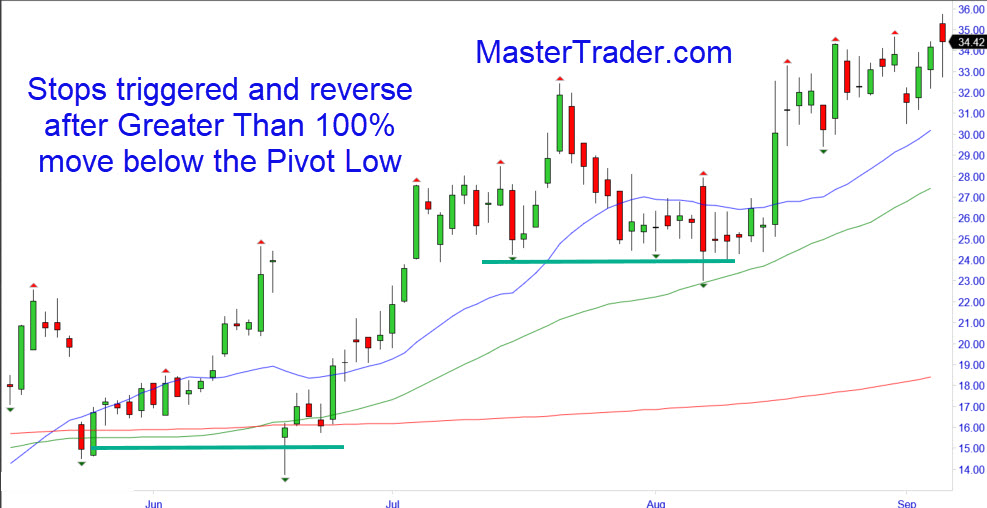
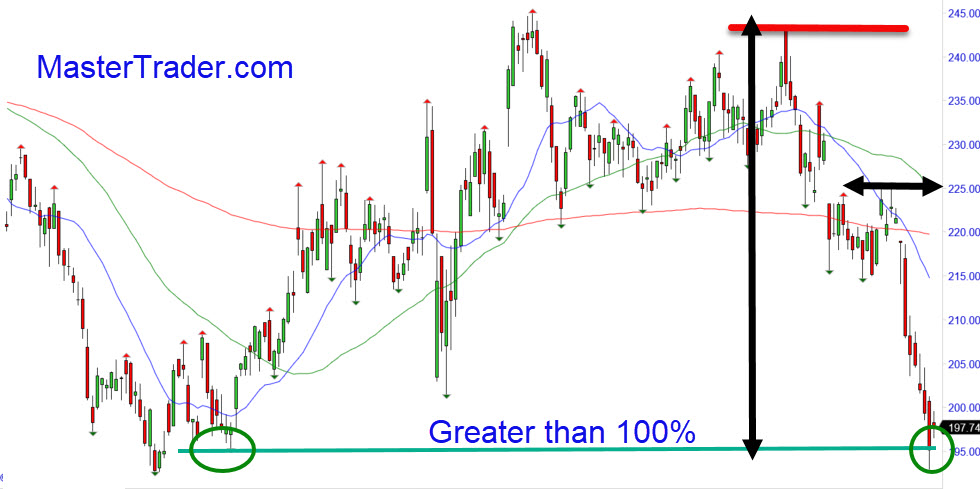
When prices make a greater than 100% retracement, meaning they move from a high to below a prior pivot low (a pivot low is a bar with at least three higher lows on each side), expect a reversal.
Here’s why:
- Stops of traders who were long are triggered.
- That stop activity creates forced selling.
- Professionals use that liquidity to enter on the opposite side.
- Very often, price reverses right after the stops are cleaned out.
This was true when humans did it, and algos eventually learned to do the same thing.
Example in an Uptrend
How Master Traders Protect Themselves
Liquidity hunts are part of the game. You don’t stop them — you learn to avoid being the victim and instead position yourself to take advantage of them. Here are some rules of thumb I teach in Master Trader education for investors, swing traders, and day traders:
Don’t place stops right at obvious levels.
If you put your stop-loss just under Major Support (MS) in an uptrend (or just above Major Resistance in a downtrend), you’re asking to get taken out. Give the stop a little more room below MS (or above MR).
Look to be a buyer after the liquidity grab.
If the instrument is in an uptrend and prices dip below MS to trigger stops, watch for a reversal candlestick pattern (e.g., bottoming tail, engulfing bar). That’s your confirmation to enter.
Fade the exhaustion move in downtrends.
If prices have been trending lower, accelerating lower, and stretching far from resistance, watch for a break of the most recent low followed by a bullish reversal candle. This is often a great long setup.
Apply it to your time frame.
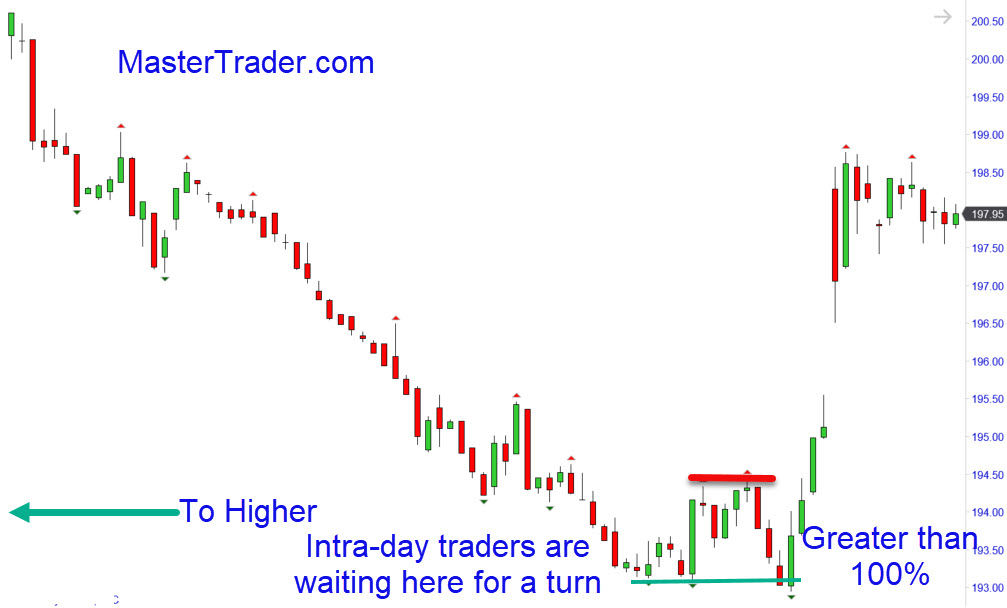
Whether you’re swing trading off the daily chart or day trading off the 5-minute, the principle works the same. The key is confirmation.
Example in a Climactic Move Lower and Greater than 100% Move - Daily
Master Traders Use the Higher Time Above as a Turn Guide Intra-day
Education Beats Indicators
Most retail traders lose to liquidity hunts because they rely on indicators and “signals” instead of learning how markets actually work. Indicators lag. Price patterns and market structure — pictures of psychology in motion — give you the real edge.
At Master Trader, we teach you the Techno-Fundamental approach — blending technical analysis, market internals, and intermarket analysis — so you can see through the noise and trade with confidence.
When you understand these principles, you stop being the hunted and start trading with the hunters.
MasterTrader Tip: Liquidity hunts aren’t new. They’ve been around since the 1990s when market makers used them, and today’s algos have automated the same playbook.
With proper education, you can avoid being shaken out and instead profit from these high-probability setups — whether you’re investing, swing trading, or day trading.
Why choose Master Trader for your Financial Future?
