

Some of last week's comments included,
"The sideways consolidation in many indices and sectors followed by Thursday's bearish reversal bar indicates the correction will continue.
The 10- and 30-year interest rates charts suggest that they will move higher, and if they do, the probability is that equities will move lower.
Based on last week's price action, institutions are nervous, and it's warranted."
More...
We have been pointing out the risks of a market correction for a little while. The correction was unfolding into another sideways one.
Sideways corrections in an uptrend are bullish and suggest higher prices.
However, at this time, rising markets have been heavily pinned to a belief that lower rates are coming.
The rising prices of crude oil, gasoline, commodities, Gold, and the Dollar -- and the slowly rising interest rates shown in last week's letter -- suggested that the Fed could/should not lower the Fed Funds rate, but markets ignored it.
The inflation data reported last week confirmed what the charts told us: that the majority realized that the Fed would not be lowering rates soon.
The widely hoped-for rate cut in June has almost expired, and a rate cut in July is about a 50-50 chance.
Unless crude oil begins falling, unemployment rises, and evidence exists that consumers are putting away their credit cards, a rate cut in July is even unlikely.
With so much evidence signaling a cautionary stance, buyers stepped in on Thursday, and it appeared like they would follow through on Friday.
News that reversed Apple from going over the cliff into the Void below gave institutions the relief to buy other favorites, but the buying wasn't broad-based.
Nasdaq 100 Capitalization Weighted and Equal Weighted
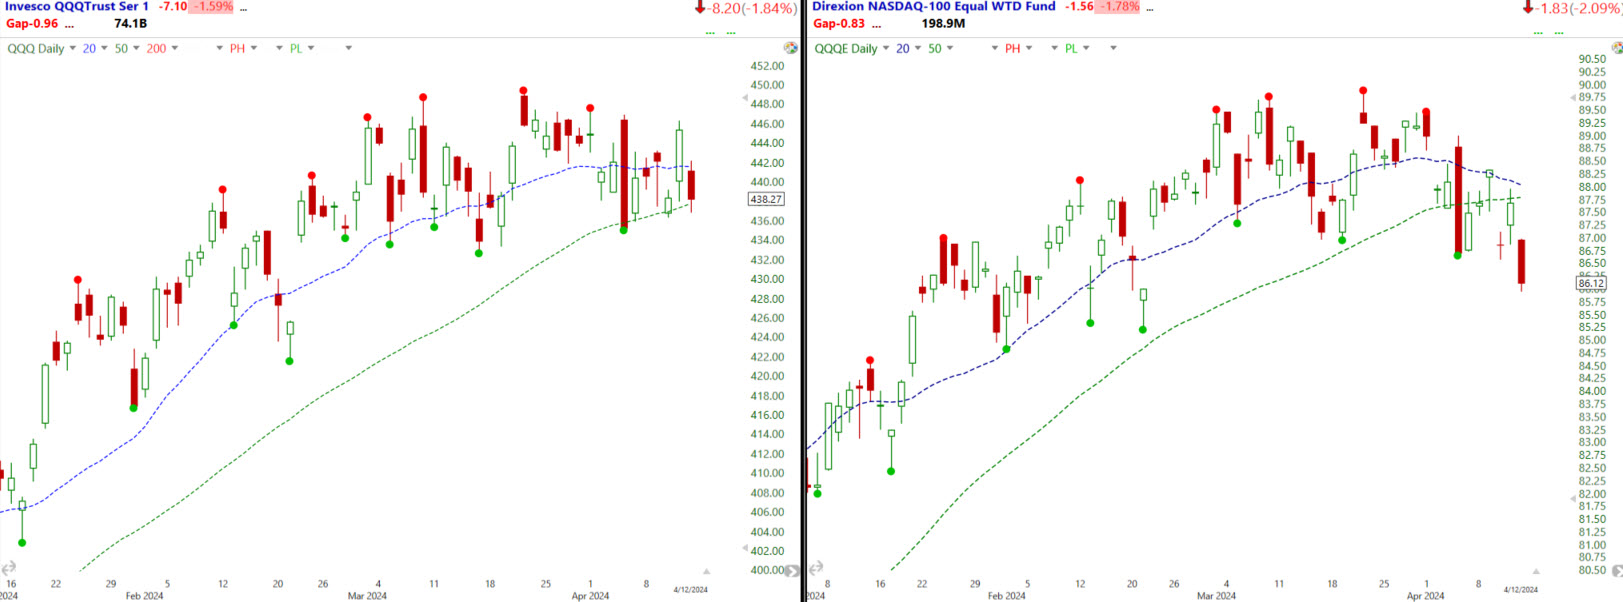
The charts above shows the Weighted NASDAQ 100 and the Equal weighted.
You can see that the equal-weighted on the right did not come close to advancing to the top of the bearish wide bar that formed last week.
The equal-weighted could not even close above the 20- and 50-MAs, which didn't mean we would see the immediate reversal on Friday.
Equity futures were still up near Thursday's highs overnight but slowly declined before the open on Friday.
Based on the complete reversal of Thursday's move, we can assume that most realized that nothing of significance had changed.
Other than a short technical bounce intraday, the selling continued into the close.
The breakdown under multiple Pivot Lows (PLs) and Major Support (MS) in the equal-weighted chart signals that prices will continue to lower.
While we must see it to know it, the market capitalization-weighted chart on the left should break down under its Major Support this week.
S&P Sector ETFs – Daily Charts
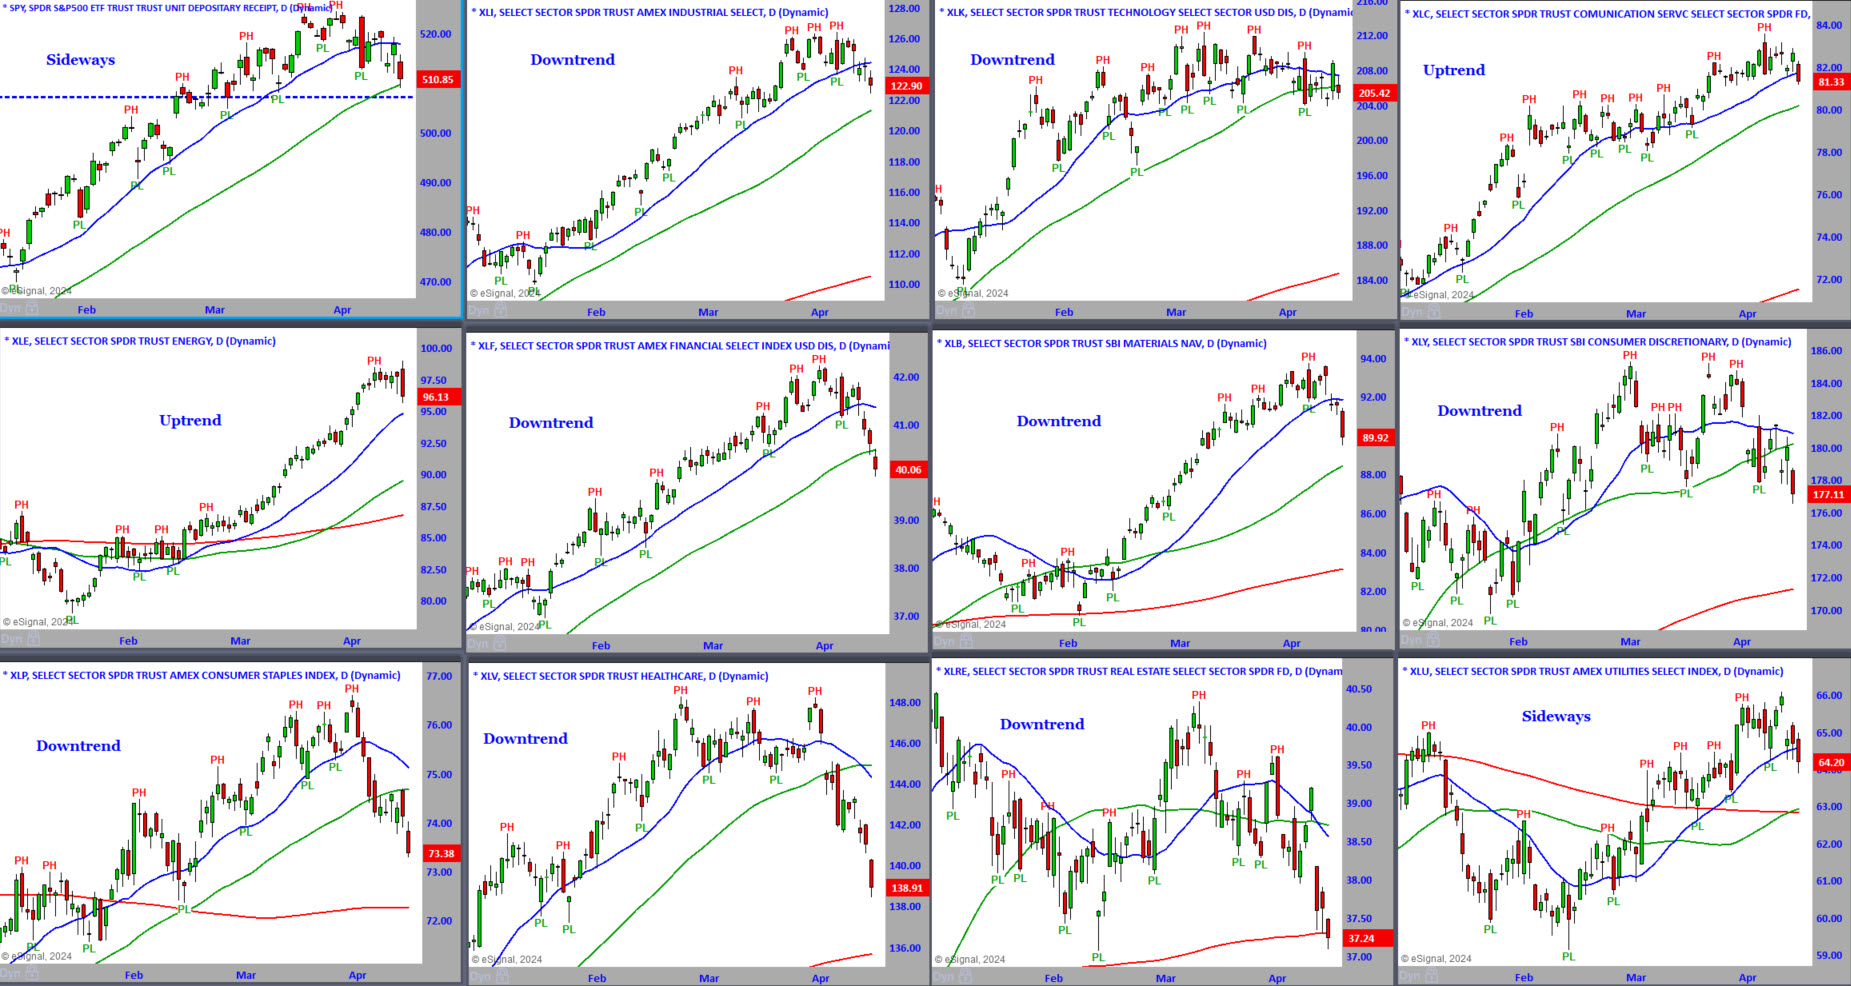
Every sector saw selling last week, and there's no reason to think it won't continue.
The S&P 500 now has a rounding top or a Head & Shoulders Top. The horizontal blue line marks the "neckline" and Major Support. The S&P 500 was able to close above the rising 50-MA (green line), which may have given institutions that follow that line as support some relief. Based on breakdowns in other sectors, the S&P 500 should soon follow lower. A close back above 520, we changed that bias.
The Industrials broke down under its Major Support but held at the next level. Master Trader Tip: When multiple levels of support are close to each other, the probability of choppy price action is likely; thus, we would not be surprised to see the industrials hold in this area support at the 50-MA.
The Technology sector has been moving sideways for over a month and closed under its Major Support the week before last. While it survived breaking lower last week, it would take a market miracle to stop that from happening soon.
The Communication Services sector has maintained its uptrend. Still, the large bearish bar the week before last and close under the recent consolidation suggests a continued move to the next support level and rising 50-MA.
The bullish uptrend in the Energy sector stalled last week, and the broad-based breakdown in other sectors also triggered profit-taking in energy stocks.
As mentioned, selling occurred everywhere, and even the bullish trend in Gold, which was at all-time highs, was sold to take profits.
In last week's letter, we pointed out the topping pattern in Financials and the area of Major Support below. After J.P. Morgan (JPM) and other banks reported earnings, this sector fell sharply below support in the rising 50 MA—another bearish event suggesting lower prices for the broader markets. Bank of America (BAC) will report its earnings on Tuesday.
In February, we pointed out the beginning of the Material sector's rise and the long-term top of the trading range in the last couple of weeks. Rising to the top of the range suggested that selling would begin, which it did last week in earnest. The bearish wide-range bar (-WRB) that formed on Friday signals lower prices are ahead.
The Consumer Discretionary sector broke down under Major Support, signaling lower prices, and there may be a slight positive in this intermediate term. For the Fed to begin to entertain lowering interest rates, it will need to see the consumer stop spending.
When more evidence is seen that inflation is under control -- which will happen if there is less demand -- the long-awaited rate cuts will become more likely. However, there will be some pain ahead before improvement.
The Consumer Staples sector began breaking down the week before and continued lower last week. Another good sign may be that consumers realize prices are too high and stop spending.
The Healthcare sector also broke down the week before and continued lower last week. This sector bottomed with others at last year's end and is now a significant overhead resistance area. The 200-MA (red line) below is a target.
We have often pointed out that real estate and utilities are vulnerable to declines when interest rates rise. Those rising interest rates negatively affected real estate last week, but the 200-MA was held on Friday.
Considering the rising interest rates, the utility sector held up relatively well, but we would not assume it will continue unless rates fall.
S&P Sector ETFs – Weekly Charts

There weren't any trend changes in the weekly timeframe, but this is the second red week across all ETFs except for energy.
Many sectors have three or four weeks sideways and now a break lower.
The S&P 500 and the Industrials are moving down to the consolidation before a breakout and a break below those areas will confirm the bearish reversal.
The Financials and Materials formed Range Expansion (R/E) bearish reversals, which rarely reverse quickly and typically result in lower prices.
Healthcare had two bearish -WRBs and is nearing support where it should stabilize.
Most of the weekly trends do not have a Pivot Low (Major Support) nearby, which tells you the uptrend was strong, and there isn't any significant support below.
Master Trader Tip: Strong trends without pivots do not need significant support to maintain an uptrend. So, new demand will have to create a higher support level in the weeks ahead.
S&P Sector ETFs – Sorted by Yearly Percent Change This Week
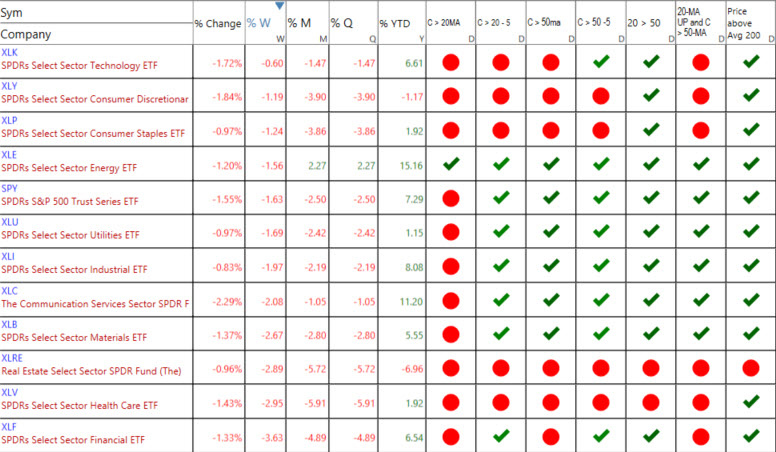
The percent changes tell you which sectors were the strongest or weakest on Friday and for the week, month, quarter, and year.
There are seven columns after the percent changes in the sector list above.
You can see the ETFs that are the strongest getting stronger or weakening.
- Close above or below the 20-MA.
- Close above or below the 20-MA 5 Days Ago. C>20 -5
- Close above or below the 50-MA.
- Close above or below the 50-MA 5 Days Ago. C>50 -5
- 20-MA above or below the 50-MA.
- 20-MA is pointed up, and the close is above the 50-MA.
- Close above or below the 200-MA
Every sector closed with a loss last week.
The week before, we pointed out four sectors closed below their 20-MA. This week, every sector except for energy closed below its 20-MA.
Three weeks ago, every sector was above its 50-MA. Last week, six sectors closed below the 50-MA and the S&P 500 barely held above its 50-MA.
The broader markets are weakening, and the only sector above its 20-MA is energy, which is not a positive for the broader markets.
The worst performer was the Financials, which lost over 3 ½% last week and is almost down 5% from its high. An unfilled gap from February 21 may be the first stall point that prices may retrace from before going lower. There is another unfilled gap from February 14 and an area of Major Support in the 38.50 area.
Where are the Markets Headed this Week?
Nothing short of a miracle will save this market from correcting further.
The internal market gauges are not extreme and, surprisingly, there wasn't a large amount of put buying on Friday like the prior three weeks.
Interest rates increased, and the belief that the Fed would cut interest rates in the near-term evaporated.
It isn't much, but it was encouraging to see crude oil and energy stocks give back their gap higher than close lower on Friday. Also, Gold reversed lower on high-volume.
Large bearish reversal bars are not as much of a concern in a strong uptrend, but energy stocks and Gold were extended. There should be buyers waiting below to buy these strong trends.
The message from the Fed has become clear that they're not in a hurry to cut interest rates, which disappointed the market, so the markets will have to trade on earnings reports instead of hopes for a rate cut.
DOW JONES

Above is the Dow Jones Industrial Average chart we review for monthly MTS education and information.
We have been pointing out the increasing extension between the 200- and 50-MAs to display the growing risk of a correction, which is now underway.
The M-Top and confirming bearish -WRB that formed the prior week virtually guaranteed lower prices.
Last week, the Dow closed below multiple Pivot Lows (PLs) and the 50-MA.
The Dow has entered into the Void of price support and, while we wish prices would fall immediately to the Major Support (MS) below in the 37,200 area, that typically doesn't happen so fast.
As that correction unfolds, the 20-MA will move below the 50-MA, and those moving averages will move lower, and the 200-MA higher as the moving averages come closer together.
Times of correction are when new and old investors and traders don't adhere to stops or get caught in a negative surprise and do not manage them properly, resulting in them being taken out of the markets.
Don't let that be you.
VIDEO REVIEW OF MARKETS, SECTORS AND INTERNALS - Click lower right to open Full Screen.
[s3mm type="video" s3bucket="mastertrader2" s3region="us-east-1" files="greg-2024/MarketUPdate_4_15_24.mp4" source="cloudfront" /]
NEW STOCK TRADING IDEAS and Video Update Below
NOTE: Please see the document in RESOURCES entitled Master Trader Guidelines for Trading the Open and Gaps.
4/15: IZM - Short watch, Climactic Sell Setup and Topping Tail.

4/15: ROKU – Under $59.77, consider shorting the stock. Sell Setup and reversal at the 20-MA, -123 weekly/monthly. Earnings 4/25. Stop $63.22.

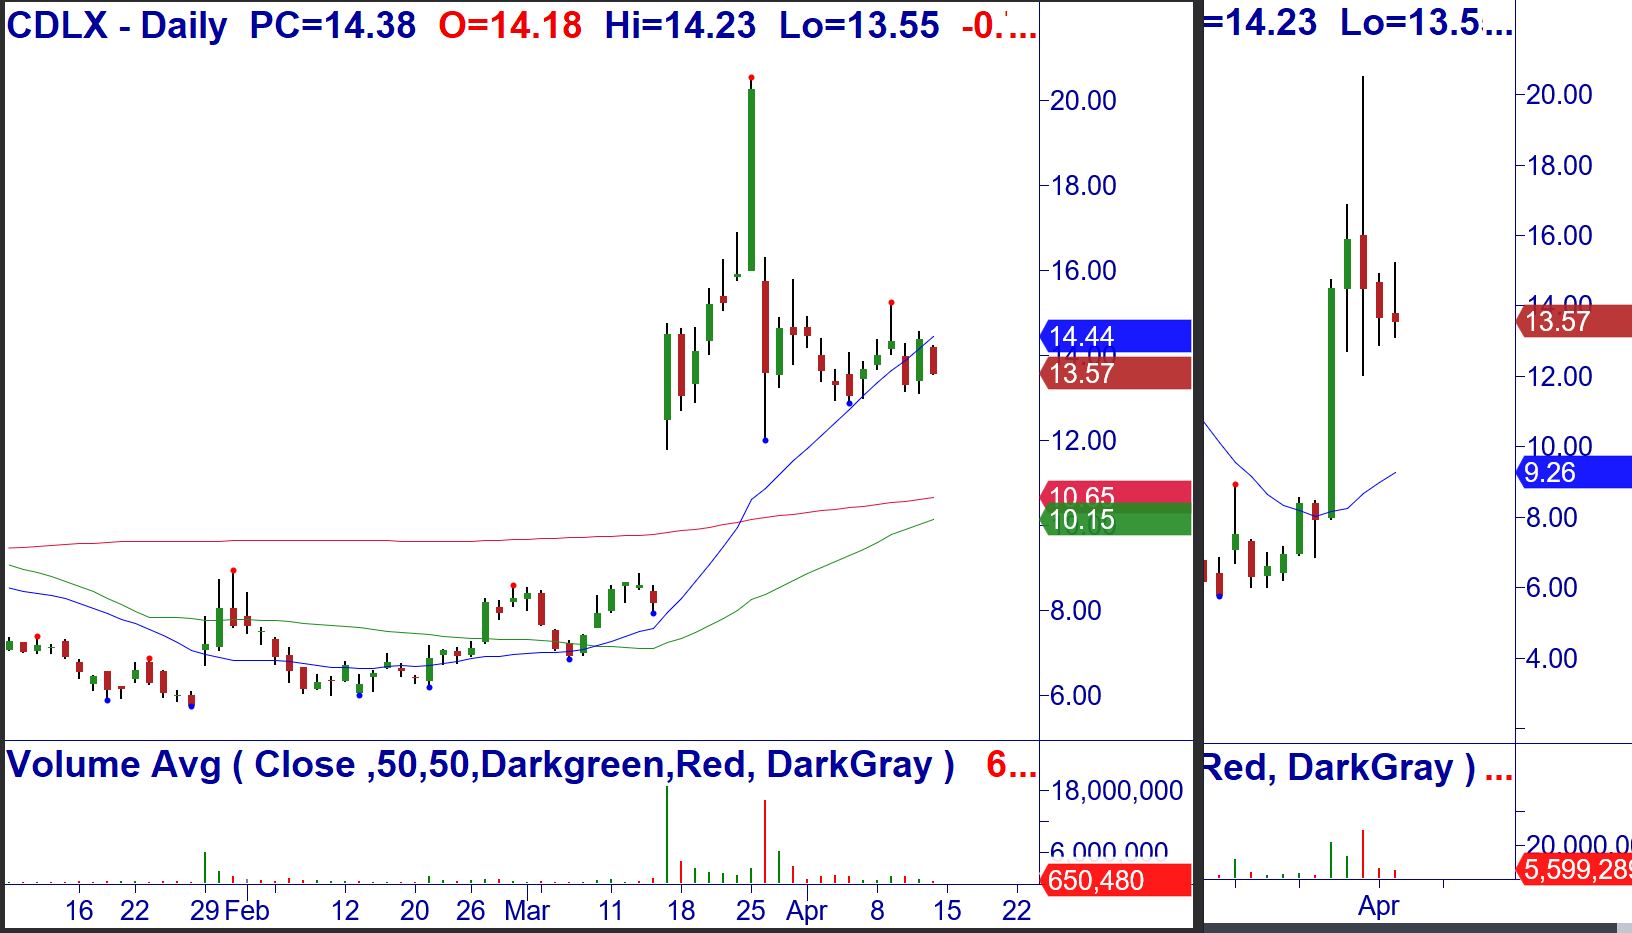
4/15: CDLX – Over $14.56, consider buying a half lot of the stock as a core long. Breakout at the 20-MA, Buy Setup weekly, Breakout of a bottoming pattern monthly. Earnings 5/2. Stop $11.88.
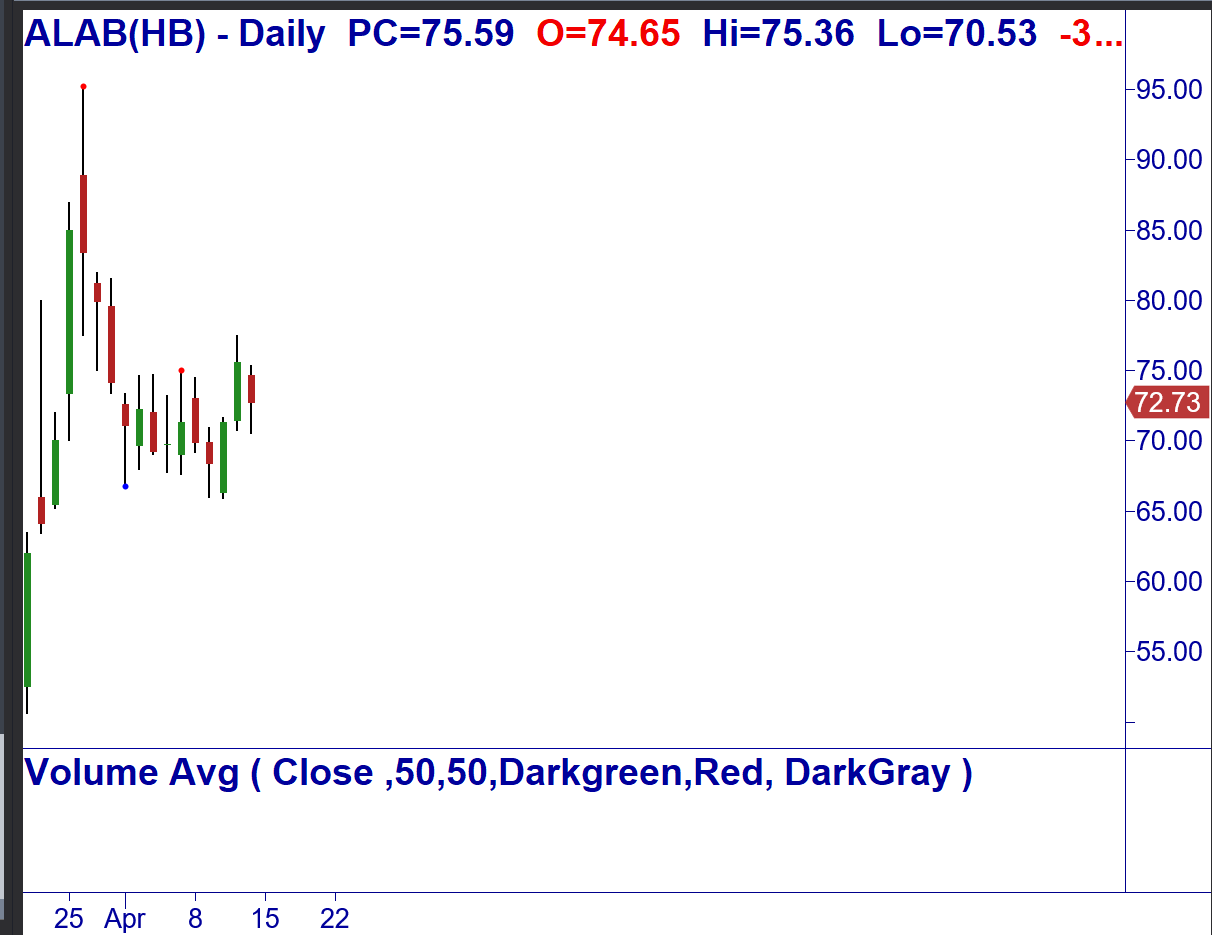
4/15: ALAB – Over $76.27 (15-Min. resistance), consider buying a half lot of the stock. Inside bar after Breakout. Stop $67.48.
4/15: GDRX – Over $7.05, consider buying a half position of the stock. Anticipated Breakout of a bottoming pattern on support and at the 20/50-MA. Stop $6.64.

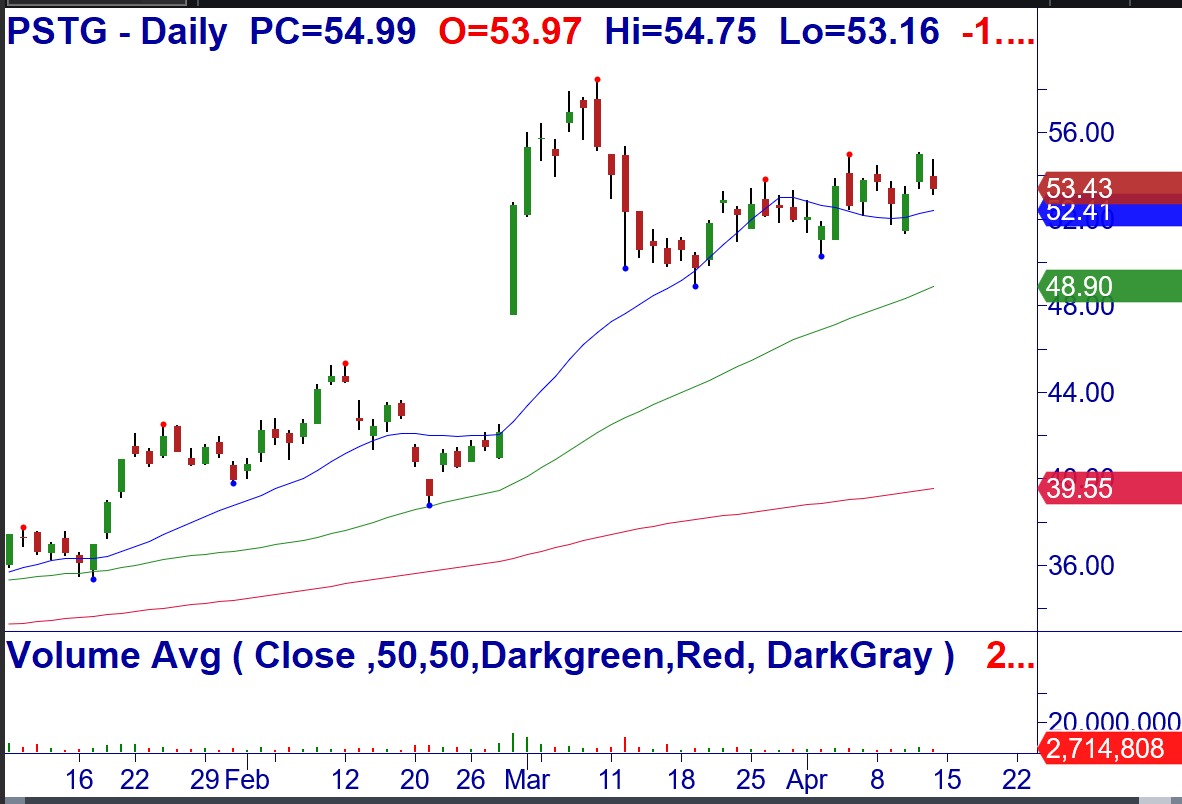
4/15: PSTG – Over $55.09, consider buying a half lot of the stock. Breakout at the 20-MA. Stop $51.34.
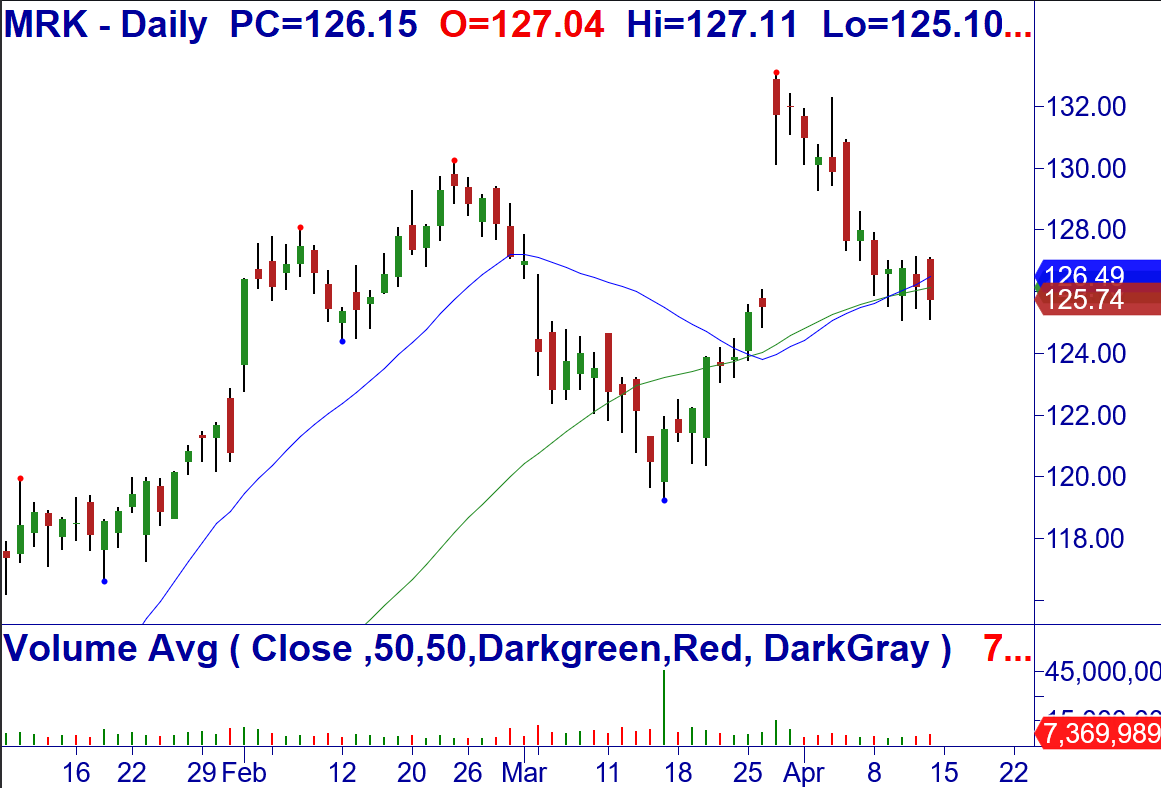
4/15: MRK – Over $127.11, consider buying the stock. Buy Setup and reversal at the 20/50-MA. Stop $125.04.
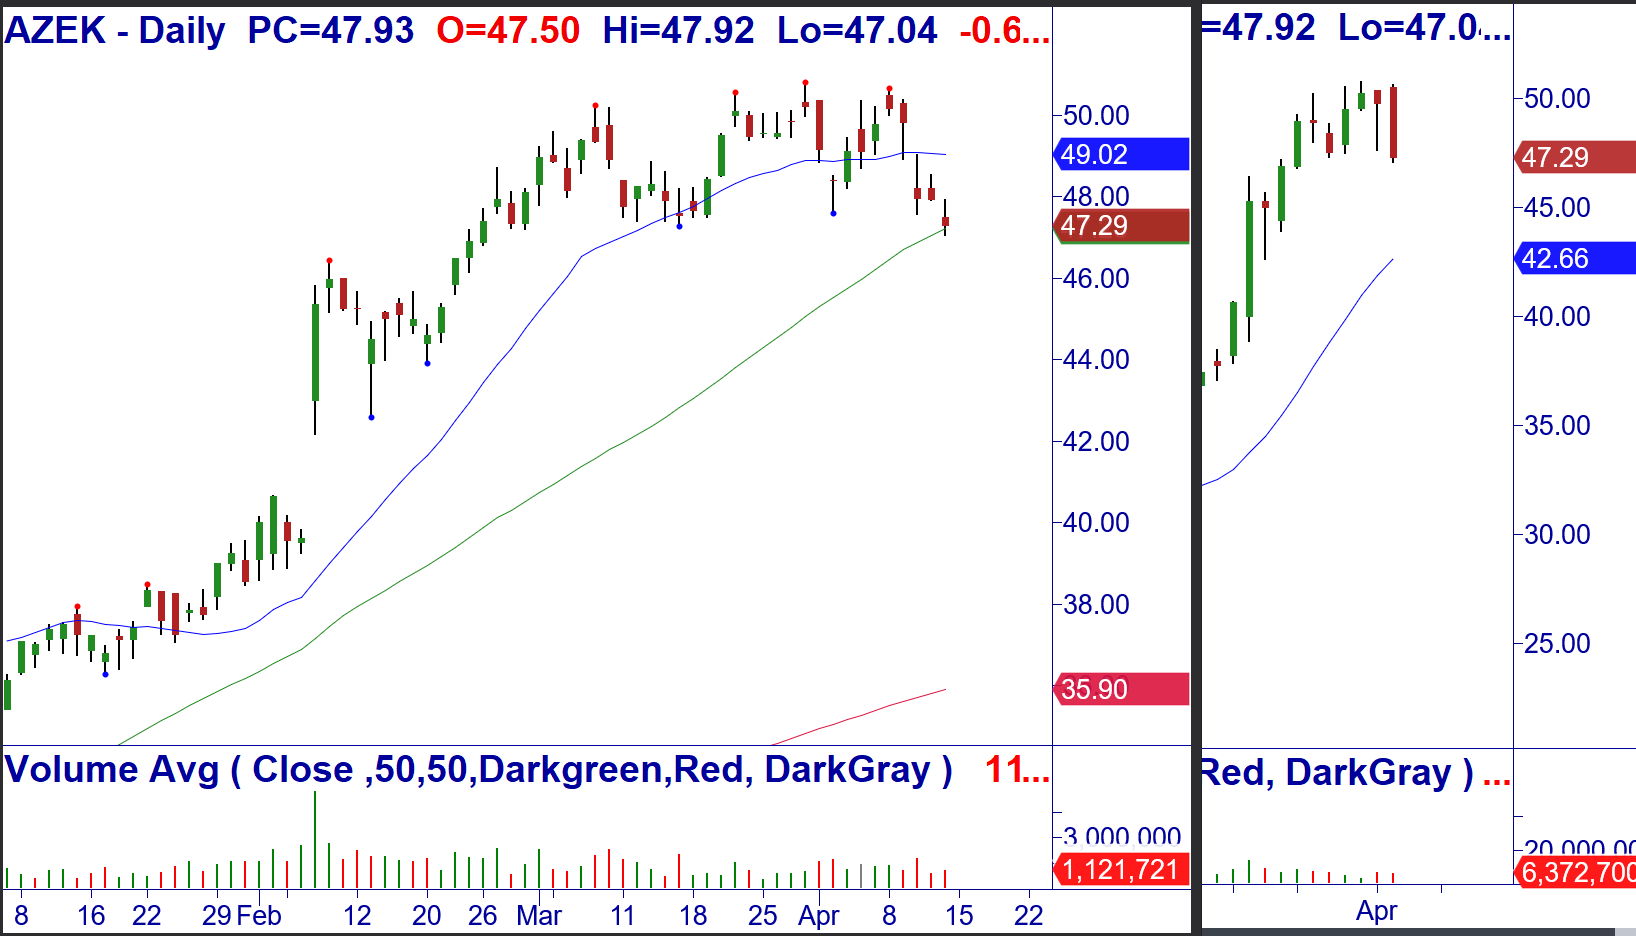
4/15: AZEK – Under $47.04, consider shorting the stock Breakdown daily/weekly. Stop $48.62.
4/15: CNM – Under $56.14, consider shorting the stock Breakdown, Climactic Sell Setup and bearish reversal weekly. Stop $57.94.

Money Management for Trading and Investing
Proper money management for investing and Trading starts with position-sizing based on the amount of money you are willing to risk on a signal trade.
CLICK HERE to review these Master Trader Guidelines and Basic Money Management and Position Sizing Table.
NEW OPTIONS TRADING IDEAS and Video Update Below
Directional Options Strategies and Debit Spreads for Swing and Day Trading Course
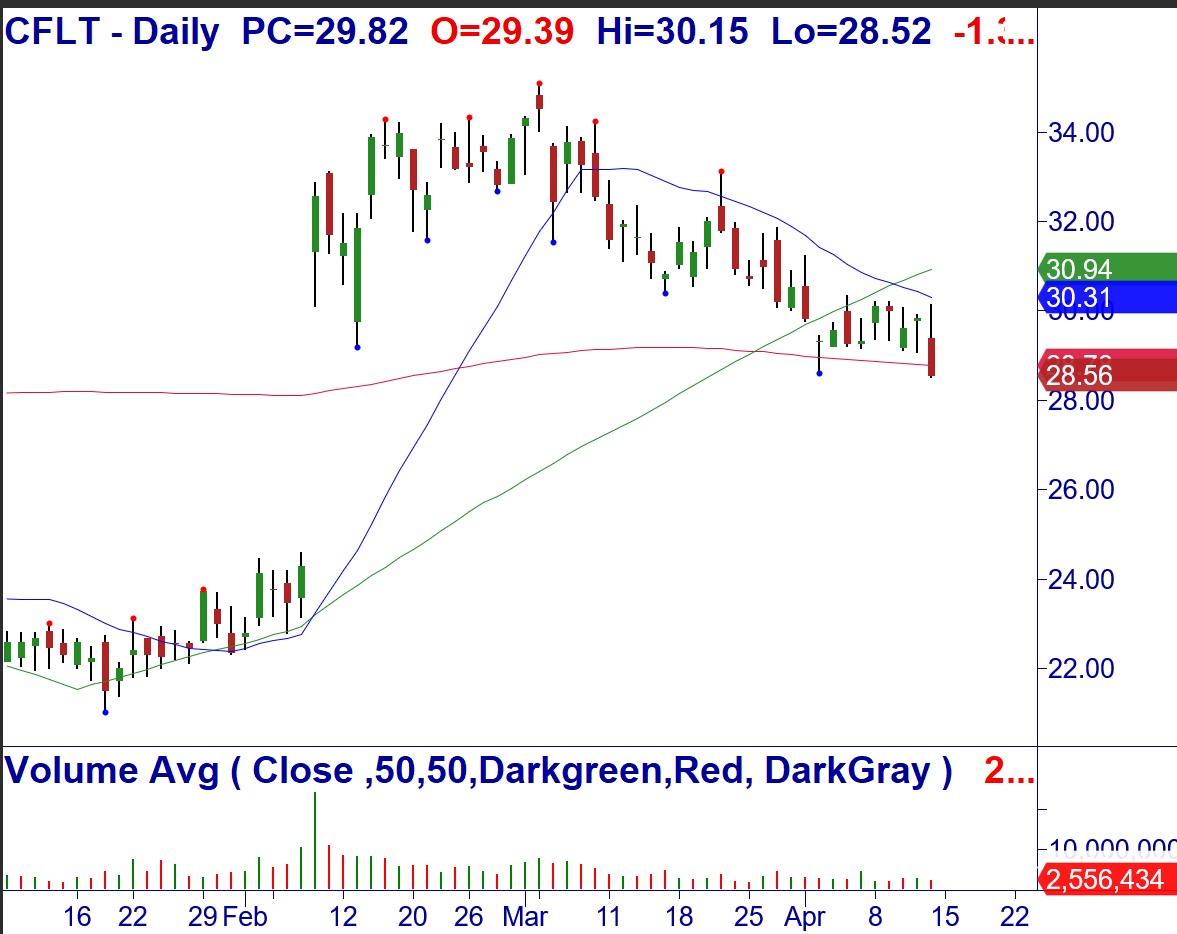
4/15: CFLT – Under $28.52, consider buying Apr (4/19) $30 puts for a limit of $1.70/share (closed at $1.68/share). Breakdown at the 20/200-MA. Stop $30.16.
4/15: S – Under $21.52, consider buying Apr (4/19) $23 puts for a limit of $1.60/share (closed at $1.40/share). Breakdown daily/weekly. Stop $22.62.

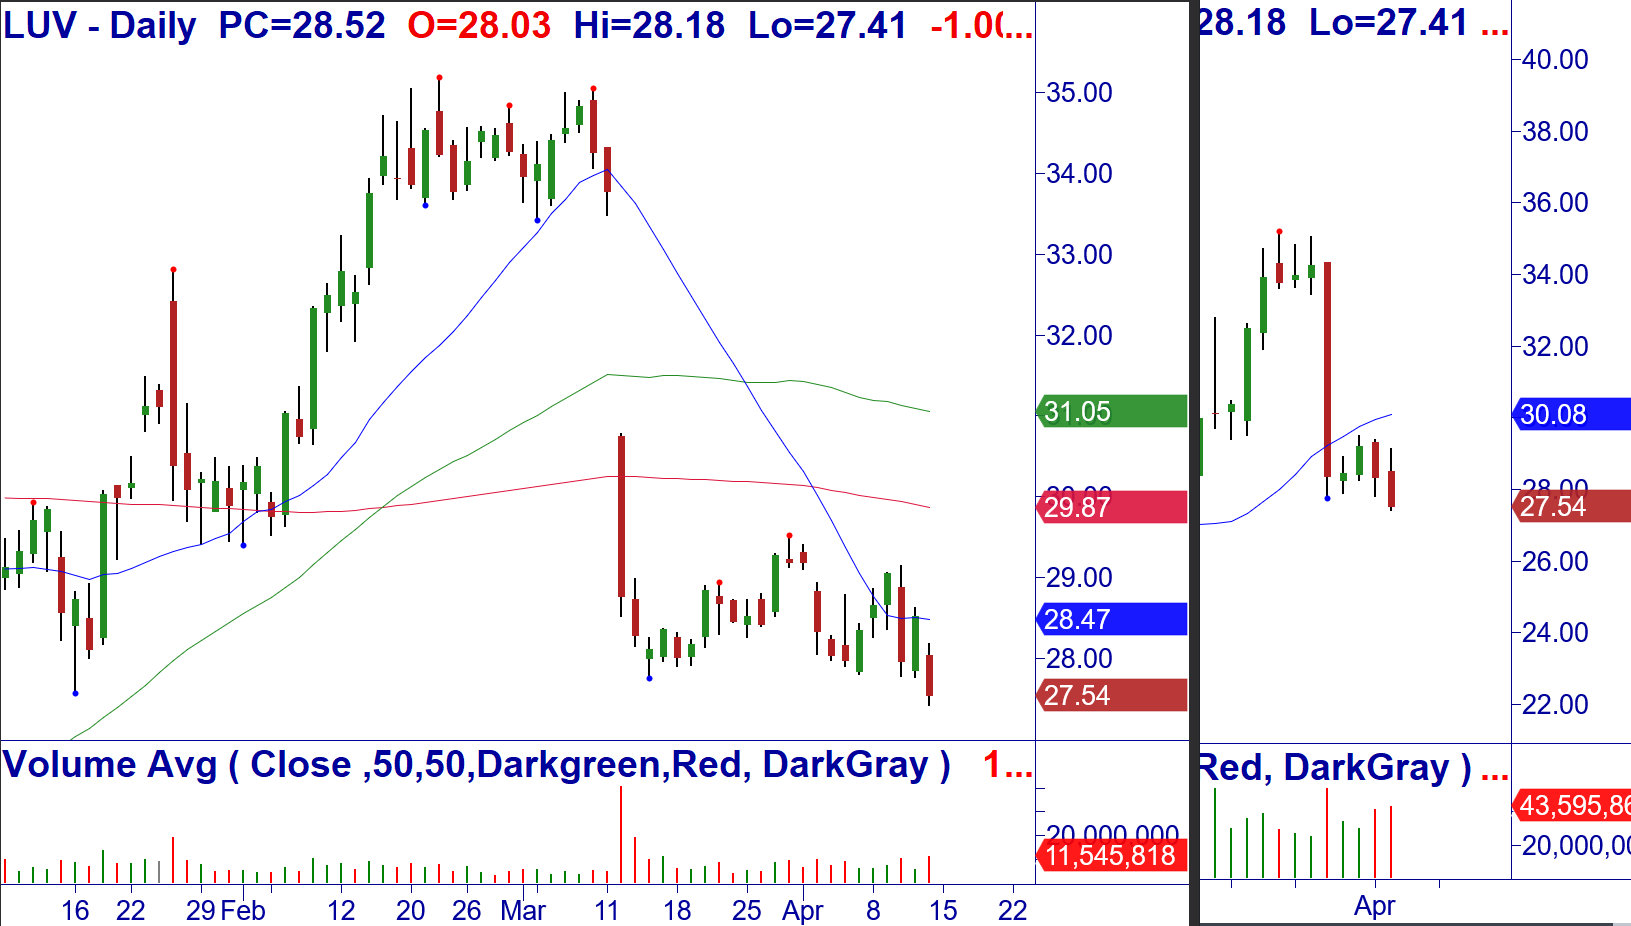
4/15: LUV – Under $27.41, consider buying Apr (4/19) $28.5 puts for a limit of $1.26/share (closed at $1.15/share). Breakdown daily/weekly at the 20-MA. Stop $28.64.
4/15: SGML – Over $15.91, consider buying Apr (4/19) $14 calls for a limit of $2.00/share (closed at $.95/share). Red Bar Ignored (RBI) Breakout of a bottoming pattern at the 20/50-MA, W-Bottom weekly. Stop $14.38.

VIDEO ON OPEN TRADES AND ADJUSTMENTS (Note: Also see the Open/Closed trade sheet in Member area
[s3mm type="video" s3bucket="mastertrader2" s3region="us-east-1" files="dans-video/advisory_240414.mp4" source="cloudfront" /]
Because your success is vital to you – and us.
Before selling options or credit spreads, we urge you to review the valuable and detailed information that we have provided for you in your Member’s Area Resources.
A quick simplified approach to calculating contract size is to simply base your contract size based on the number of shares permitted in your Trading Plan as if you were trading the stock or ETF. Simple Share Sizing = $ Risk / Stop Loss

The amount of money that you are willing to risk – divided by – the stop loss amount. For example, $100 / .20 = 500 shares. Credit Spread example, if your Trading Plan allowed you to trade 543 shares of AAPL based on the stop loss, then simply round down to the nearest hundred and short an equivalent number of contracts of the option. Since 1 contract represents 100 shares of the underlying, this would be five (5) contracts.
Master Trader and You Building Your Financial Future Together!
Happy trading! If you have any questions or comments, please e-mail Greg Capra at Greg@mastertrader.com or Dan Gibby at Dan@mastertrader.com
All the best,
Greg Capra Managing Director of Master Trader
Dan Gibby Chief Options Strategist
NOTE: Master Trader will show the opening and closing prices of all stock and options trades. We recommend that all traders and investors use proper share sizing for positions and money management. However, we cannot recommend what that is for your particular trading style, risk tolerance, or account balance. We urge you to calculate your own share/position size based on your individualized risk parameters, Trading Plan, and familiarity with the proposed trade strategy and risk. Advanced Management Strategies (AMS) covers in detail foundation and advanced position and money management.
NOTE: Master Trader and its representatives may have existing positions in actual or other trade recommendations before or after suggested herein. Additionally, we may manage them differently for internal purposes based on different risk parameters than noted herein. All trade ideas and content are for informational and educational purposes only. It is not, nor is it intended to be, trading or investment advice or a recommendation that any security, option, or investment strategy is suitable for any person. Trading securities can involve high risk and the loss of any funds. Significant gaps or volatility can increase these losses, particularly for short option strategies. Investment or trading information provided may not be appropriate for all investors, and is provided without respect to individual financial sophistication, financial situation, investing time horizon or risk tolerance. Supporting documentation for any claims (including claims made on behalf of options programs), comparison, statistics, or other technical data, if applicable, will be supplied upon request. Master Trader Consulting, Inc. is not a licensed financial advisor, registered investment advisor, or a registered broker-dealer. Options, futures, and futures options are not suitable for all investors.