

Some of last week’s comments from the 3-2-26 letter included:
“Geopolitical developments make early-week positioning difficult. Gaps are possible. Oil volatility is possible, particularly with the strikes on Iran. News-driven spikes are possible.
The market is coiled.
Multiple sectors are forming wedges.
Moving averages are tightening.
Leadership is rotating.”
As anticipated, it was a wild week of trading with significant volatility across nearly every sector.
There were positives and negatives in the price action, and we’re going to walk through both. When markets move as violently as they did last week, the key is separating what structural damage from what is simply an emotional reaction to events.
The primary driver of the markets was the rapidly unfolding geopolitical situation involving the United States, Iran, and Israel. Markets do not like uncertainty, and when military developments intersect with energy markets, volatility can escalate quickly.
Crude oil surged higher, briefly exceeding $90 per barrel. The move was extraordinary. Oil rose approximately 35% last week alone and more than 50% from where the advance began in January.
That kind of move matters.
Energy prices are one of the fastest channels of transmission into the broader economy. When crude rises sharply, it quickly translates into higher fuel costs and transportation expenses, and eventually into inflationary pressure throughout the economy.
The market immediately began discounting those implications.
One of the clearest reactions was in the Dow Jones Transportation Index, which dropped nearly 8% for the week and closed below its rising 50-day moving average. Transportation stocks are highly sensitive to fuel costs and economic expectations, so the sharp decline reflected both.
However, the weakness was not isolated to transportation.
Selling pressure spread broadly across multiple sectors. The only area showing consistent strength was energy.
Adding to the uncertainty surrounding war and rapidly rising energy prices, the Nonfarm Payroll report showed an unexpected decline in U.S. employment. That data surprised markets and sharply contrasted with the previous report, increasing the perception that economic momentum may be weakening.
When markets are already on edge, conflicting economic signals can act like gasoline on a fire.
From a Techno-Fundamental perspective, several forces aligned simultaneously:
• Rising crude oil prices above $90
• Sharply rising interest rates
• Weakening economic data
• Heightened geopolitical risk
Together, those ingredients created a short-term perfect storm that pushed equities lower.
The sharp rise in interest rates added another layer of concern. When bond yields and energy prices rise simultaneously, markets begin to fear inflation persistence and the possibility that central banks may not have as much policy flexibility as investors had hoped.
That combination of higher rates and higher energy costs is precisely the environment that often brings the word stagflation back into the conversation.
Markets began to price in that possibility.
The Materials sector also experienced broad selling pressure, which is often associated with concerns about slowing economic growth. When industrial materials decline alongside transportation and rising energy costs, it reinforces the perception that economic conditions could tighten.
That said, it’s still far too early to conclude that a stagflationary environment is developing. Markets are reacting to probabilities, not certainties.
What we do know with certainty after last week is that the multi-month trading range in the S&P 500 has been broken.
For months, the market oscillated between well-defined support and resistance levels. Last week, prices closed below multiple Pivot Lows, which signals that the prior equilibrium between buyers and sellers has shifted.
From a technical standpoint, that violation signals the beginning of a new downtrend phase, at least in the short- to intermediate-term.
Another important confirmation of the broad-based nature of the selling came from the Equal-Weighted S&P 500 ETF (RSP).
Up until last week, the equal-weighted index had remained in an uptrend. That was an important positive signal because it indicated money was rotating into stocks beyond the mega-cap leaders.
Last week, that changed.
RSP also violated its uptrend, confirming that institutions were not simply selling a handful of stocks — they were reducing exposure across the board.
Except oil.
Energy was the only clear area of institutional accumulation.
During several of our pre-market reviews last week, I pointed out that institutions were aggressively hedging their portfolios by purchasing far out-of-the-money put options. Those purchases were driving option premiums significantly higher.
This type of activity doesn’t necessarily mean institutions expect a crash.
It means they are buying insurance in case one develops.
Think of it like hurricane insurance before a storm arrives. You don’t buy it because you know a hurricane will hit — you buy it because the risk of one has increased.
Other sentiment indicators confirmed the growing fear in the market.
When these gauges reach extreme levels, they often signal a short-term reversal, even if only temporary. However, there are rare occasions when sentiment becomes extreme because the market is actually entering a meltdown phase.
So far, the readings are elevated but not yet at historic panic levels.
On Friday, the Volatility Index (VIX) closed above 29, exceeding its previous high from the end of last year. A VIX reading at those levels confirms that the market expects continued elevated volatility over the next 30 days. It can change fast.
In the future, we will be watching for one of two things:
• Continued expansion in the VIX, which would suggest fear is still increasing
• A sharp reversal lower, which is often seen near market lows
Another important sentiment gauge we monitor is the put-call ratio, both for equity options and the total market.
Because daily readings can be noisy, we smooth those numbers to identify short- to intermediate-term sentiment extremes. These indicators tell us when traders become overwhelmingly bearish and begin paying almost any price for downside protection.
We also monitor the closing values of the ratios, which reveal when the market ends the day with an overwhelming number of put options relative to calls.
Those closing readings often mark moments of true fear.
Unfortunately for the bulls, those extreme readings did not occur last week.
The implication is that markets may still need to move lower before reaching the kind of panic that historically marks meaningful short-term bottoms.
In other words, the market may need to experience a moment where traders become convinced that a crash is imminent — the point where insurance is purchased at any price.
That type of emotional capitulation is often the ingredient required for durable market lows.
Until we see it, volatility is likely to remain elevated.
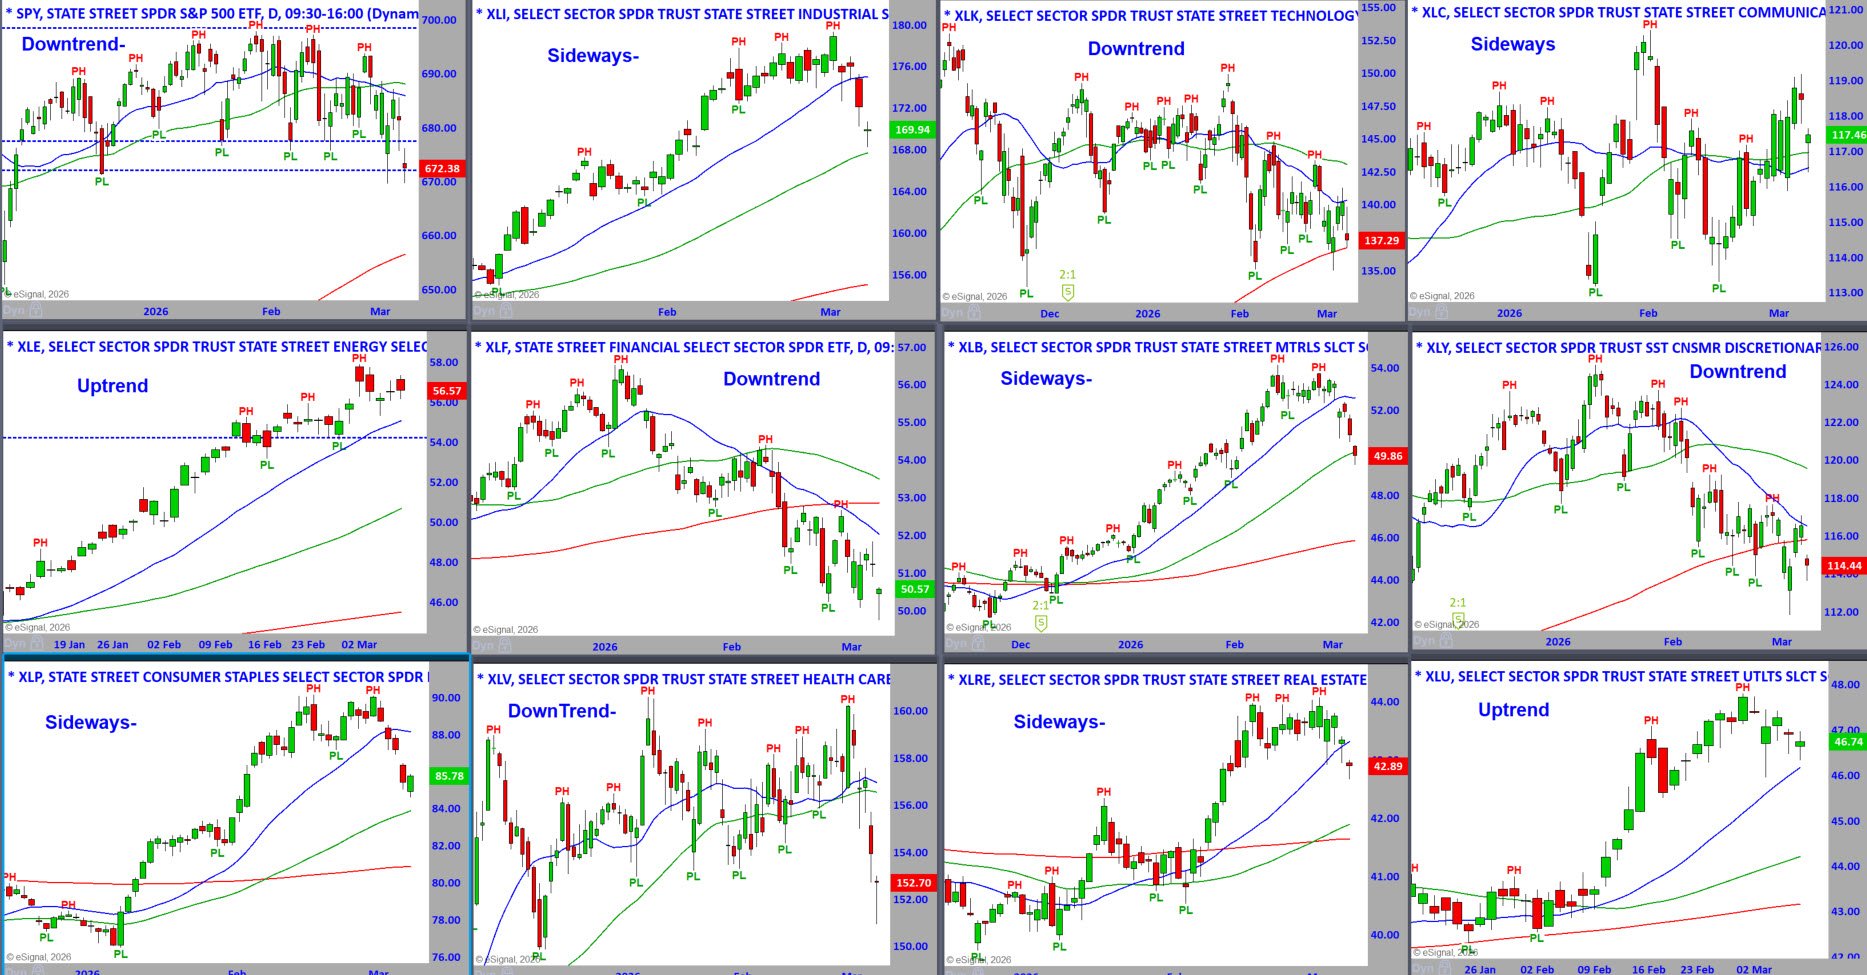
S&P Sector ETFs – Daily Charts - To See a Larger Image,
Right-Click and Press Open in a New Tab
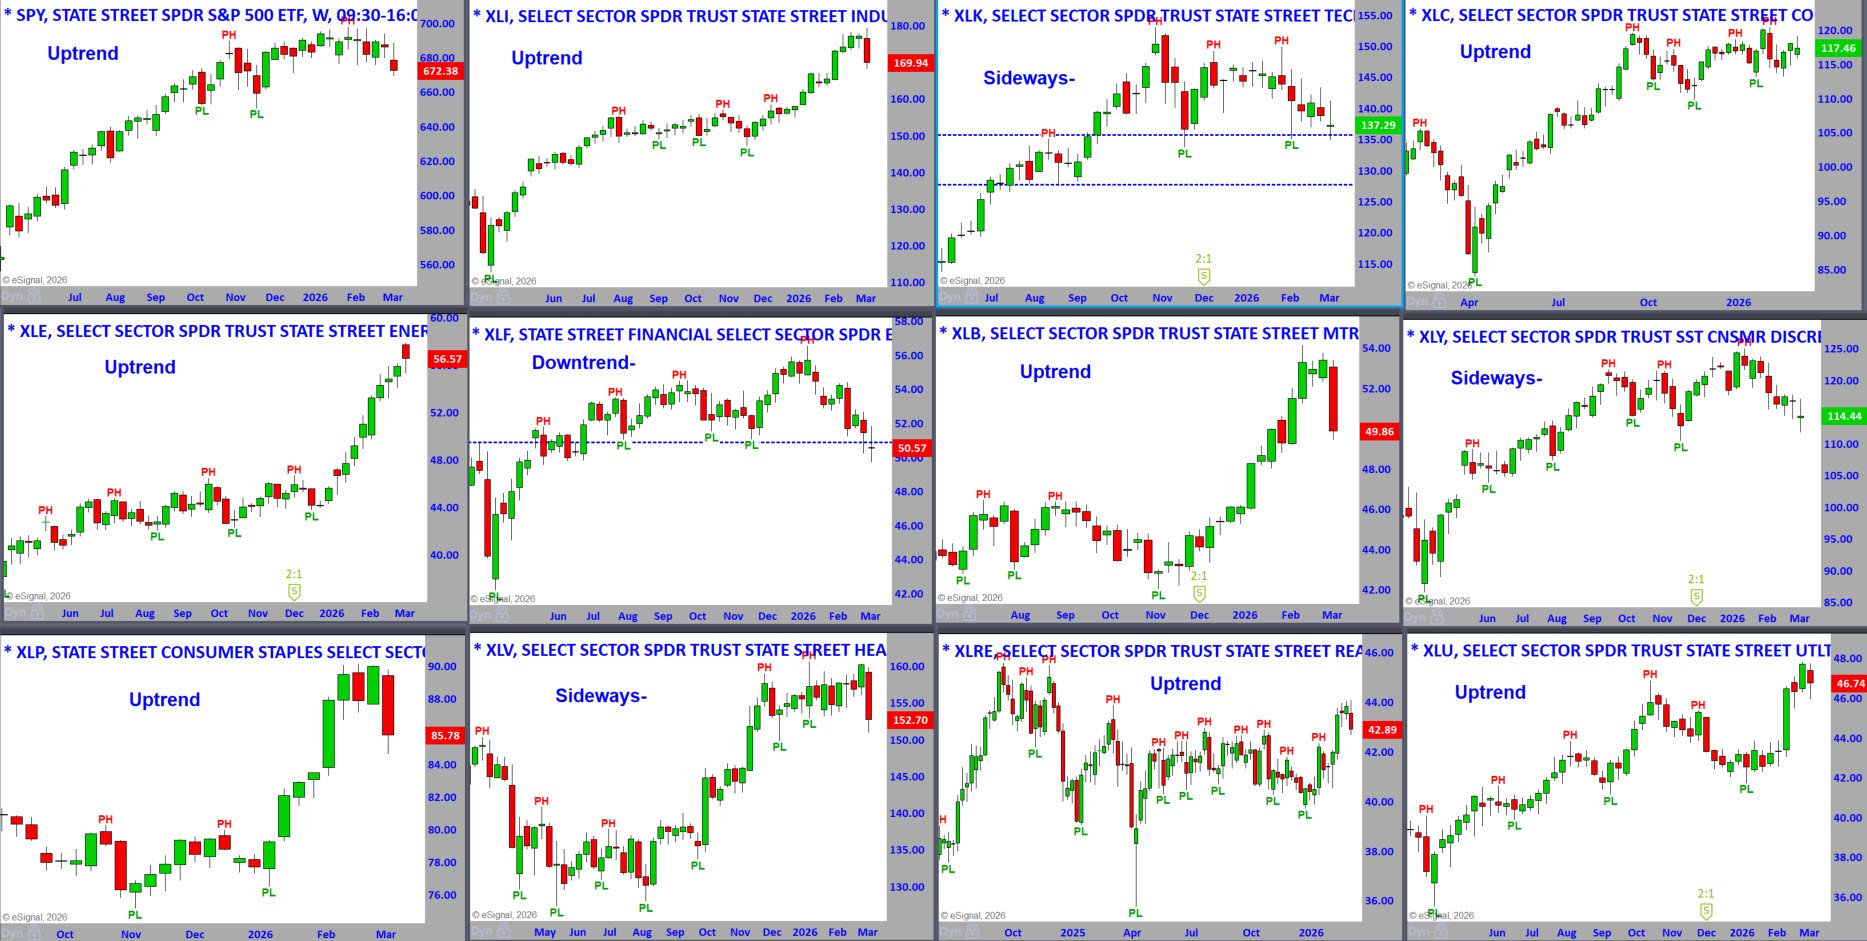
S&P Sector ETFs – Weekly Charts - To See a Larger Image,
Right-Click and Press Open in a New Tab
S&P Sector ETFs – Sorted by Weekly Percent Change This Week
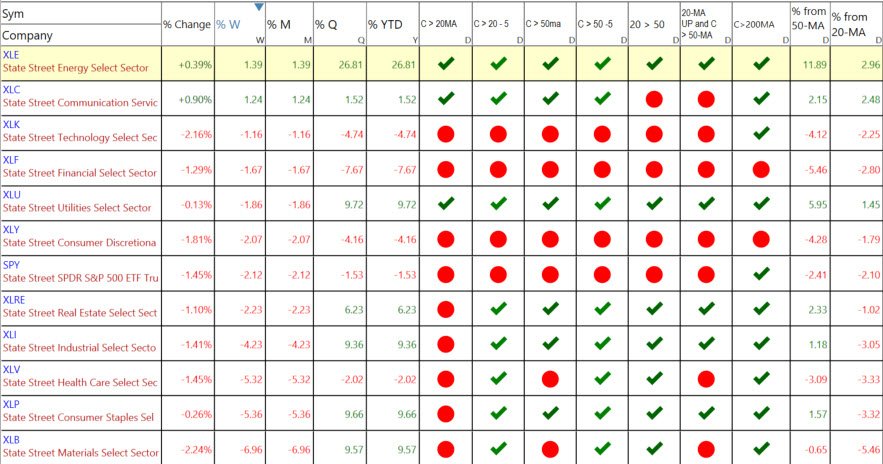
S&P 500 Sector Matrix Overview
After the percentage performance columns, the matrix displays seven technical indicators that quickly summarize trend health.
These include:
Close above or below the 20-day moving average
This tells us whether a sector is maintaining short-term momentum.
Close above or below the 20-MA five days ago (C > 20 –5)
This helps identify whether the sector has improved or deteriorated during the week.
Close above or below the 50-day moving average
The 50-MA is an important intermediate-term trend reference used by institutions.
Close above or below the 50-MA five days ago (C > 50 –5)
This allows us to quickly see shifts in trends during the week.
20-MA above or below the 50-MA
When the 20-MA is above the 50-MA, the trend structure is bullish.
20-MA pointed upward, and the close was above the 50-MA
This confirms a healthy upward trend with momentum.
Close above or below the 200-MA
The 200-MA represents the long-term trend and institutional support zone.
By reviewing the matrix week to week, we can quickly determine:
• Which sectors are strengthening
• Which sectors are weakening
• Which trends are intact
• Which sectors are becoming extended
Right now, the message is clear.
Energy remains the strongest trend but is becoming extended. Several cyclical sectors are weakening, and the broader market is showing increasing dispersion between leaders and laggards.
That type of environment typically results in more selective trading conditions, where sector rotation becomes more important than broad market exposure.
For traders using Master Trader Technical Strategies, this matrix helps narrow the focus to where institutional money is flowing — and just as importantly, where it is leaving.
The sector matrix above provides a quick “at-a-glance” view of institutional money flow. Rather than looking at charts one by one, the matrix lets us immediately see which sectors are strengthening, deteriorating, or simply moving sideways.
The first columns show percentage performance across multiple time frames — Friday, the week, month, quarter, and year-to-date. Those numbers tell us where money is flowing in the short term and whether that strength or weakness is part of a broader trend.
The columns that follow provide the technical condition of each sector relative to key moving averages, which helps determine the health of the trend and whether sectors are extended or weakening.
Together, these columns allow us to quickly answer several important questions:
- Which sectors are leading or lagging week to week
- Which trends are strengthening or deteriorating
- Which sectors are becoming extended and vulnerable to pullbacks
What the Matrix Shows This Week
At a glance, the Energy sector (XLE) continues to stand out as the clear leader. Not only has it been the strongest sector recently, but it is now nearly 12% above its 50-day moving average. That kind of distance tells us two things simultaneously:
Institutions are aggressively accumulating energy stocks.
The sector is becoming extended and vulnerable to profit-taking or consolidation.
Strong trends often become extended before correcting, so this type of reading is not bearish by itself — but it does suggest that new entries require careful timing.
Communication Services (XLC) also shows relative strength, maintaining a solid position above key moving averages.
On the other side of the spectrum, several sectors are clearly showing technical deterioration.
Technology (XLK), Financials (XLF), Consumer Discretionary (XLY), and the S&P 500 ETF (SPY) have all slipped below important moving averages and show multiple red signals in the matrix. This indicates that institutional sponsorship has weakened in those areas over the short term.
When several cyclical sectors weaken simultaneously, it often reflects a broader risk-off shift in institutional positioning.
Where are the Markets Headed this Week?
Last week, I pointed out that the market was coiled across multiple sectors, with wedges forming and moving averages tightening. Those conditions reflect price contraction and volatility — and markets cannot stay compressed forever.
That contraction released last week.
Multiple sectors broke from those tightening patterns, transitioning from sideways to down, while others shifted from uptrends into sideways consolidation. In several cases — the worst being a shift from an uptrend directly into a downtrend — the technical damage was more significant.
The earlier contraction communicated uncertainty. Last week, that uncertainty evolved into something more decisive: uncertainty about future price levels, with the initial resolution pointing lower.
That is simply the message the market delivered.
Of course, the Trump effect and the current war environment mean conditions can change rapidly. Headlines tied to geopolitics or policy announcements can shift sentiment in minutes, and markets are extremely sensitive to those developments right now.
However, as traders, we never doubt the message of price.
At the moment, the message does not suggest a contrarian opportunity. Until proven otherwise, we must assume that rallies will be sold while markets work their way toward more significant support levels. I will review those key levels in the video below.
Market Internals
Our internal market gauges are beginning to approach levels that historically occur near market lows. However, the way they reached those levels matters.
Breadth collapsed extremely quickly last week.
Rather than deteriorating gradually over several weeks — which is typical of a more orderly correction — breadth moved from neutral conditions directly to near-extreme readings in one sharp movement.
That type of movement often suggests further downside still ahead.
We saw the opposite behavior in November of last year, when breadth surged rapidly from deeply oversold levels to strong positive readings. That sudden shift communicated strong demand, and markets subsequently moved higher.
The current situation is different.
Breadth did not fall from a strong bullish condition into an extreme low. Instead, it moved from neutral directly to extreme, which historically means the market often needs to probe lower levels before a durable bottom forms.
In practical terms, this suggests that rallies are likely to be sold, at least for now.
Signs of Rotation Beneath the Surface
There were, however, a few constructive developments beneath the surface last week.
Several of the most beaten-down sectors — including Software, Staffing & Outsourcing, and Information Technology — showed relative strength despite the broader market weakness.
When the weakest sectors begin to stabilize while markets are declining, it often signals that institutions are selectively accumulating bargains.
That does not mean a bottom is in place yet.
But if the broader market continues lower and eventually retests the recent lows, those sectors could become the foundation for intermediate-term advances.
Expect Volatility
Another factor traders should keep in mind is that sharp declines often attract aggressive short-term buying.
Fast drops tend to produce reflex rallies, sometimes quite significant ones. Short-term traders and algorithmic systems are programmed to exploit oversold conditions.
However, those rallies should not be confused with trend reversals.
A rally becomes meaningful only when it meets our trend-change criteria.
Until that occurs, the dominant assumption remains that rallies are part of a corrective environment, not the beginning of a new advance.
It is also important to recognize that several of last week’s sharp declines developed from sideways consolidations.
Technically, that type of pattern often represents the beginning of a directional move rather than the end of one.
That’s why patience becomes essential in environments like this.
The highest-probability opportunities often come after the first wave of volatility, once the market reveals where buyers are truly willing to step in.
For now, we continue to monitor the Techno-Fundamentals — price action, sector rotation, market internals, and macro influences — to determine when conditions shift from defensive to opportunistic.
DOW JONES

The chart above shows the Dow Jones Industrial Average through the lens of Master Trader Technical Strategies (MTS).
If you compare this chart to the one shown in last week’s letter, you’ll notice that the Major Support (MS) levels that were previously marked have been removed.
The reason is simple: those support levels were violated on a closing basis, so they are no longer valid.
When a market breaks a key support level on a closing basis, it tells us that institutional demand was not strong enough to hold that level, and the next lower support area becomes the logical target.
Last week, the Dow moved sharply lower and reached the next Major Support level, briefly violating it intraday before buyers stepped in and pushed prices back above it by the close. Friday also saw a similar attempt to stabilize.
The Bottoming Tail (BT) on the chart tells us that buyers stepped in near the day’s low and pushed prices higher into the close. However, while that is constructive for a short-term bounce, it does not change the overall bias created by the sharp decline.
Technically, the dominant message remains that the trend momentum has shifted lower, implying a higher probability of lower prices ahead until stronger support is reached.
The decline also created a price void above — an area where prices fell quickly with very little trading activity.
Markets often attempt to retrace into these voids as part of a short-term rebound, allowing sellers to re-enter positions at higher prices.
For that reason, it would not be unusual to see the Dow attempt a short-term rally back into the void, even if the larger trend remains under pressure.
More importantly, there is also a void in price support below. When markets fall quickly through support areas, it leaves little structural support until the next significant reference point.
Historically, when that occurs, the next logical downside target becomes the rising 200-day moving average, which often acts as a major institutional support level.
Below that level lies the next Major Support area, which would become the next downside target if the 200-day moving average fails to hold.
Given the current environment — where news headlines, geopolitical developments, and rising volatility are driving price movements — it may take some time for clear patterns to develop on the daily timeframe.
For swing traders, patience is important here.
Right now, the Dow chart does not present a clean setup for a directional trade. In situations like this, we typically step aside and wait for the market to rebuild structure through consolidation or a reversal pattern.
That doesn’t mean opportunities will disappear.
There will still be sector ETFs and individual stocks forming tradable patterns, but based on the current Dow chart, this is one to save and monitor rather than trade.
In other words, place it on your watchlist with a simple note:
“Stay away until structure improves.”
VIDEO REVIEW OF MARKETS, SECTORS, AND INTERNALS - Click lower right to open Full Screen.
NEW STOCK TRADING IDEAS Below
NOTE: Please see the document in RESOURCES entitled Master Trader Guidelines for Trading the Open and Gaps.
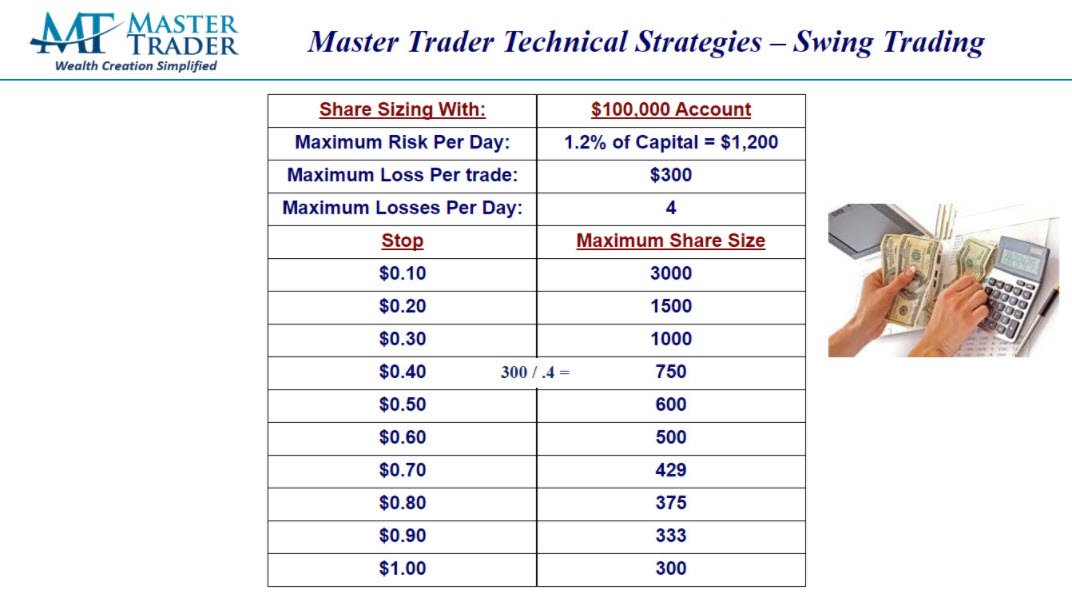
Note on Position Size Calculation in the Open Trades Sheet:
All trades are based on a hypothetical Max Loss of $300/trade. For Stocks, that is $300 / (Entry - Stop). Directional option trades use the same formula, then divided by 100, rounded down to the nearest whole number, with a minimum of one (1).
The “Master Trader Blended Method” for shorting options/spreads size starts with the stock position size, multiplying by 1.5, then divide by 100 because 1 contract represents 100 shares.
Please calculate position size according to your Max Loss per your Trading Plan.
Here's an example:
AMS Teaches You How to Maximize Profits on Every Trade. Click Here to Read More
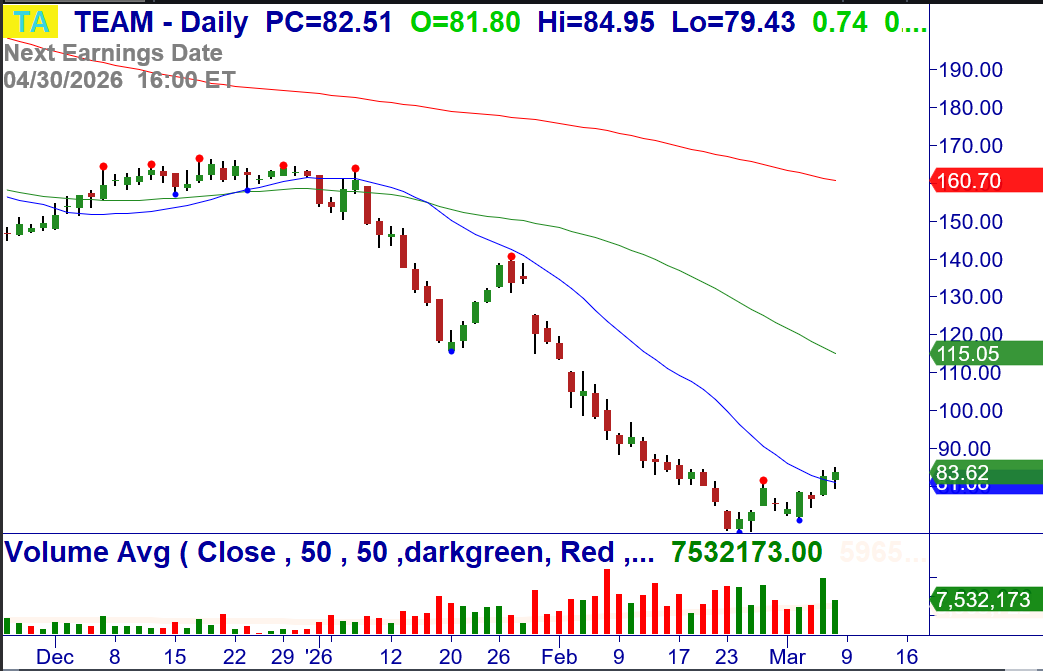
3/9: TEAM – Over $84.95, consider buying the stock. Breakout of a bottoming pattern at the 20-MA, climo weekly. Stop $75.98.
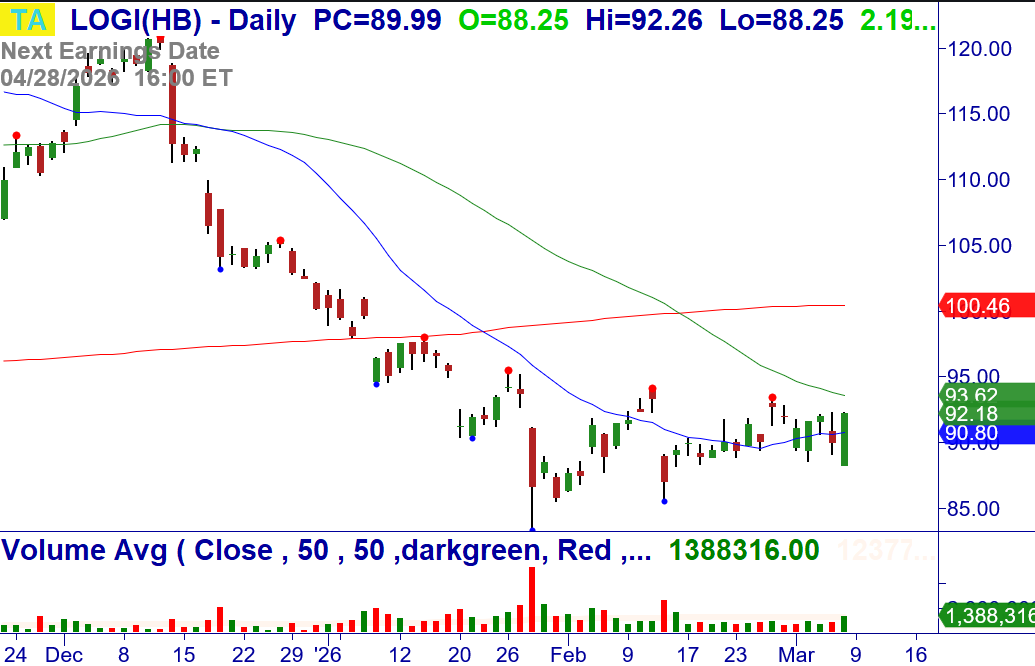
3/9: LOGI – Over $92.27, consider buying a ½ lot of the stock. Gap reversal +WRB engulfing closing Breakout of a bottoming pattern at the 20-MA. Stop $88.08.
Money Management for Trading and Investing
Proper money management for investing and Trading starts with position-sizing based on the amount of money you are willing to risk on a signal trade.
CLICK HERE to review these Master Trader Guidelines and Basic Money Management and Position Sizing Table.
NEW OPTIONS TRADING IDEAS
Directional Options Strategies and Debit Spreads for Swing Trading (See the Weekly Options Trader letter, which sells options/spreads for weekly Income that primarily expire in 10 days or less, CLICK HERE)
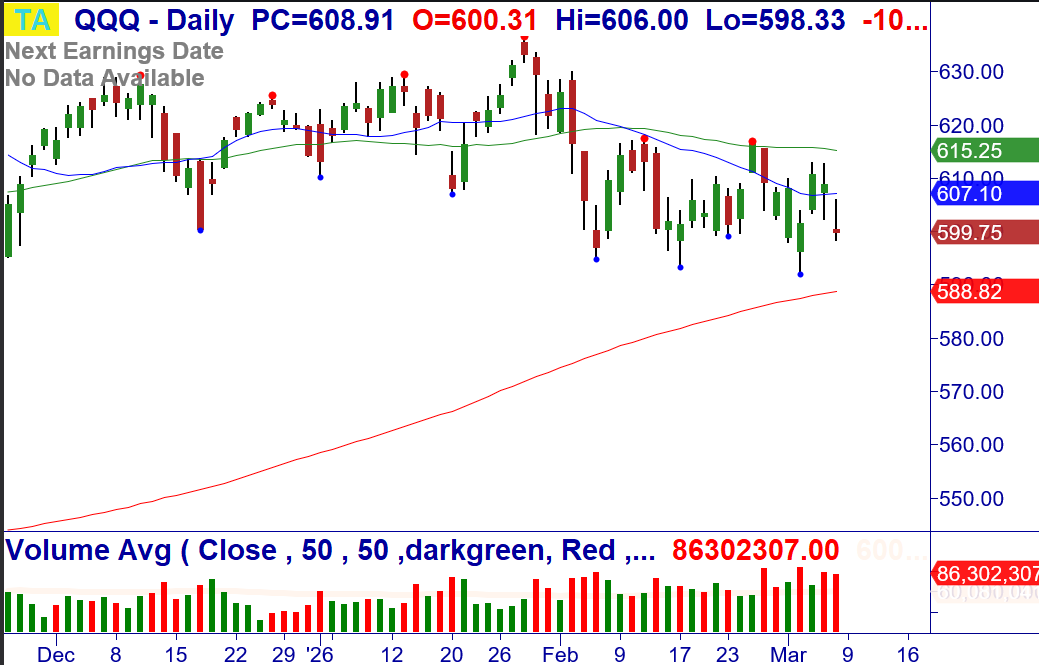
3/9: QQQ (and SMH) – Breakdowns, long put watch.
The Master Trader approach to selling credit spreads around technical turning points.
Read about the Weekly Options Trader letter, which sells options/spreads for weekly Income that primarily expire in 10 days or less, around Master Trader technical turning points, CLICK HERE
By selling spreads on stocks and ETFs where MTS indicates the price is unlikely to go, we become the “smart money,” getting paid to take calculated, well-defined risk.
Check out the blog article with more information and monthly results, CLICK HERE
Professional consistency, short-duration trades, and risk-controlled income — that’s what defines the Master Trader approach.
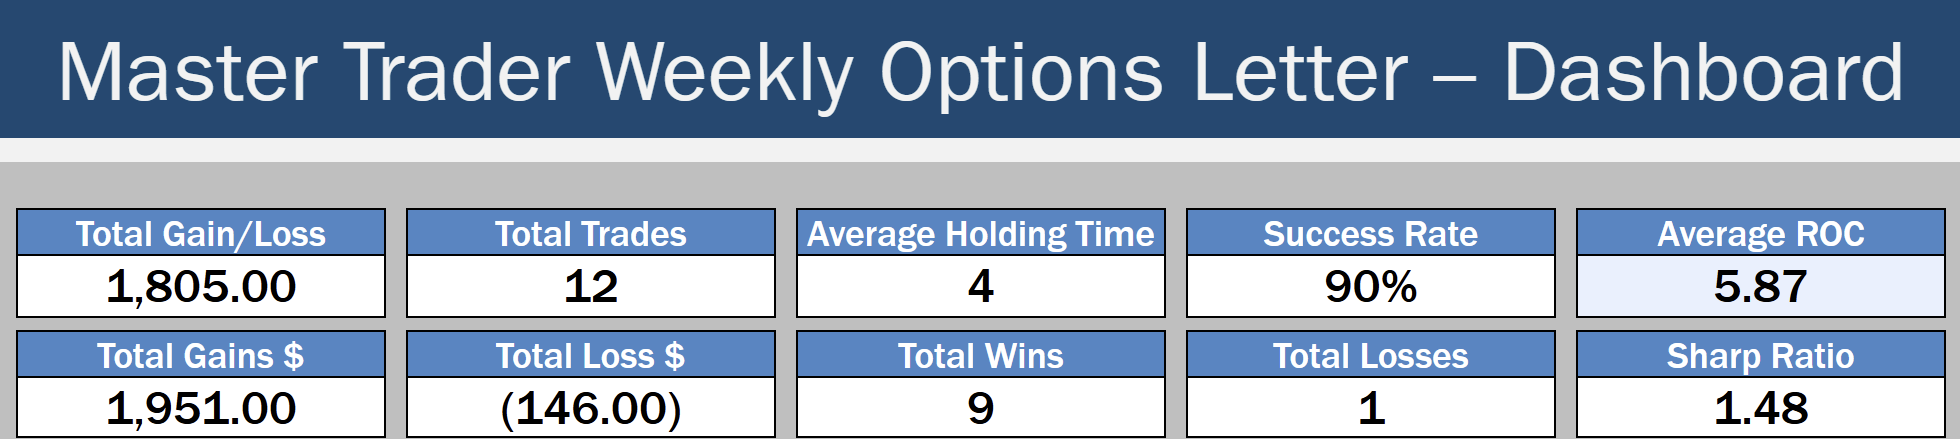
Here are last week's results:
Because your success is vital to you – and us.
Before selling options or credit spreads, we urge you to review the valuable and detailed information that we have provided for you in your Member’s Area Resources.
A quick simplified approach to calculating contract size is to simply base your contract size based on the number of shares permitted in your Trading Plan as if you were trading the stock or ETF. Simple Share Sizing = $ Risk / Stop Loss
The amount of money that you are willing to risk – divided by – the stop loss amount. For example, $100 / .20 = 500 shares. Credit Spread example, if your Trading Plan allowed you to trade 543 shares of AAPL based on the stop loss, then simply round down to the nearest hundred and short an equivalent number of contracts of the option. Since 1 contract represents 100 shares of the underlying, this would be five (5) contracts.
Master Trader and You Building Your Financial Future Together!
Good trading!
If you have any questions or comments, please e-mail Greg Capra at Greg@mastertrader.com or Dan Gibby at Dan@mastertrader.com
All the best,
Greg Capra Managing Director of Master Trader
Dan Gibby Chief Options Strategist
NOTE: Master Trader will show the opening and closing prices of all stock and options trades. We recommend that all traders and investors use proper share sizing for positions and money management. However, we cannot recommend what that is for your particular trading style, risk tolerance, or account balance. We urge you to calculate your own share/position size based on your individualized risk parameters, Trading Plan, and familiarity with the proposed trade strategy and risk. Advanced Management Strategies (AMS) covers in detail foundation and advanced position and money management.
NOTE: Master Trader and its representatives may have existing positions in actual or other trade recommendations before or after suggested herein. Additionally, we may manage them differently for internal purposes based on different risk parameters than noted herein. All trade ideas and content are for informational and educational purposes only. It is not, nor is it intended to be, trading or investment advice or a recommendation that any security, option, or investment strategy is suitable for any person. Trading securities can involve high risk and the loss of any funds. Significant gaps or volatility can increase these losses, particularly for short option strategies. Investment or trading information provided may not be appropriate for all investors, and is provided without respect to individual financial sophistication, financial situation, investing time horizon or risk tolerance. Supporting documentation for any claims (including claims made on behalf of options programs), comparison, statistics, or other technical data, if applicable, will be supplied upon request. Master Trader Consulting, Inc. is not a licensed financial advisor, registered investment advisor, or a registered broker-dealer. Options, futures, and futures options are not suitable for all investors.

