

Some of last week’s comments included,
This week is an options expiration week. These weeks are often choppy as market makers adjust and rebalance hedges, which can mute momentum and reverse sharp moves. After expiration, those hedges are unwound, and the market tends to move with more clarity. That timing suggests patience early in the week may be rewarded.
Running in Place… But Under the Surface, It’s a Different Story
Last week was uneventful—at least on the surface.
Most of the major indices moved less than 1%. The tape looked quiet. But the day-to-day action told a different story. Attempts to move lower were just as frequent as attempts to move higher. That kind of back-and-forth keeps traders second-guessing and investors hesitant.
We’ve been in this environment since late last year—an environment where uncertainty doesn’t explode into panic, but it also doesn’t allow trends to breathe.
Let’s put it into perspective.
Year-to-date:
- S&P 500: up just under 1%
- Nasdaq 100: down just under 1%
That’s essentially running in place.
But beneath that flat index, performance is a meaningful divergence:
- Transportation Index: up ~14%
- Russell 2000: up ~7.5%
- Dow Industrials: up ~3.5%
That’s rotation.
Growth Has Quietly Been in a Bear Market
A deeper dive shows something more important.
While some indices have held together, entire growth pockets have been under serious pressure:
- iShares Expanded Tech-Software Sector ETF (IGV)
- First Trust Dow Jones Internet Index Fund (FDN)
- Staffing & outsourcing stocks
- Bitcoin-related equities
Many of these names are down 50% or more from their late-2025 peaks.
The AI-driven reshuffling is not done. Leadership fractured. Capital left crowded trades and forced repricing in software and internet names.
However—and this matters—the worst-hit stocks are no longer collapsing at the same pace. That loss of downside momentum is often the first step toward stabilization.
Will it form a base?
Or is this just a pause before another leg lower?
We’ll know soon enough.
One high-odds bottoming pattern to watch in extended downtrends is the downside shakeout:
- Consolidation
- Violent flush lower (wide-range bar or cascade of red candles)
- Immediate reversal back into the range
That pattern removes weak hands and clears supply. If we see it, that becomes actionable.
Nvidia: The Center of Gravity This Week
All eyes now turn to NVIDIA Corporation (NVDA), reporting Wednesday after the close.
NVDA has been hovering near the top of its trading range—an area where it has previously failed. But the price action suggests institutions are leaning bullish ahead of earnings.
If it breaks out, there’s a tradable void above.
A decisive move higher could:
- Lift the Nasdaq 100
- Reignite semiconductor leadership
- Potentially mark a turning point in beaten-down tech
If it fails?
Expect pressure to return quickly.
Given NVDA’s weight and psychological influence, this is not “just another earnings report.”
Other Key Earnings This Week
The calendar is full of market-moving names:
Monday
- Dominion Energy (D)
- Domino's Pizza (DPZ)
- ONEOK (OKE)
- Diamondback Energy (FANG)
- Keysight Technologies (KEYS)
Tuesday
- Home Depot (HD)
- Constellation Energy (CEG)
- MercadoLibre (MELI)
- HP Inc. (HPQ)
- Workday (WDAY)
Wednesday
- NVIDIA Corporation (NVDA)
- Snowflake Inc. (SNOW)
- Zoom Video Communications (ZM)
Thursday
- Salesforce (CRM)
- Intuit (INTU)
Software has already been weak. These reports could either stabilize that group or accelerate deterioration.
The Trump Effect (Again)
Last week’s major headline: the Supreme Court ruling against the Trump administration’s global tariffs.
Markets did pop on the headline, but context matters.
The broader indices opened lower and reversed higher before the news broke. That tells us positioning already anticipated the ruling.
You could see it in the tape:
- SPDR S&P Retail ETF (XRT) spiked, then faded.
- ProShares UltraShort 20+ Year Treasury (TBT) jumped, then retraced.
In other words, movement, but not conviction.
Geopolitically, tensions in the Middle East remain elevated amid the U.S.–Iran standoff. Meanwhile, crude oil and gasoline prices are more than 20% off their recent lows.
Oil services ETFs:
- VanEck Oil Services ETF (OIH)
- SPDR S&P Oil & Gas Equipment & Services ETF (XES)
Both are up over 30% this year—and show no signs of exhaustion.
That’s real relative strength.
Economic Crosscurrents
Last week’s data was mixed:
GDP came in weaker than expected.
PCE inflation held near 3%.
FOMC minutes revealed division: some members leaning toward hikes, others toward cuts.
The bond market still leans toward cuts.
The Fed says “not so fast.”
Somebody will blink.
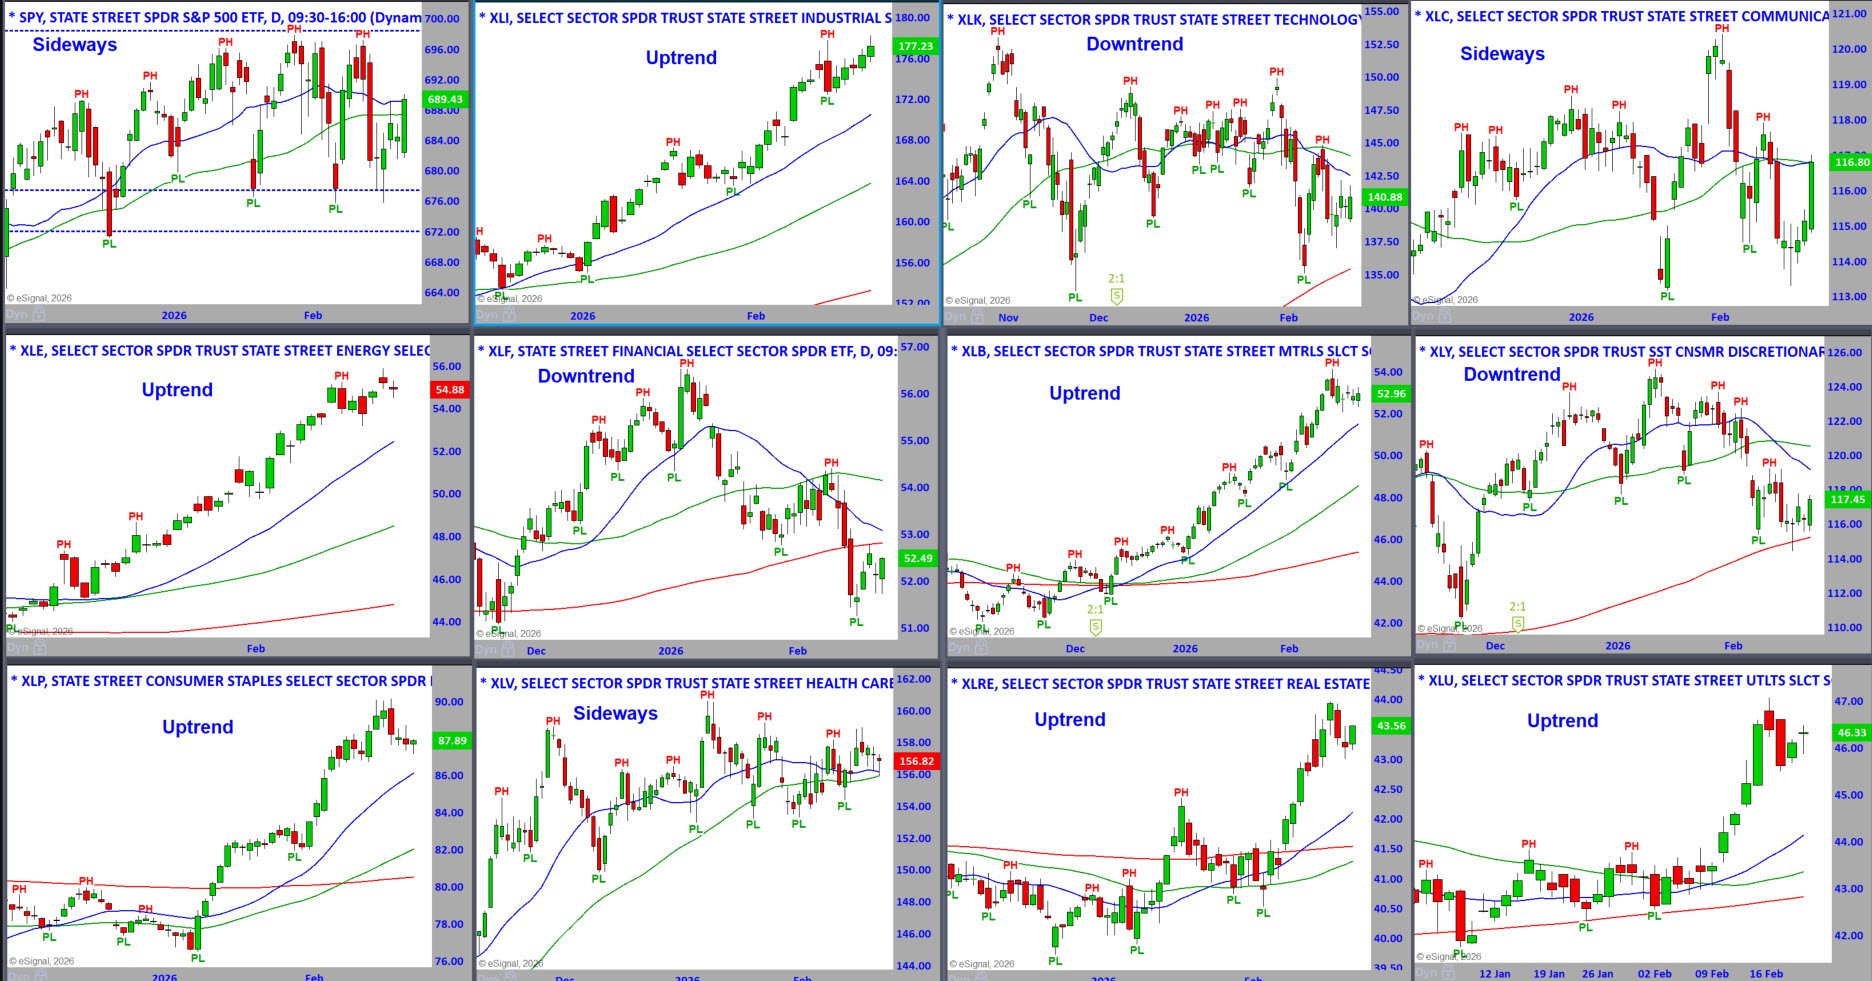
S&P Sector ETFs – Daily Charts - To See a Larger Image,
Right-Click and Press Open in a New Tab
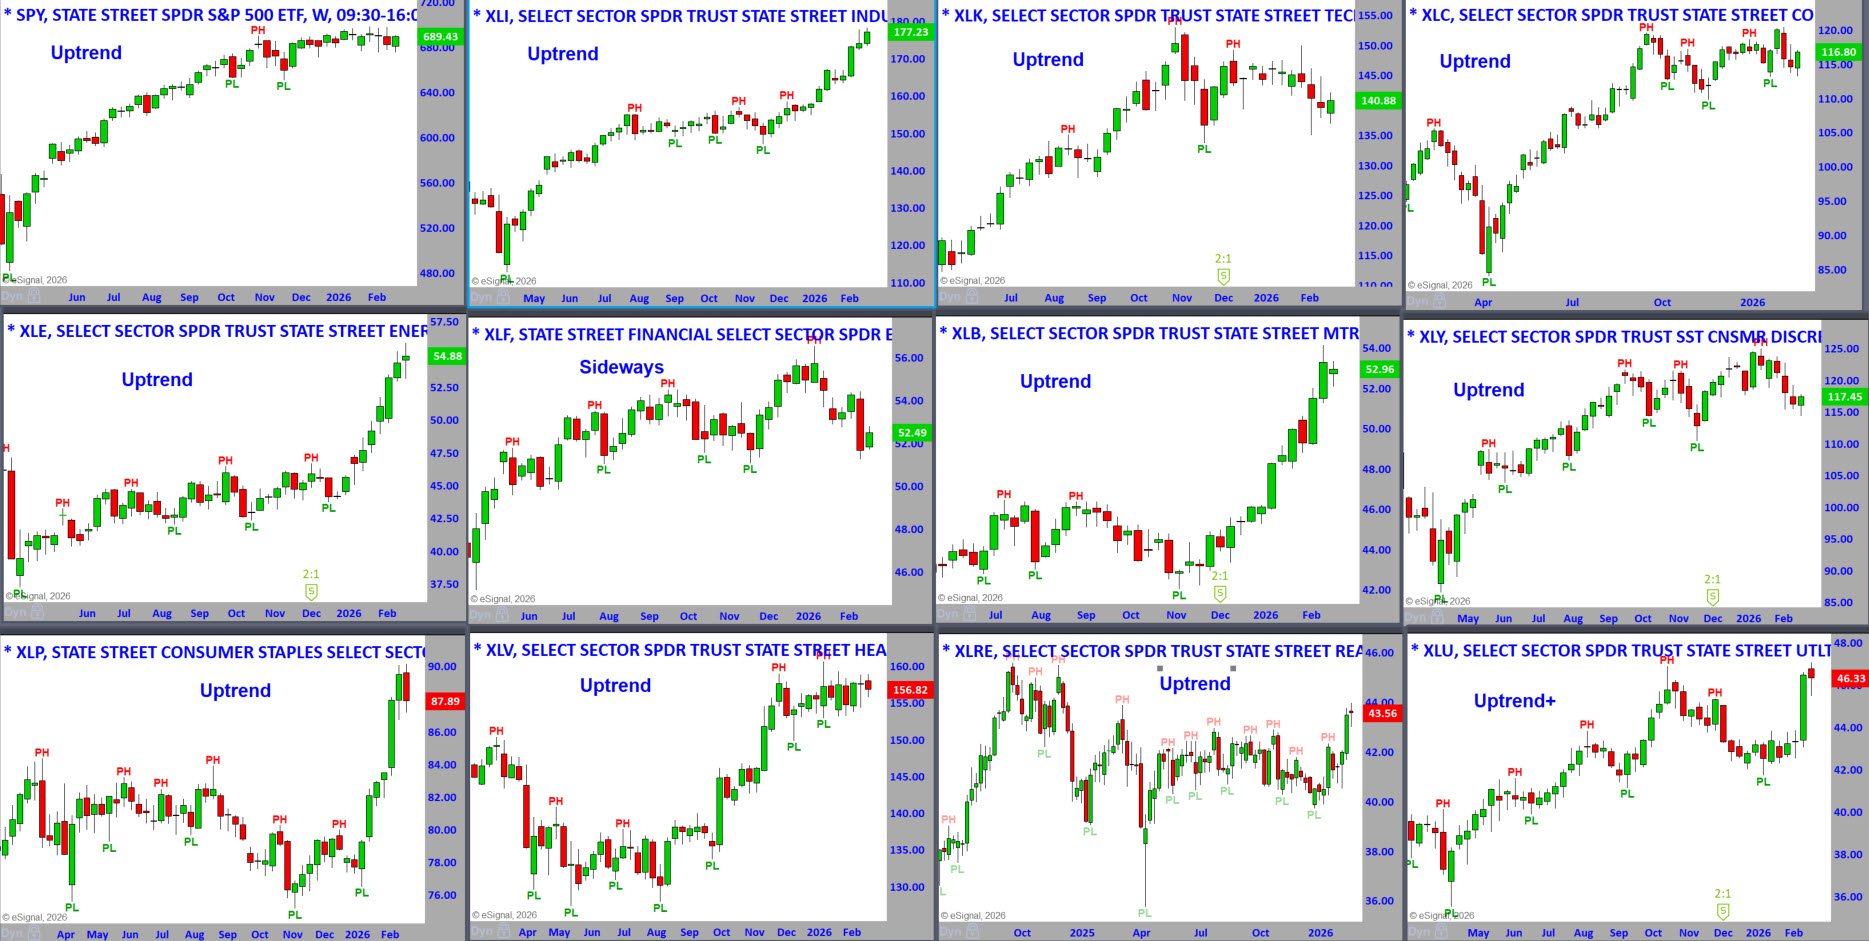
S&P Sector ETFs – Weekly Charts - To See a Larger Image,
Right-Click and Press Open in a New Tab
S&P Sector ETFs – Sorted by Weekly Percent Change This Week
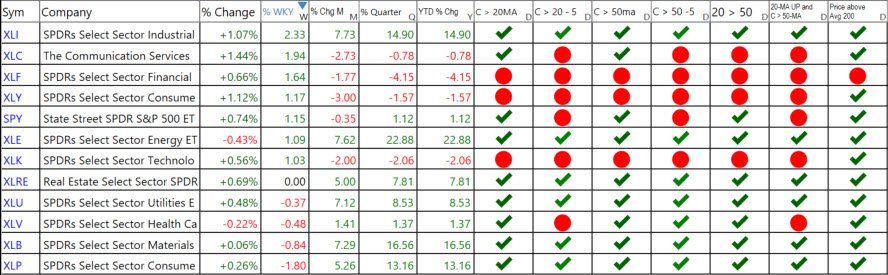
Last week’s percentage changes.
The percentage changes tell you which sectors were the strongest or weakest on Friday and for the week, month, quarter, and year.
There are seven columns after the percent changes in the sector listed above.
You can see the ETFs that are the strongest getting stronger or weakening.
- Close above or below the 20-MA.
- Close above or below the 20-MA 5 Days Ago. C>20 -5
- Close above or below the 50-MA.
- Close above or below the 50-MA 5 Days Ago. C>50 -5
- 20-MA above or below the 50-MA.
- 20-MA is pointed up, and the close is above the 50-MA
Where are the Markets Headed this Week?
If you step back and remove the noise, the answer is simple:
We’re still in a range.
The S&P 500 has been trading between approximately 6800 on the bottom and 7000 on the top, with 6900 acting as the midpoint magnet for months. Last week, prices moved from the lower end of that range back toward the middle.
Now the obvious question:
Can it push back toward the top?
The Bullish Case
Friday gave us something meaningful.
The S&P 500 opened lower and reversed higher into the close, forming a bullish wide-range bar.
That’s not random.
When a gap down produces a bullish wide-range bar, it tells us institutions were willing buyers below the open. That type of candle doesn’t form by accident.
Master Trader Tip:
When a gap down results in a bullish wide-range bar, the bar's bottom becomes short-term significant support. In an uptrend, that low is a logical place to raise stops.
That one candle increases the probability that the top of the range is believable.
Not guaranteed.
Believable.
The Reality: Still a Range
Technically, the broader charts do not suggest a major directional move is imminent.
Breadth continues to oscillate around zero.
Sentiment has leaned more bullish, which can provide a floor.
Internals are neutral.
That combination does not scream “breakout.” It suggests continued erratic movement.
The market has been rotating more than trending.
Under the surface, we continue to see divergence:
- Small caps and Transports have shown relative strength.
- Software and Internet groups remain in structural downtrends.
- Defensive sectors like Staples and Healthcare have attracted capital.
- Energy continues to benefit from rising crude.
Nvidia Is the Pivot Point
The market’s center of gravity this week is clear:
NVIDIA Corporation (NVDA).
NVDA is sitting near the top of its range heading into earnings.
If it breaks out:
- The Nasdaq 100 likely follows.
- Semiconductors regain leadership.
- The S&P 500 has a strong probability of testing 7000.
If it fails:
- Software weakness may accelerate.
- The recent rotation into laggards may stall.
- The S&P could rotate back toward 6800.
This is not just an earnings report. It’s a potential catalyst.
Options Expiration Is Behind Us
Last week was expiration week, which often suppresses momentum as dealers hedge large open-interest strikes.
That restraint is now gone.
In the last five options expirations, the S&P 500 was higher the following week. That’s not a guarantee—but it’s a tendency worth respecting.
With hedges unwound, markets are “freed” to move.
Whether that move is up or down will likely depend on:
- Nvidia’s earnings
- Core PPI later in the week
- Ongoing rate-cut expectations
The Broader Backdrop
We’re seeing:
- GDP slowing
- Inflation sticky but not accelerating
- Fed members are divided
- Geopolitical tension influencing energy prices
Despite that, indices are holding.
That tells us institutions are not aggressively distributing stock. But they are not aggressively expanding risk either.
DOW JONES
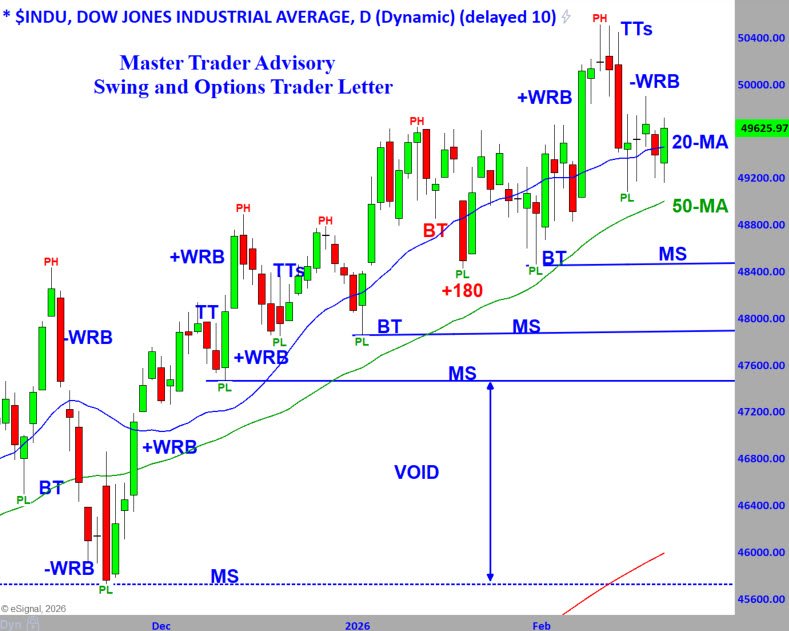
The chart above shows the Dow Jones Industrial Average through the lens of Master Trader Technical Strategies (MTS).
Last week, the Dow barely moved — finishing up roughly +0.25% — and traded entirely inside the prior week’s range. That is classic contraction. When a market compresses like this after an advance, it is not random… it is storing energy.
The trend is still up.
- The 20-day moving average is rising.
- The 20-MA remains above the 50-MA.
- Pullbacks continue to find buyers.
That alignment maintains the intermediate trend.
However, let’s not ignore the bigger picture.
The Dow is roughly where it was two months ago.
Despite strong rallies, wide-range bars, and attempts to break higher, price has not meaningfully expanded. That tells us demand and supply are closer to equilibrium than headlines might suggest.
What the Chart Is Really Saying
Over the last several weeks, we’ve seen:
Wide-range bars (+WRBs)
Topping tails near pivot highs
Minor shakeouts that held support
Erratic day-to-day movement
That combination communicates uncertainty — not distribution, but not expansion either.
It’s a market that wants to move but hasn’t decided which side wins.
For the Dow to reassert leadership:
- It must clear recent pivot highs convincingly.
- It must close above them — not just gap above and fade.
- It must expand range and follow through.
If that occurs, new all-time highs are quickly within reach.
The narrowing distance between the 20- and 50-MAs also suggests a contraction phase nearing resolution. Compression resolves with expansion. The only question is direction.
The Dow is not breaking down.
It is not breaking out.
It is coiling.
As long as it remains above the rising 50-MA, the trend bias remains up. A break below shifts the conversation quickly.
For now, this remains a “wait for confirmation” chart — and in this environment, confirmation is everything.
VIDEO REVIEW OF MARKETS, SECTORS, AND INTERNALS - Click lower right to open Full Screen.
NEW STOCK TRADING IDEAS Below
NOTE: Please see the document in RESOURCES entitled Master Trader Guidelines for Trading the Open and Gaps.
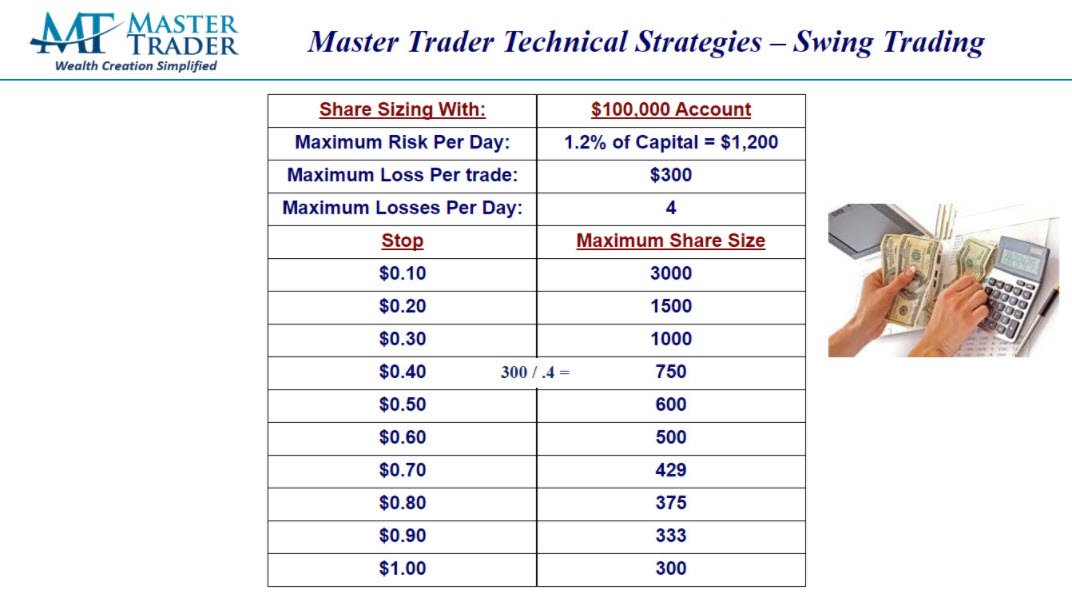
Note on Position Size Calculation in the Open Trades Sheet:
All trades are based on a hypothetical Max Loss of $300/trade. For Stocks, that is $300 / (Entry - Stop). Directional option trades use the same formula, then divided by 100, rounded down to the nearest whole number, with a minimum of one (1).
The “Master Trader Blended Method” for shorting options/spreads size starts with the stock position size, multiplying by 1.5, then divide by 100 because 1 contract represents 100 shares.
Please calculate position size according to your Max Loss per your Trading Plan.
Here's an example:
AMS Teaches You How to Maximize Profits on Every Trade. Click Here to Read More
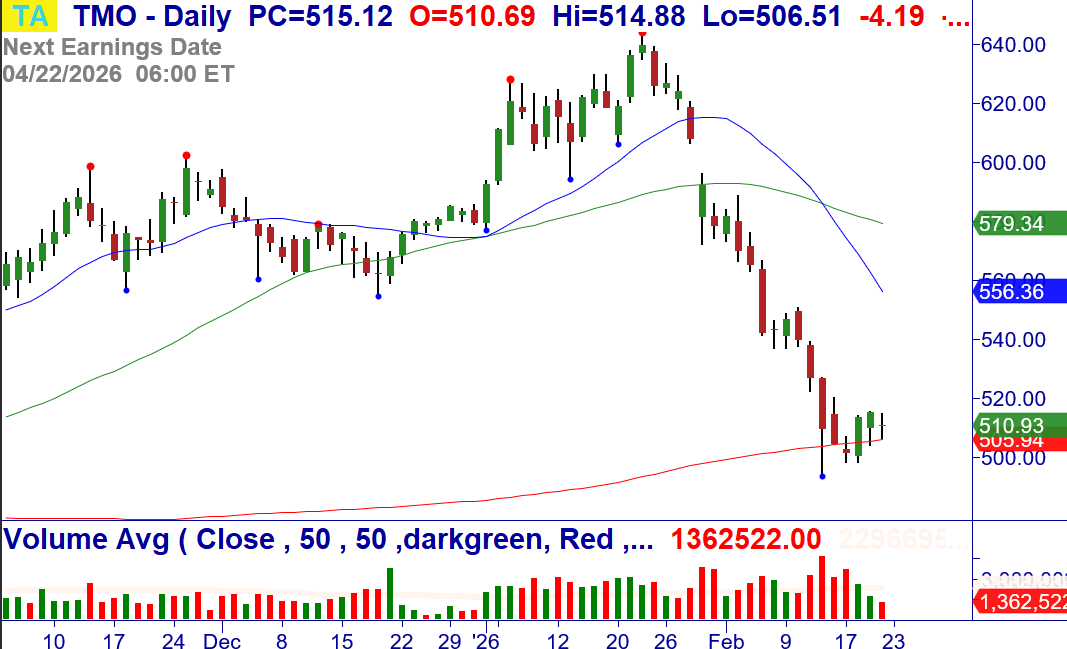
2/23: TMO – Over $515.51, consider buying the stock. Climactic Buy Setup and bullish 4-bar reversal at the 200-MA. Stop $498.38.
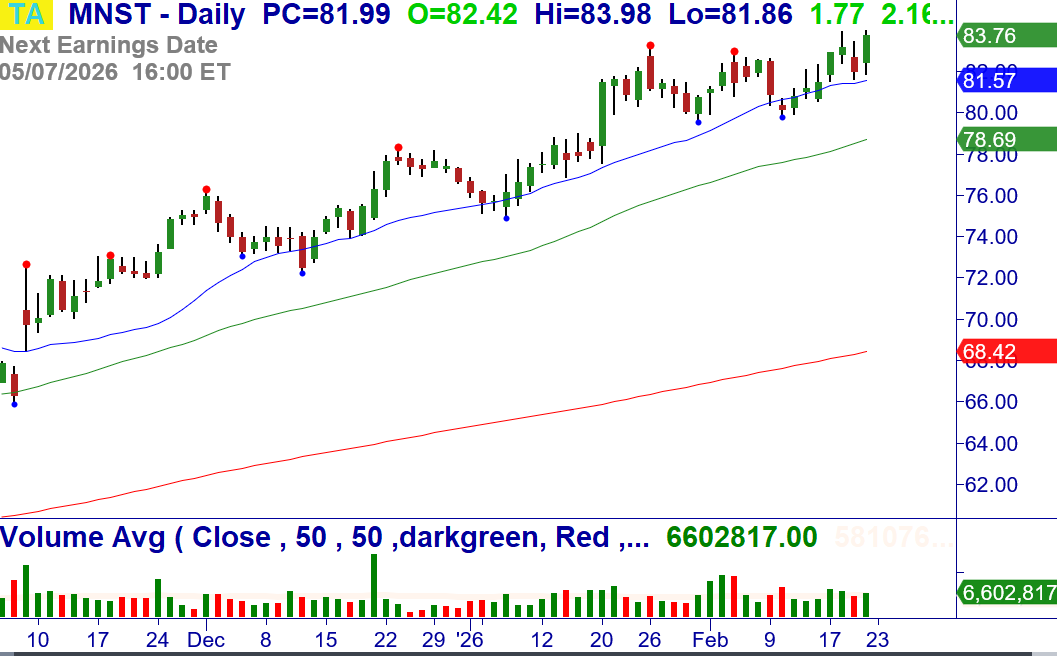
2/23: MNST – Over $84.00, consider buying the stock. Breakout at the 20-MA. Stop $81.48.
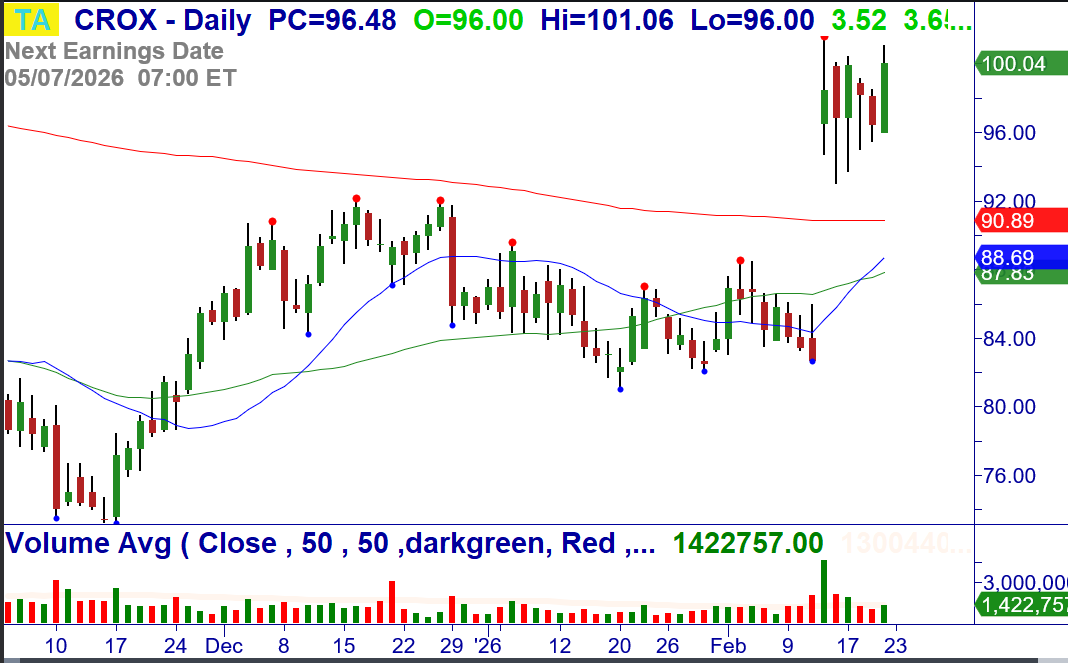
2/23: CROX – Over $101.06, consider buying the stock. Bull Rectangle Breakout after +Gap, +123 weekly. Stop $92.88.
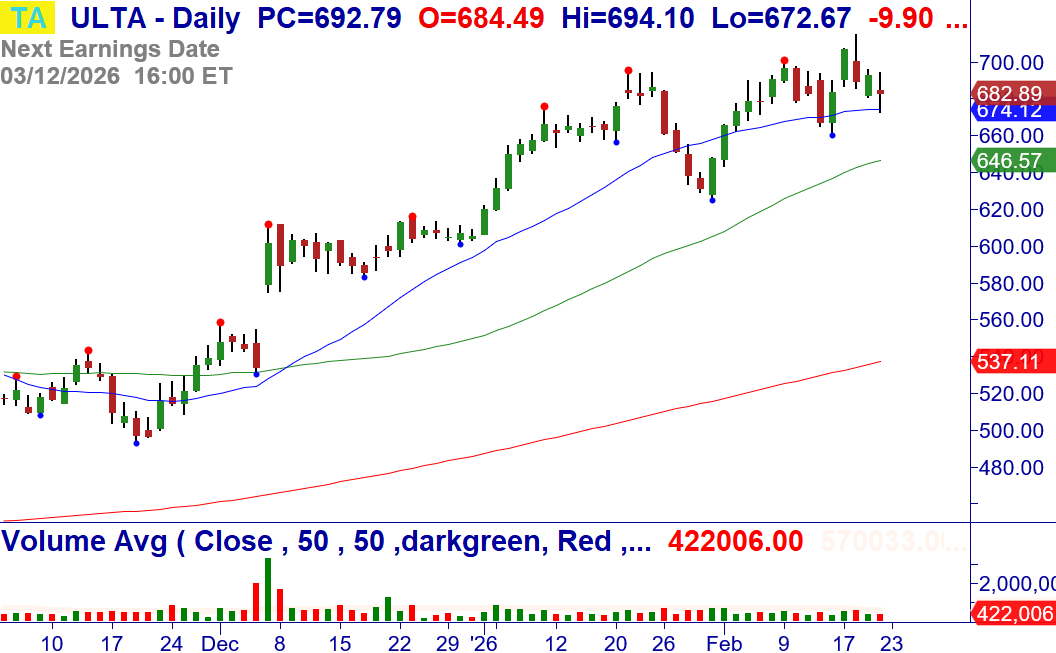
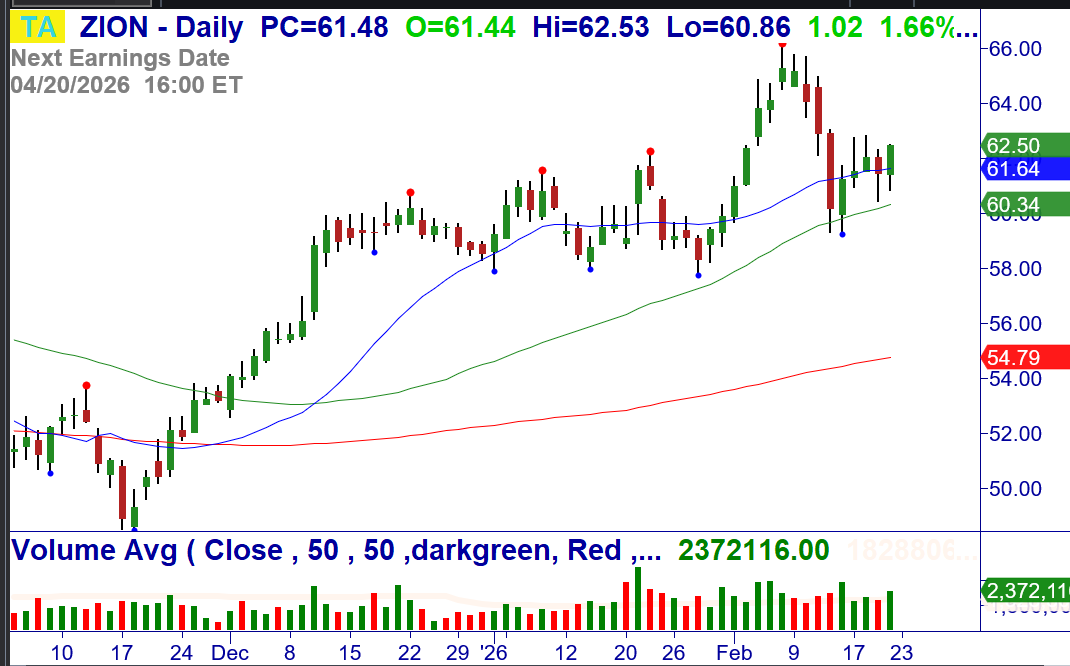
2/23: ZION – Over $62.53, consider buying the stock. Bullish retest of Buy Setup and reversal. Stop $60.18.
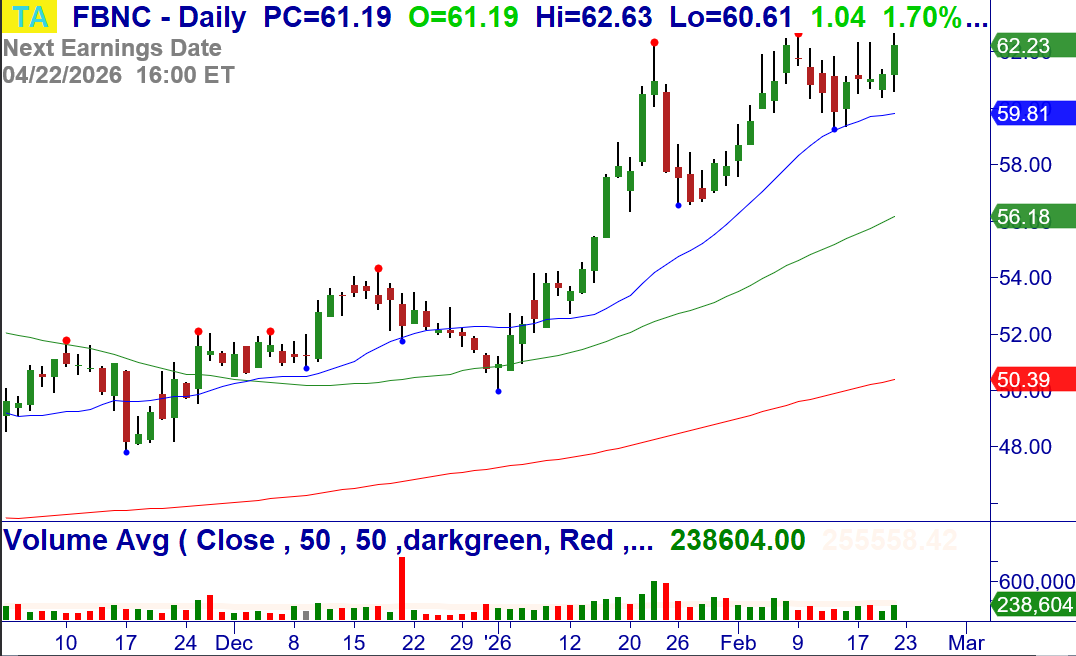
2/23: FBNC – Over $62.64, consider buying the stock. Breakout, +123 weekly, bullish sector. Stop $59.78.
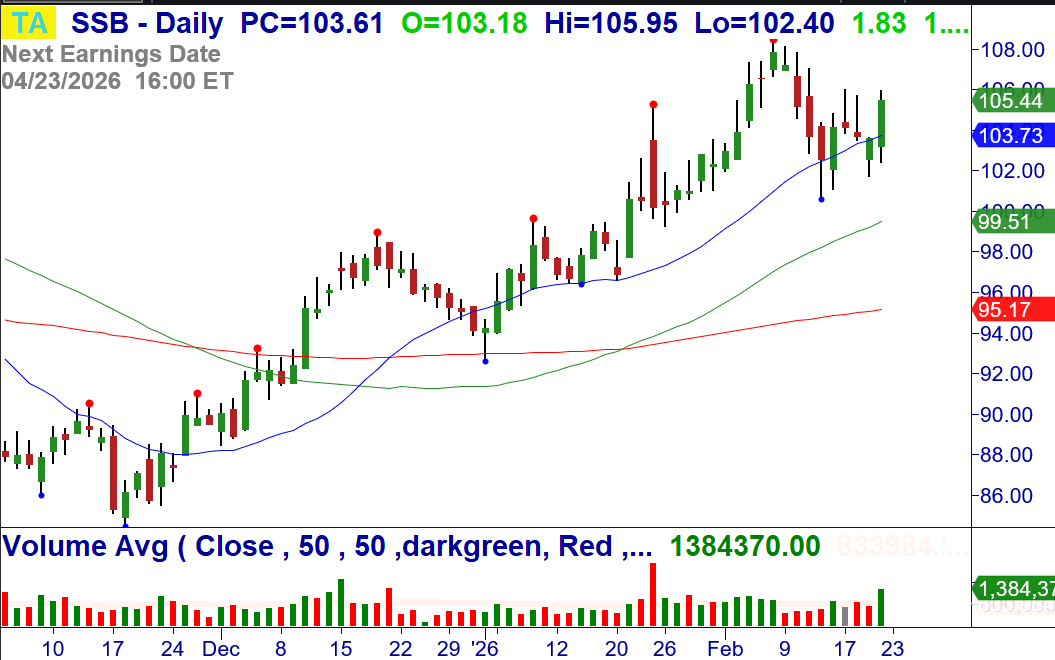
2/23: SSB – Over $105.95, consider buying the stock. Bullish retest of Buy Setup and reversal at the 20-MA, bullish sector. Stop $101.71.
Money Management for Trading and Investing
Proper money management for investing and Trading starts with position-sizing based on the amount of money you are willing to risk on a signal trade.
CLICK HERE to review these Master Trader Guidelines and Basic Money Management and Position Sizing Table.
NEW OPTIONS TRADING IDEAS
Directional Options Strategies and Debit Spreads for Swing Trading (See the Weekly Options Trader letter, which sells options/spreads for weekly Income that primarily expire in 10 days or less, CLICK HERE)
Dan will be presenting this Thursday, February 26th, at 2:15 ET, at Traders Corner’s Stock & Options Investor’s Summit, where he will teach you how to trade stocks and options on a Simple, Powerful “Igniting Pattern.” Register- CLICK HERE
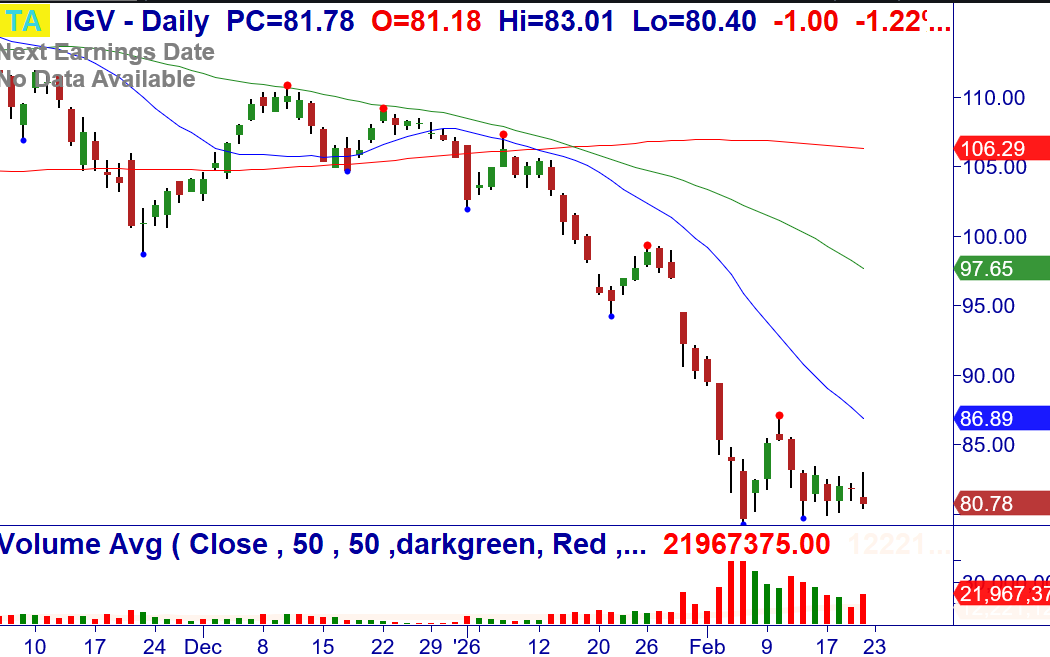
2/23: IGV – W-Bottom reversal following Climactic Buy Setup on +Vol., long watch or short put spread if trades over $83.40.
The Master Trader approach to selling credit spreads around technical turning points.
Read about the Weekly Options Trader letter, which sells options/spreads for weekly Income that primarily expire in 10 days or less, around Master Trader technical turning points, CLICK HERE
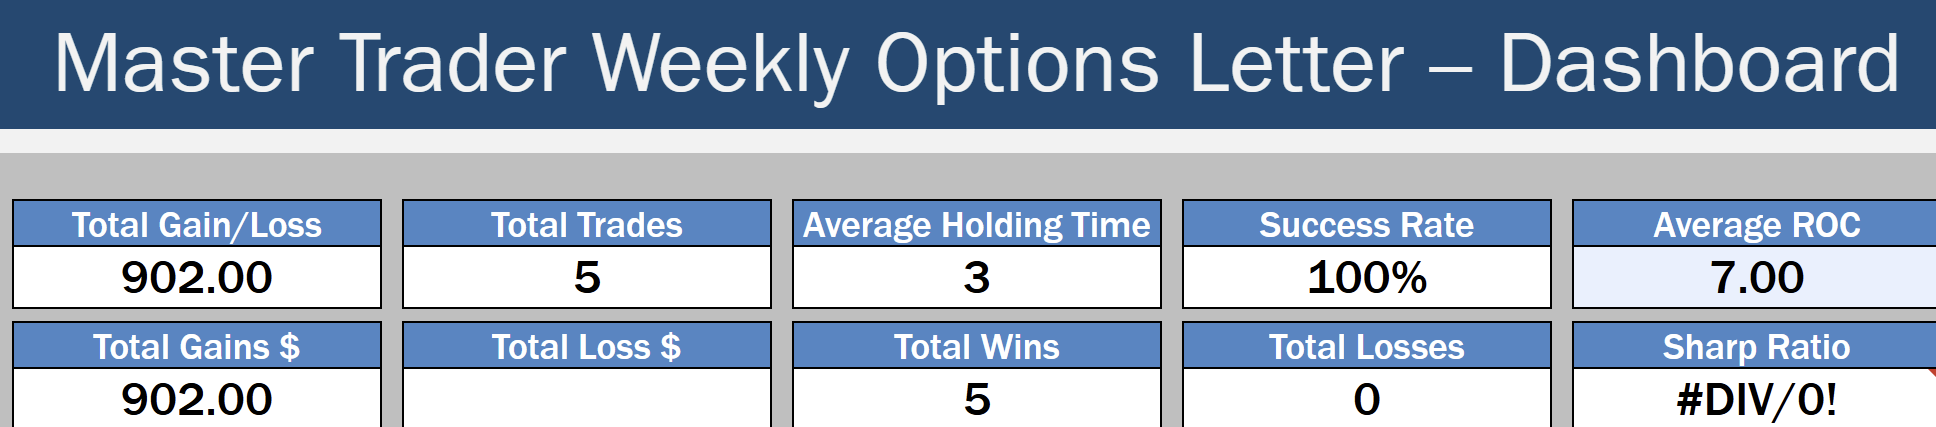
By selling spreads on stocks and ETFs where MTS indicates price is unlikely to go, we become the “smart money,” getting paid to take calculated, well-defined risk.
Check out the blog article with more information and monthly results, CLICK HERE
Professional consistency, short-duration trades, and risk-controlled income — that’s what defines the Master Trader approach.
Because your success is vital to you – and us.
Before selling options or credit spreads, we urge you to review the valuable and detailed information that we have provided for you in your Member’s Area Resources.
A quick simplified approach to calculating contract size is to simply base your contract size based on the number of shares permitted in your Trading Plan as if you were trading the stock or ETF. Simple Share Sizing = $ Risk / Stop Loss
The amount of money that you are willing to risk – divided by – the stop loss amount. For example, $100 / .20 = 500 shares. Credit Spread example, if your Trading Plan allowed you to trade 543 shares of AAPL based on the stop loss, then simply round down to the nearest hundred and short an equivalent number of contracts of the option. Since 1 contract represents 100 shares of the underlying, this would be five (5) contracts.
Master Trader and You Building Your Financial Future Together!
Good trading!
If you have any questions or comments, please e-mail Greg Capra at Greg@mastertrader.com or Dan Gibby at Dan@mastertrader.com
All the best,
Greg Capra Managing Director of Master Trader
Dan Gibby Chief Options Strategist
NOTE: Master Trader will show the opening and closing prices of all stock and options trades. We recommend that all traders and investors use proper share sizing for positions and money management. However, we cannot recommend what that is for your particular trading style, risk tolerance, or account balance. We urge you to calculate your own share/position size based on your individualized risk parameters, Trading Plan, and familiarity with the proposed trade strategy and risk. Advanced Management Strategies (AMS) covers in detail foundation and advanced position and money management.
NOTE: Master Trader and its representatives may have existing positions in actual or other trade recommendations before or after suggested herein. Additionally, we may manage them differently for internal purposes based on different risk parameters than noted herein. All trade ideas and content are for informational and educational purposes only. It is not, nor is it intended to be, trading or investment advice or a recommendation that any security, option, or investment strategy is suitable for any person. Trading securities can involve high risk and the loss of any funds. Significant gaps or volatility can increase these losses, particularly for short option strategies. Investment or trading information provided may not be appropriate for all investors, and is provided without respect to individual financial sophistication, financial situation, investing time horizon or risk tolerance. Supporting documentation for any claims (including claims made on behalf of options programs), comparison, statistics, or other technical data, if applicable, will be supplied upon request. Master Trader Consulting, Inc. is not a licensed financial advisor, registered investment advisor, or a registered broker-dealer. Options, futures, and futures options are not suitable for all investors.

