

Some of last week’s comments included:
"The markets are about as close to firing on all cylinders as we’ve seen in quite some time. That alone is enough to trigger contrarian instincts—and rightly so—but importantly, our market internals are not aligned to support a bearish bias at this time.
It is options expiration week, and there is significant open interest in both calls and puts clustered around the 7,000 strike on the S&P 500"
Last week, we noted that it was options expiration week, with significant open interest clustered around the 7,000 strike on the S&P 500, both calls and puts. That level did exactly what heavy options interest often does—it acted as a lid.
Post-Expiration: The Spring Is Coiling
The 7,000 strike contained the upside. Prices briefly dipped below 6,900, but buyers stepped in immediately, pushing the S&P back toward the middle of its range, where it closed just slightly below its open.
What stands out now is the contraction.
The distance between swing highs and swing lows continues to narrow. Ranges are compressing. That “coiling spring” behavior often precedes a move of consequence, and it frequently occurs after options expiration—not during it.
S&P 500 ETF Daily Chart - Options Expirations Marked.
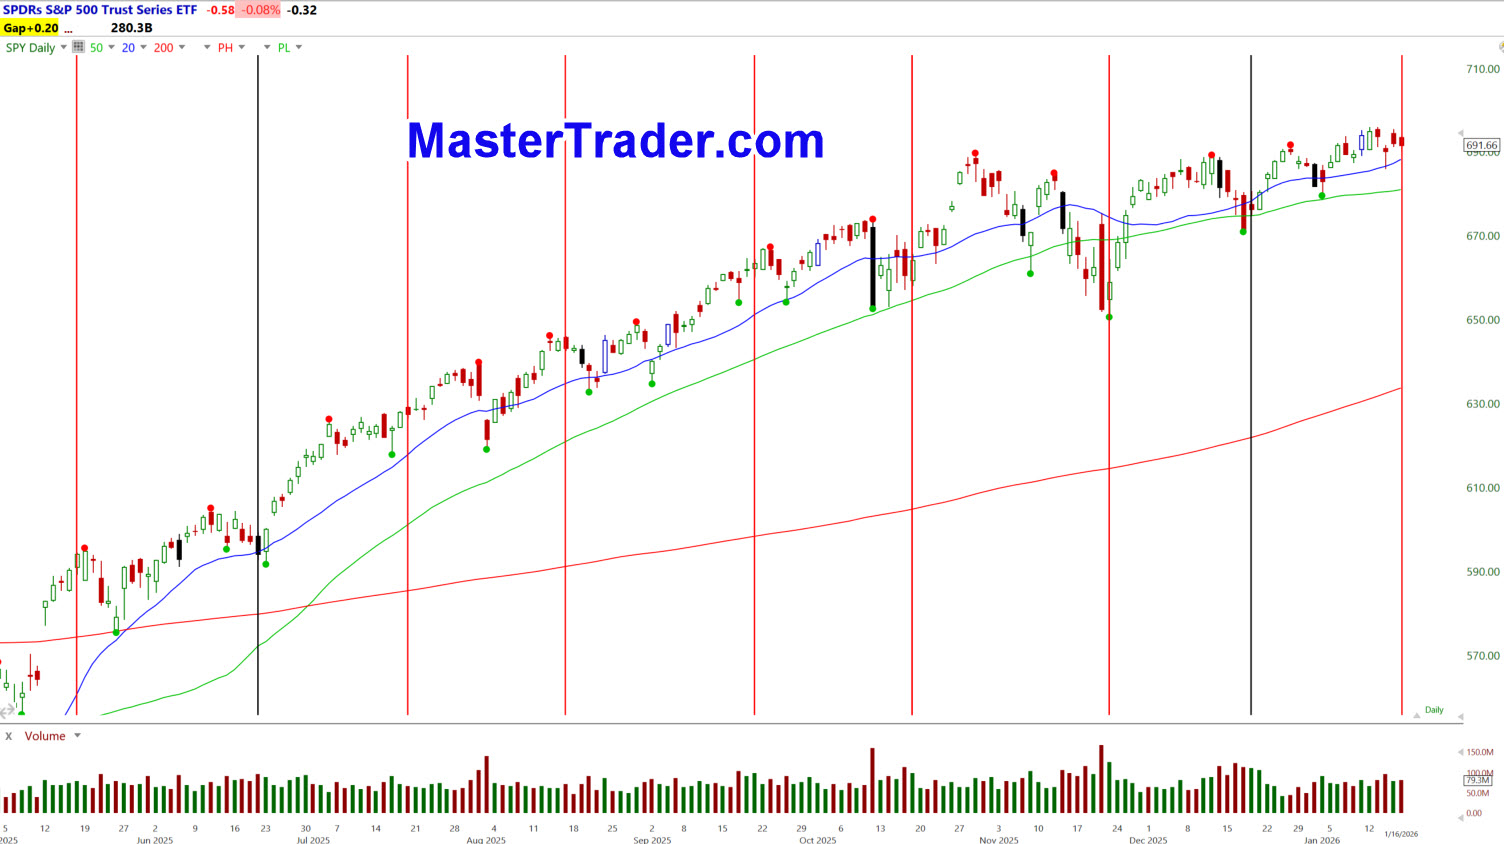
In the Green Room, I showed past examples of post-expiration behavior. These are not explosive moves, but tradable ones, particularly for short-term swing traders who understand price structure, context, and risk.
This is where money management separates professionals from guessers.
NASDAQ 100: Another Coil, Different Message
We’re seeing similar compression in the NASDAQ 100, tracked by the QQQ. The range has been narrowing for over six weeks, tightening even more recently.
Range-bound markets eventually break out to the upside or downside. What’s equally important is understanding that initial breaks often fail. False breaks are common and often provide the clearest information about who is actually in control.
Patience here matters.
Markets change. They always do. That’s part of what makes them endlessly fascinating—and humbling—no matter how long you’ve been doing this.
Leadership Under the Surface Is Changing
What’s unusual is seeing Apple, Microsoft, Meta, and Netflix decline while the NASDAQ 100 remains flat. Historically, that’s not normal.
Dig a little deeper, and the picture gets more interesting. Software stocks like TEAM, INTU, APP, ADBE, and QCOM have been hit hard. That raises an obvious question: What’s holding the index together?
The answer is structural.
The NASDAQ 100 is capitalization-weighted. Nvidia, which has gone sideways, and Google, which has edged higher, have provided enough ballast to keep the index from rolling over.
There’s also a bigger theme at play. AI is boosting semiconductors, but at the same time, it’s changing the economics of software—what’s needed, what’s obsolete, and what it costs companies to keep up.
This is rotation, not collapse.
Financials: Earnings Reactions Raise Eyebrows
Earnings season added another layer of complexity last week, especially in financials.
Some of the weaknesses can be traced to President Trump’s comments about capping credit card interest rates at 10%. That explains the pressure in American Express, Visa, and MasterCard, all of which have yet to report.
What was more surprising was the post-earnings selling in JPMorgan, Bank of America, and Wells Fargo, while Goldman Sachs and Morgan Stanley surged.
Same sector. Very different messages.
That contrast matters.
Are Some Cylinders Starting to Sputter?
Last week, we said the markets were firing on all cylinders. This week, it’s fair to ask whether a few of those cylinders are beginning to sputter.
The encouraging answer comes from two areas that have historically lagged but often play “catch-up”: Small Caps (Russell 2000) and Transports. Both have been leading recently and show no signs of breakdown.
Add to that the NYSE Composite, which made a new all-time high last week, and the broader picture remains constructive.
Rotation Is Vicious—and Revealing
One of last week’s premarket titles was “Rotation Is Vicious.” That remains true.
If you want proof, look at last week’s top performers within the NYSE Composite: beaten-down restaurant stocks that suddenly caught fire—KRUS, DRI, TXRH, CAVA, CAKE, SHAK, CRBL, YUM, and SBUX.
These names were left for dead not long ago. Now they’re extended in the short term and due for pullbacks—but the rotation itself is meaningful.
Undervalued alone isn’t enough. Cheap can always get cheaper. But when money rotates aggressively into areas like this, it often reflects a growing belief that economic conditions for the middle-class consumer may improve—and that spending will follow.
What’s Ahead This Week
Earnings continue, shifting focus from banks to Netflix, Intel, Johnson & Johnson, GE, and United Airlines. The heavyweight tech names—Apple, Microsoft, Meta, Tesla—come later in the month.
On the macro side, PCE inflation (Thursday) is the key report, along with GDP growth and jobless claims. Markets are currently pricing roughly 50 basis points of rate cuts in 2026, so surprises here matter.
The World Economic Forum runs all week, and yes—AI will dominate the conversation.
There’s also the lingering possibility of a Supreme Court ruling on tariffs, which has been delayed twice already. The administration sounds confident. Markets will decide whether that confidence is justified.
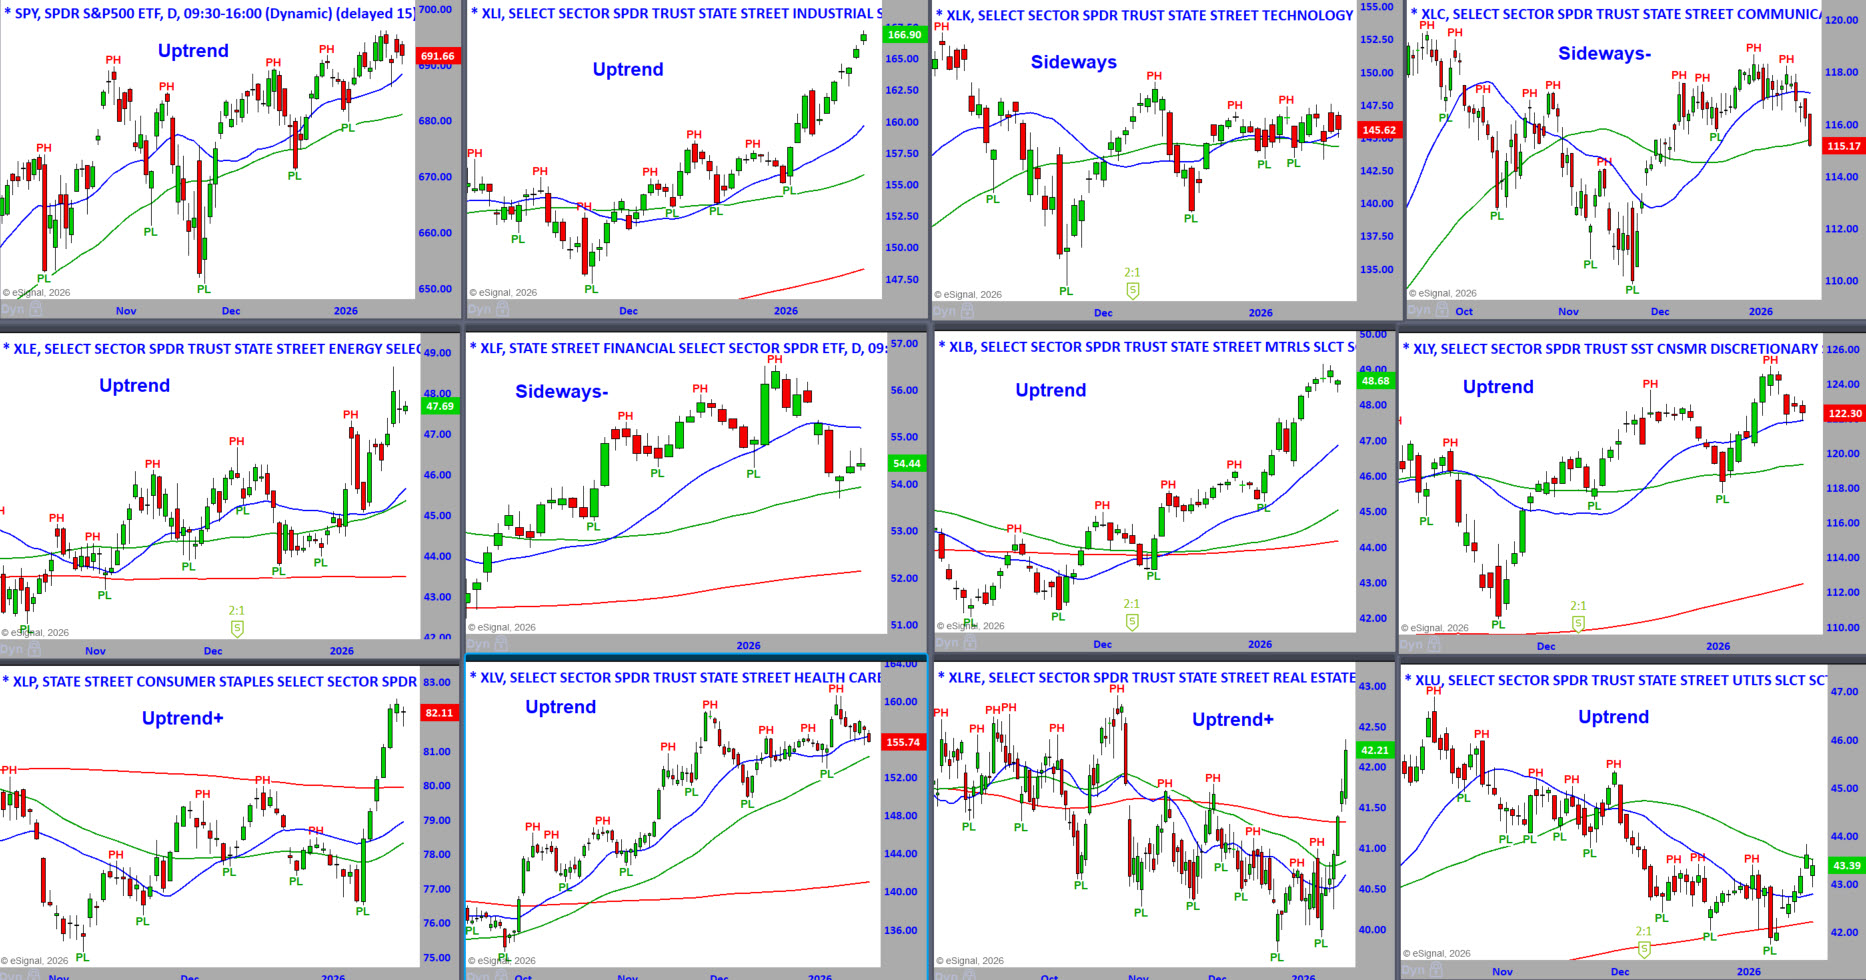
S&P Sector ETFs – Daily Charts - To See a Larger Image,
Right-Click and Press Open in a New Tab
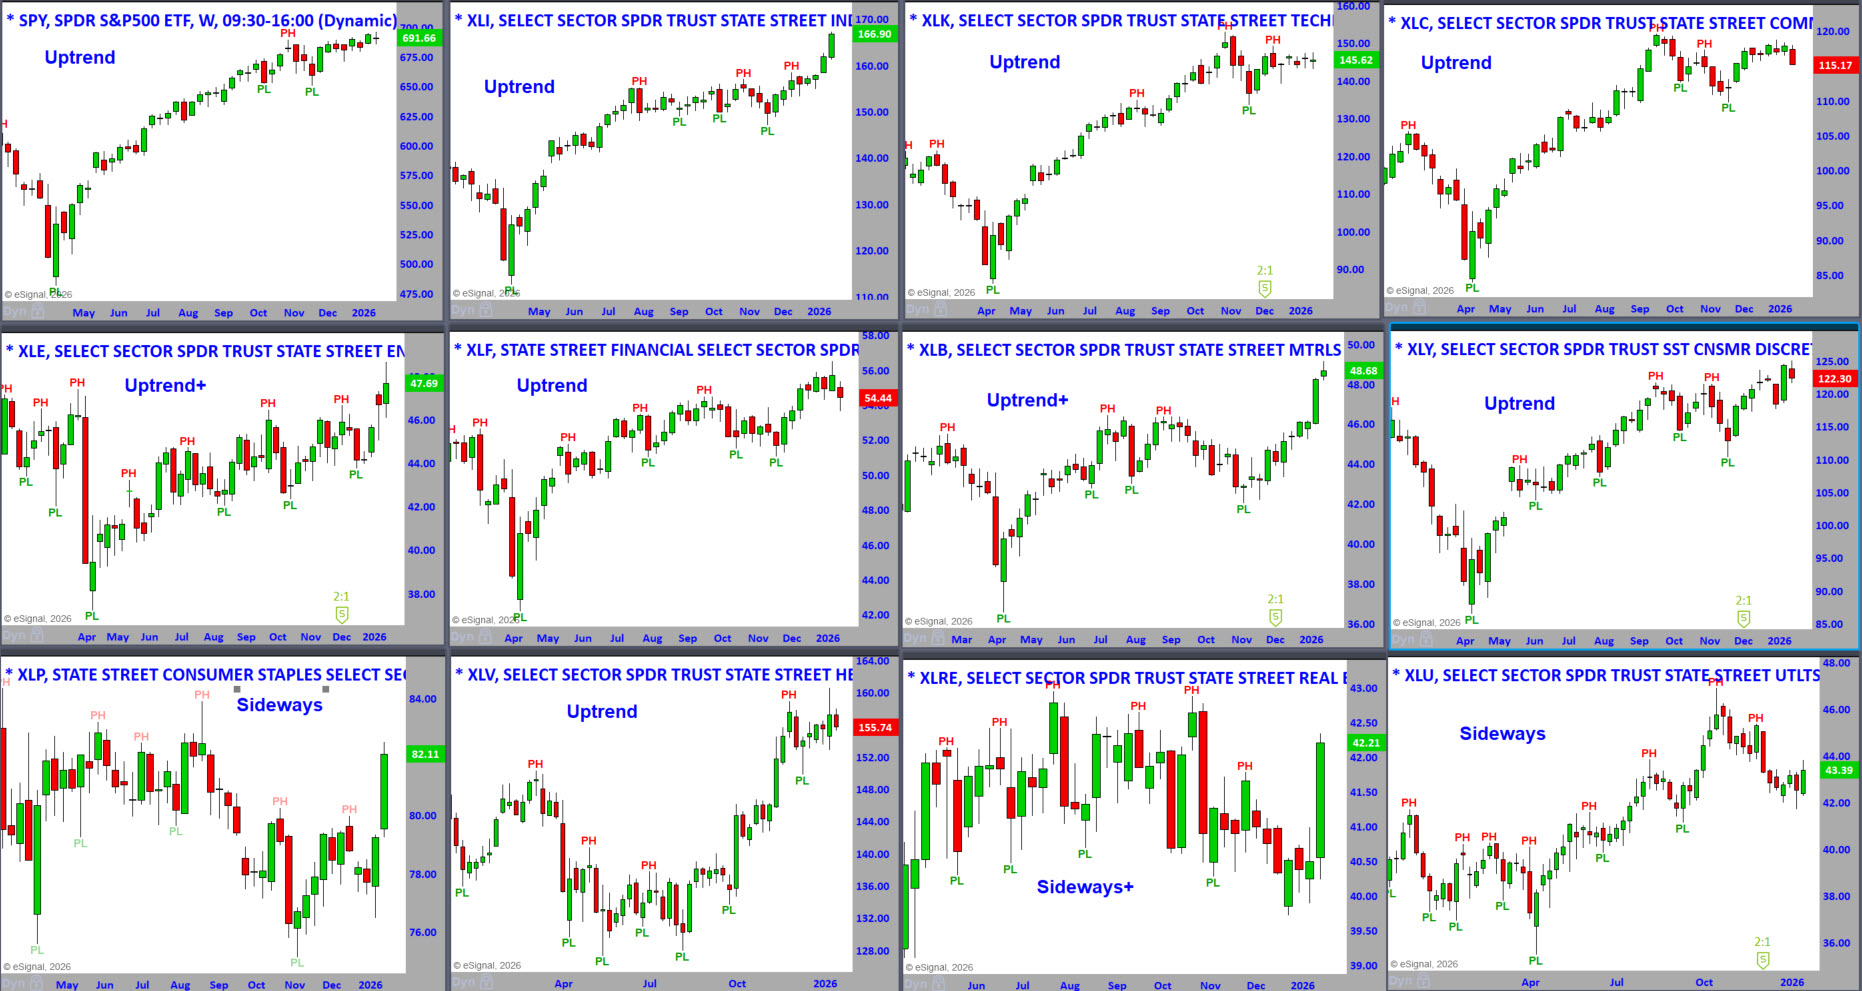
S&P Sector ETFs – Weekly Charts - To See a Larger Image,
Right-Click and Press Open in a New Tab
S&P Sector ETFs – Sorted by Weekly Percent Change This Week
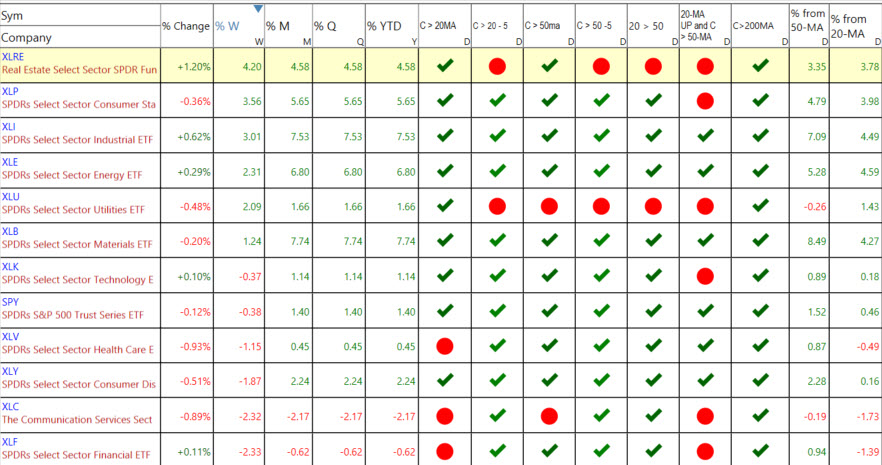
Last week’s percentage changes.
The percentage changes tell you which sectors were the strongest or weakest on Friday and for the week, month, quarter, and year.
There are seven columns after the percent changes in the sector listed above.
You can see the ETFs that are the strongest getting stronger or weakening.
- Close above or below the 20-MA.
- Close above or below the 20-MA 5 Days Ago. C>20 -5
- Close above or below the 50-MA.
- Close above or below the 50-MA 5 Days Ago. C>50 -5
- 20-MA above or below the 50-MA.
- 20-MA is pointed up, and the close is above the 50-MA
Where are the Markets Headed this Week?
With many stocks extended in the short term, the risk of consolidation or a pullback is rising. At the same time, stocks that have already been weak may not be finished moving lower if broader markets soften.
Those trapped in sideways ranges that were unable to participate during recent strength are particularly vulnerable during any short-term market weakness. Sideways markets tend to resolve with force, and laggards rarely get a free pass when pressure appears.
Importantly, our internal market gauges have not shifted to risk-off. Sentiment remains neutral, which leaves room for additional intermediate-term upside. That said, short-term corrections are inevitable. They always are.
Adding to the possibility of near-term adjustment was the decisive move higher in interest rates last week. On Friday, the 3-month, 2-year, 5-year, and 10-year Treasury yields all pushed higher together. The message from the bond market was clear: the Fed is not in a hurry to cut.
Fed cuts are liquidity, and liquidity is what markets thrive on. When the belief that another cut is imminent fades, the “party mode” can change quickly, and markets begin to adjust rather than accelerate.
Whether the move in yields—driven by bond selling—is a function of higher inflation expectations, stronger economic growth, or a mix of both, will be clarified over time. What matters right now is that the bond market, which had been indecisive and choppy for weeks, is finally resolving its indecision.
Rotation may continue to shuffle money out of winners and into laggards, keeping the broader indices contained within a range, perhaps a wider one. That type of environment favors selectivity, patience, and disciplined risk management, not prediction. It can be very good for Credit Spreads.
There will be no shortage of headlines capable of moving markets this week. As always, our focus will remain on price, structure, and risk, not opinions.
DOW JONES
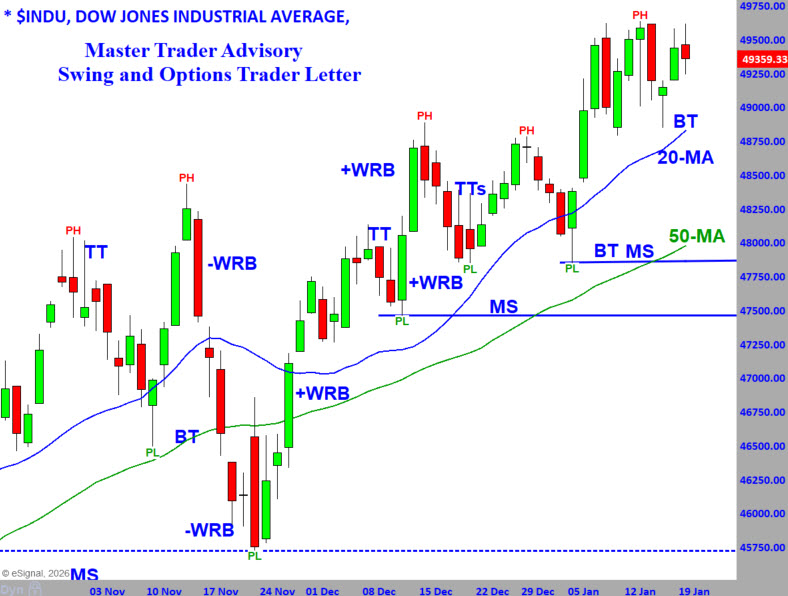
The chart above shows the Dow Jones Industrial Average through the lens of Master Trader Technical Strategies.
The Dow Jones Industrial Average continues to hold its uptrend and has been consolidating gains from two weeks ago.
Now that options expiration is behind us, we’ll see whether it can push through consolidation into new all-time highs.
Four Dow components report this week: 3M, Johnson & Johnson, Travelers, and Procter & Gamble.
Major Support remains aligned with the rising 50-day moving average. In strong markets, price does not revisit that level quickly. Any retracement should hold near the 20-MA, roughly around 48,400.
In the strongest scenarios, the Dow would not close below last week’s Bottoming Tail aligned with the 20-MA.
That’s the line in the sand.
VIDEO REVIEW OF MARKETS, SECTORS AND INTERNALS - Click lower right to open Full Screen.
NEW STOCK TRADING IDEAS Below
NOTE: Please see the document in RESOURCES entitled Master Trader Guidelines for Trading the Open and Gaps.
Note on Position Size Calculation in the Open Trades Sheet:
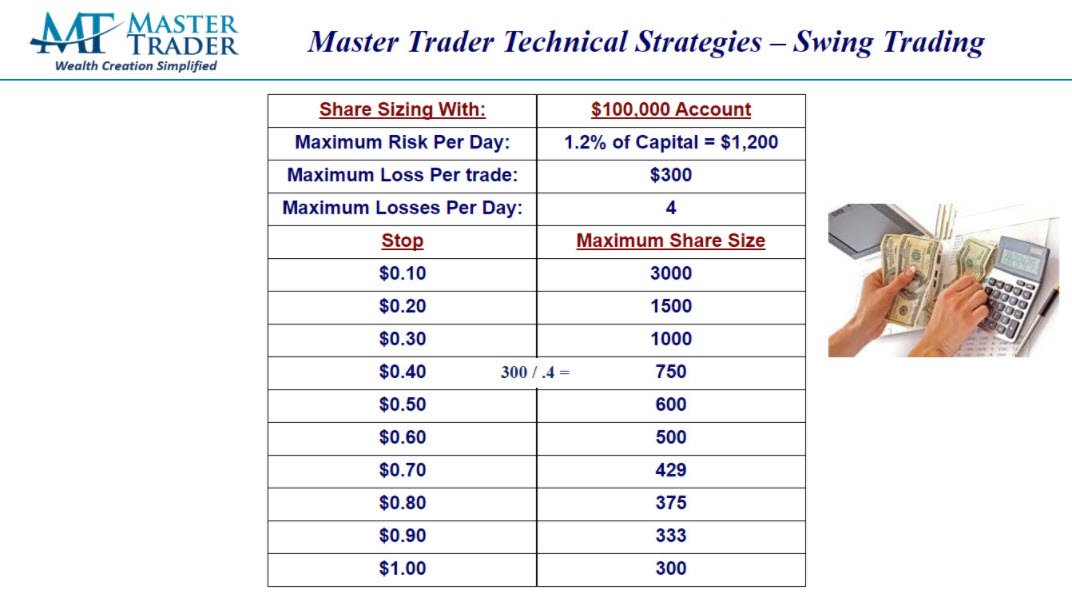
All trades are based on a hypothetical Max Loss of $300/trade. For Stocks, that is $300 / (Entry - Stop). Directional option trades use the same formula, then divided by 100, rounded down to the nearest whole number, with a minimum of one (1).
The “Master Trader Blended Method” for shorting options/spreads size starts with the stock position size, multiplying by 1.5, then divide by 100 because 1 contract represents 100 shares.
A number of our suggested trades have larger stops because of Friday's expanded volatility. Please calculate position size according using your Max Loss per your Trading Plan.
Here's an example:
AMS Teaches You How to Maximize Profits on Every Trade. Click Here to Read More
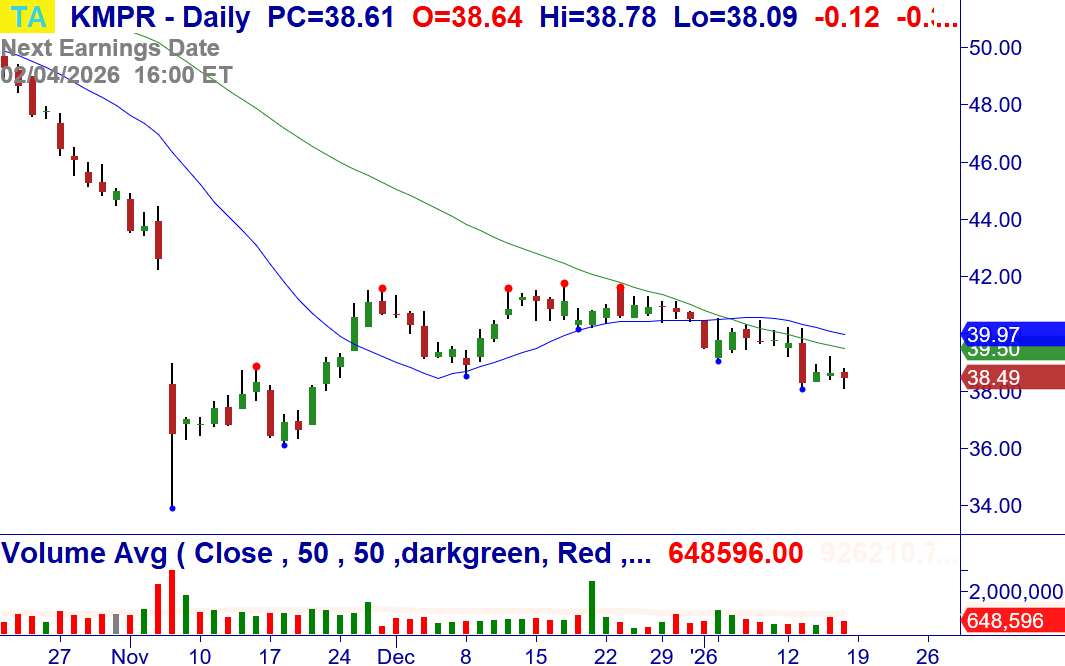
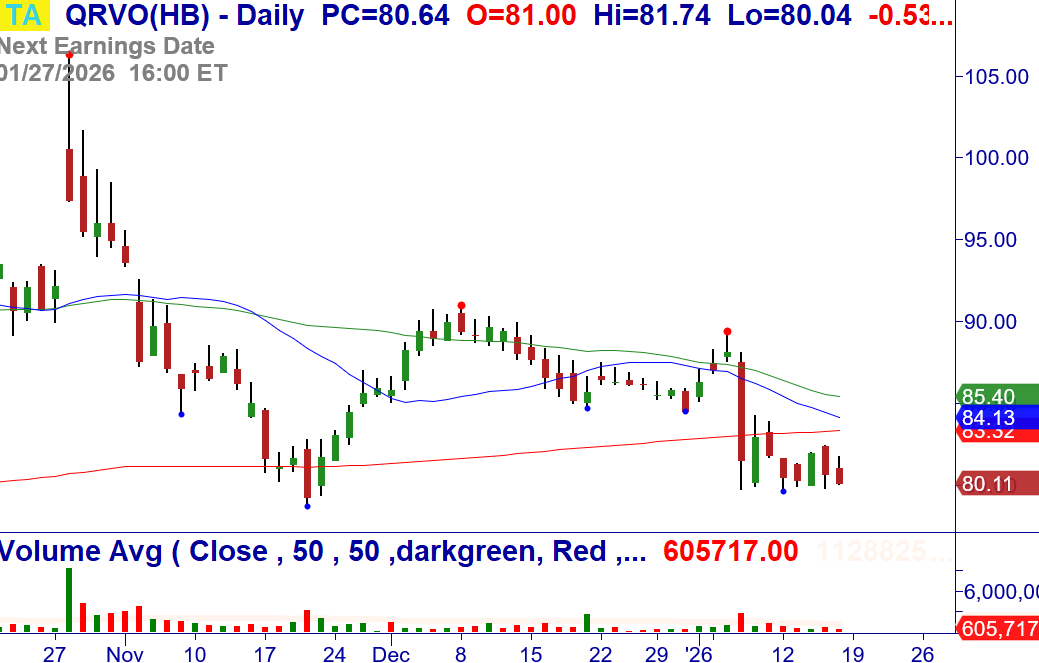
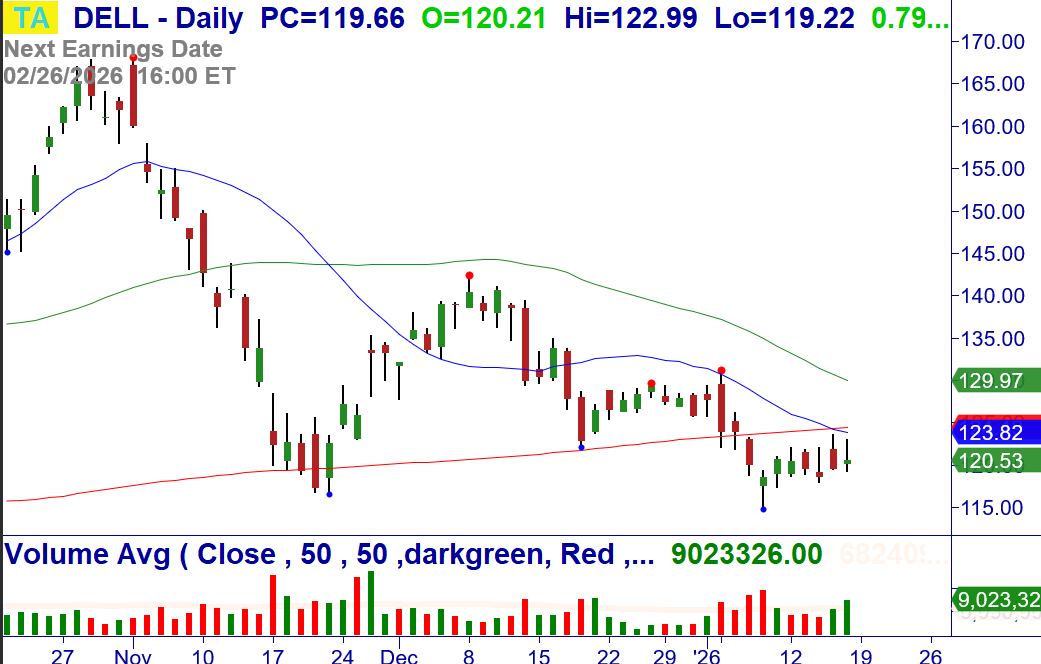
1/20: DELL – Under $117.93, consider shorting the stock. Breakdown at the 20/200-MA, -123 weekly. Stop $124.02.
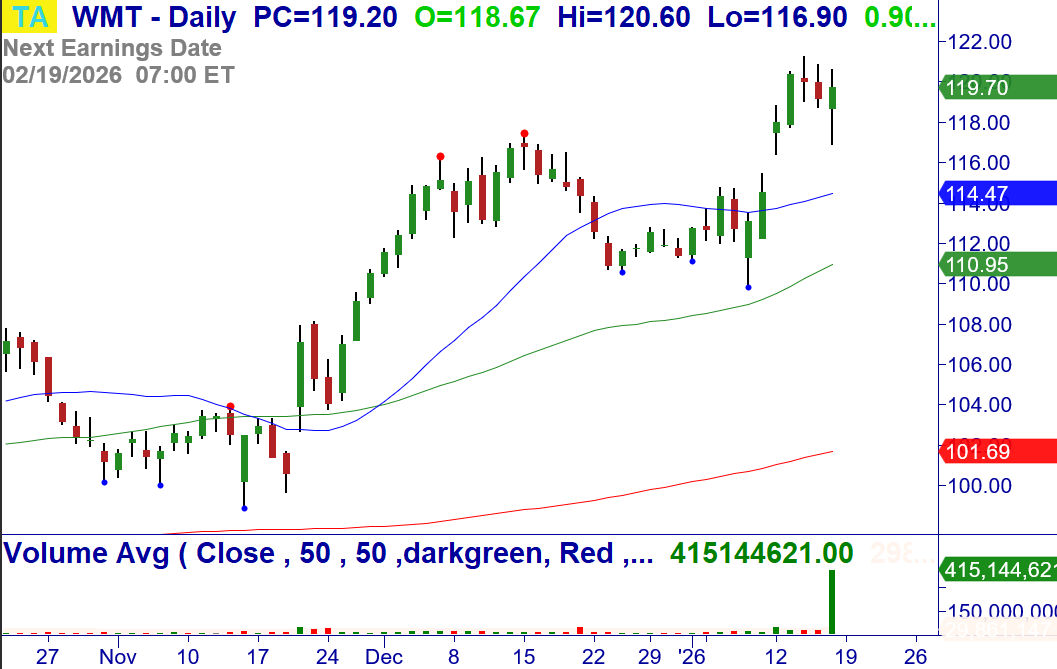
1/20: WMT – Over $121.24, consider buying the stock. Bull Rectangle Breakout. Stop $116.78.
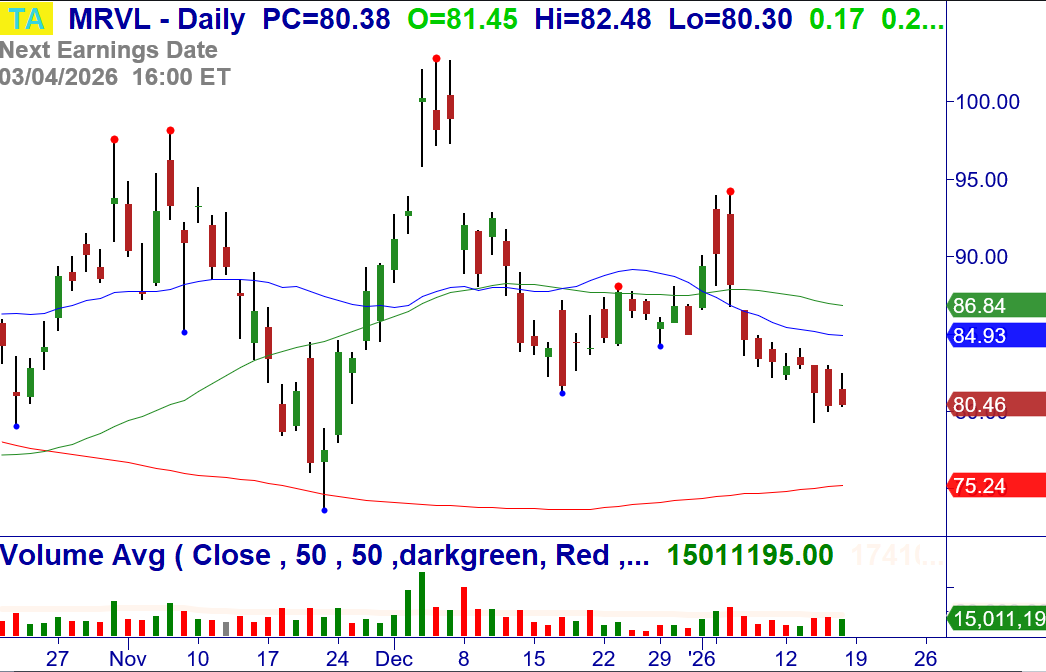
1/20: MRVL – Under $80.00, consider shorting the stock. Continuation Breakdown. Stop $83.02.
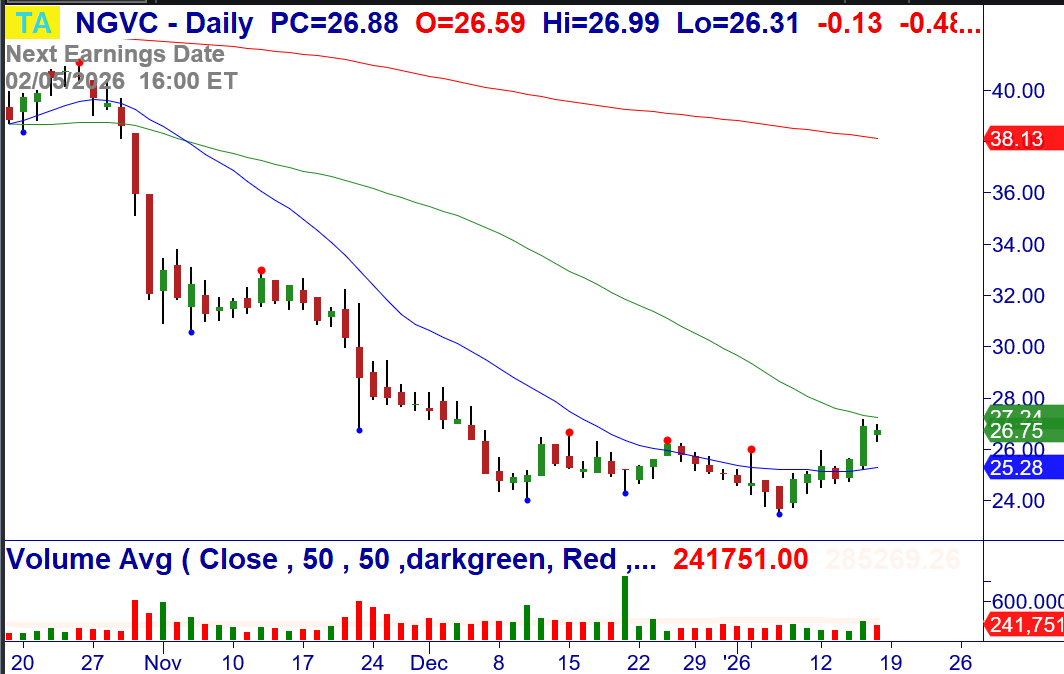
1/20: NGVC – Over $27.18, consider buying the stock. +123 Breakout of a bottoming pattern at the 20/50-MA. Stop $25.22.
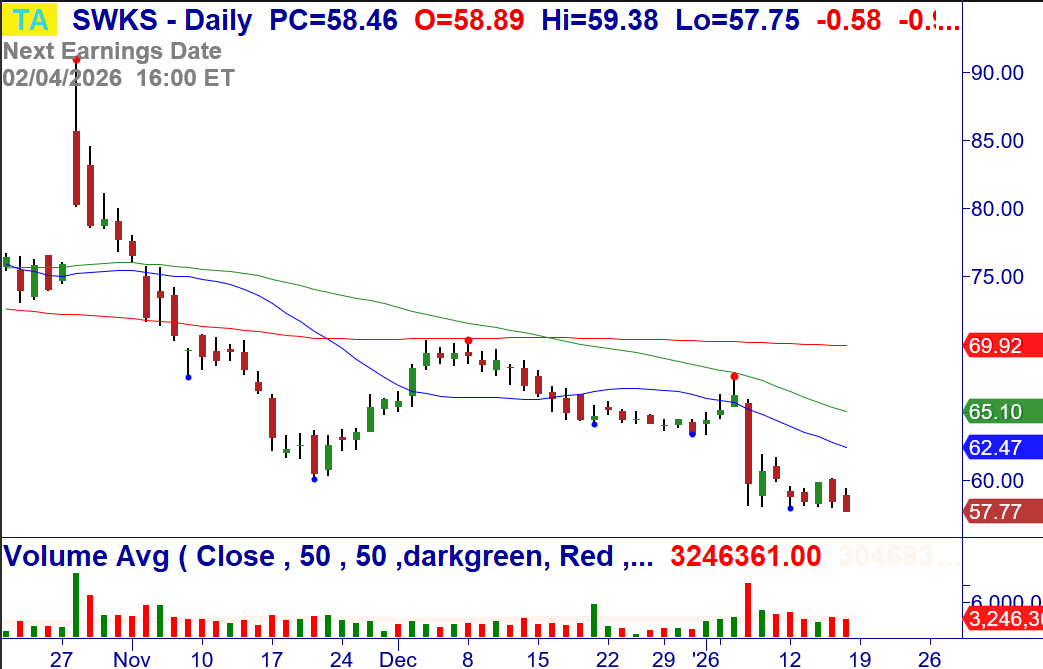
1/20: SWKS – Under $57.75, consider shorting the stock. Bear Rectangle Breakdown, -123 weekly. Stop $60.42.
Money Management for Trading and Investing
Proper money management for investing and Trading starts with position-sizing based on the amount of money you are willing to risk on a signal trade.
CLICK HERE to review these Master Trader Guidelines and Basic Money Management and Position Sizing Table.
NEW OPTIONS TRADING IDEAS
Directional Options Strategies and Debit Spreads for Swing Trading (See the Weekly Options Trader letter, which sells options/spreads for weekly Income that primarily expire in 10 days or less, CLICK HERE)
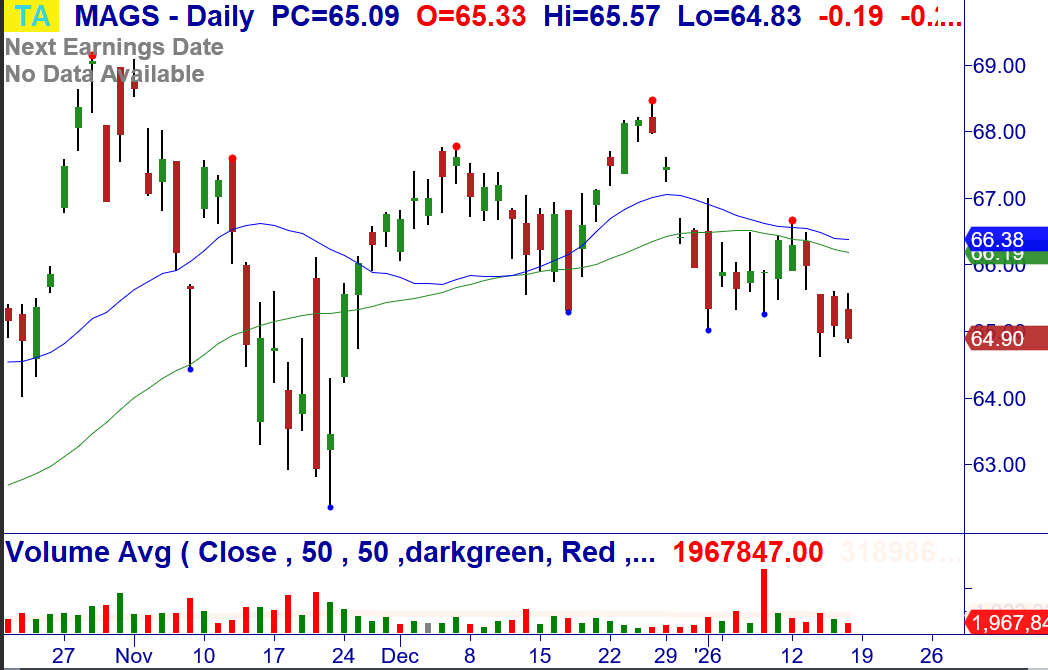
1/20: MAGS – Under $64.83, consider buying Jan (1/23) $65 puts for a limit of $.55/share (closed at $.50/share). Continuation Breakdown. Stop $66.02.
The Master Trader approach to selling credit spreads around technical turning points.
Read about the Weekly Options Trader letter, which sells options/spreads for weekly Income that primarily expire in 10 days or less, around Master Trader technical turning points, CLICK HERE
By selling spreads on stocks and ETFs where MTS indicates price is unlikely to go, we become the “smart money,” getting paid to take calculated, well-defined risk.
Check out the blog article with more information and monthly results, CLICK HERE
Professional consistency, short-duration trades, and risk-controlled income — that’s what defines the Master Trader approach.
Master Trader Holiday Sale: Courses, Memberships & More
Special deals for traders and investors of every level — enjoy savings that pay off all year long, CLICK HERE
Because your success is vital to you – and us.
Before selling options or credit spreads, we urge you to review the valuable and detailed information that we have provided for you in your Member’s Area Resources.
A quick simplified approach to calculating contract size is to simply base your contract size based on the number of shares permitted in your Trading Plan as if you were trading the stock or ETF. Simple Share Sizing = $ Risk / Stop Loss
The amount of money that you are willing to risk – divided by – the stop loss amount. For example, $100 / .20 = 500 shares. Credit Spread example, if your Trading Plan allowed you to trade 543 shares of AAPL based on the stop loss, then simply round down to the nearest hundred and short an equivalent number of contracts of the option. Since 1 contract represents 100 shares of the underlying, this would be five (5) contracts.
Master Trader and You Building Your Financial Future Together!
Good trading!
If you have any questions or comments, please e-mail Greg Capra at Greg@mastertrader.com or Dan Gibby at Dan@mastertrader.com
All the best,
Greg Capra Managing Director of Master Trader
Dan Gibby Chief Options Strategist
NOTE: Master Trader will show the opening and closing prices of all stock and options trades. We recommend that all traders and investors use proper share sizing for positions and money management. However, we cannot recommend what that is for your particular trading style, risk tolerance, or account balance. We urge you to calculate your own share/position size based on your individualized risk parameters, Trading Plan, and familiarity with the proposed trade strategy and risk. Advanced Management Strategies (AMS) covers in detail foundation and advanced position and money management.
NOTE: Master Trader and its representatives may have existing positions in actual or other trade recommendations before or after suggested herein. Additionally, we may manage them differently for internal purposes based on different risk parameters than noted herein. All trade ideas and content are for informational and educational purposes only. It is not, nor is it intended to be, trading or investment advice or a recommendation that any security, option, or investment strategy is suitable for any person. Trading securities can involve high risk and the loss of any funds. Significant gaps or volatility can increase these losses, particularly for short option strategies. Investment or trading information provided may not be appropriate for all investors, and is provided without respect to individual financial sophistication, financial situation, investing time horizon or risk tolerance. Supporting documentation for any claims (including claims made on behalf of options programs), comparison, statistics, or other technical data, if applicable, will be supplied upon request. Master Trader Consulting, Inc. is not a licensed financial advisor, registered investment advisor, or a registered broker-dealer. Options, futures, and futures options are not suitable for all investors.

