

Some of last week’s comments included:
"The start of a month and a year is typically up, but I see it as a touch-and-go with limited upside.
Buy Setup failure patterns will support moving toward a more bearish bias."
What happened?
Market Overview – A Strong Start, But Not a “Throw-a-Dart” Market
In last week’s letter, we said the start of a new month and a new year is typically bullish—but that this one looked more like a touch-and-go environment with limited upside, not a runaway rally. We also noted that Buy Setup failures would be an early warning of a more bearish bias developing.
So far, the market has done exactly what we would expect in a news-driven, institutionally managed environment.
Depending on the index you focus on, the advance looked very different:
- Small caps exploded higher in a near-vertical move.
- The S&P 500 ground higher in a controlled, methodical advance.
- The NASDAQ 100 chopped sideways most of the week before resolving higher on Friday.
Different looks—but the same message: rotation, not speculation, is driving this market.
The Big Picture: Strong Start, Selective Participation
The first full trading week of 2026 kicked off on a strong note, aligning with January’s historical tendency to lean bullish. The major indices advanced amid a mix of geopolitical headlines, softer economic data, and policy developments out of Washington.
The S&P 500 gained roughly 1–2% on the week, closing Friday decisively above 6,900 and within striking distance of the psychologically important 7,000 level. The Dow pushed to record territory, while the NASDAQ posted modest gains. The real standout was small caps, with the Russell 2000 surging 4–5%, signaling a broadening of participation beyond mega-cap technology.
That broadening matters—but it does not mean “everything is bullish.”
In fact, one of the more important observations this week was that the Magnificent Seven ETF (MAGS) has one of the weakest-looking charts. It remains neutral to negative, despite catching a bid on Friday as the broader market lifted. Within that group, only Amazon and Alphabet maintain clean bullish trends. The rest are lagging.
That divergence reinforces a theme we’ve been discussing for months:
This is not a market where leadership can be taken for granted.
Economic Data: Weak on the Surface, Supportive Underneath
The December jobs report, released Friday, showed payroll growth of just 50,000—well below expectations and capping the weakest year of job growth since 2020. While the unemployment rate ticked slightly lower, the broader takeaway is clear: the labor market is cooling.
Under normal conditions, that would be a problem. In this market, it was viewed as a feature, not a bug.
Markets interpreted the data as increasing the odds of a dovish Federal Reserve later this year rather than signaling imminent recession. Wage growth remained contained, inflation fears stayed muted, and rate-cut expectations quietly firmed.
That combination helped explain why the market shrugged off “bad” news and continued higher.
Geopolitics: Headlines Without Lasting Impact (So Far)
The U.S. military operation in Venezuela early in the week initially looked like it could be a major market mover. It wasn’t.
Crude oil failed to spike meaningfully, and equities absorbed the news without disruption. While there is talk of increased oil supply and even a potential glut, a more realistic, contrarian view suggests execution risks, infrastructure decay, and political instability could delay any meaningful production increases.
There’s also a bigger chessboard at play. Limiting China’s access to Venezuelan crude could shift global energy flows and, over time, shift pricing power. That’s a longer-term issue—not something the market is pricing aggressively today.
Policy Uncertainty Eases—For Now
Another source of volatility last week was the anticipated Supreme Court ruling on challenges to Trump’s tariff policies. Traders positioned for the decision, volatility picked up… and then nothing happened.
The Court delayed its ruling, removing a near-term uncertainty and helping fuel the rally. If the tariffs are ultimately ruled illegal, the implications could be enormous—but markets prefer delayed clarity to immediate disruption, and that’s exactly what they got.
Trump also floated a plan to restrict large institutions from purchasing additional single-family homes. That headline sparked strong gains in homebuilders, as investors interpreted it as a potential tailwind for new construction.
Rates, Volatility, and the Calm Before OPEX
Interest rates remained steady, with the 10-year Treasury hovering near 4.2%. The bond market continues to signal cautious optimism—no recession panic, but growing confidence that inflation is cooling enough to allow easing later this year.
Volatility told the same story. The VIX stayed subdued in the mid-teens, reflecting complacency—or confidence—depending on your perspective.
That calm may not last.
Options Expiration, Data Risk, and the 7,000 Level
This week brings monthly options expiration, which often introduces short-term whipsaws. Open interest is heavily concentrated in the S&P 500 between the 6,800 and 7,000 strikes, with a “max pain” (break below) zone near 6,925.
That creates a gravitational pull—and potential pinning—around those levels.
Overlay that with a busy economic calendar:
- Core Inflation and CPI on Tuesday
- PPI and Retail Sales on Wednesday
- Jobless Claims on Thursday
Hot inflation numbers could pressure small caps and rate-cut expectations. Softer prints could be the excuse for a push through 7,000.
From a technical perspective, the S&P 500 struggled for weeks between roughly 6,860 and 6,900. Friday’s decisive close above 6,900 increases the probability of at least testing 7,000 and possibly overshooting it—something markets often do around widely watched levels.
That said, this is not a low-risk environment.
Options expiration, unresolved tariff policy, and headline risk from Washington all increase the odds of sharp intraday reversals.
This is exactly the kind of market where patience, selectivity, and discipline matter most.
The market started 2026 strong—but it’s doing so through rotation, not blind accumulation.
Leadership is narrowing, laggards are catching bids, and institutions are clearly active. At the same time, failed setups, headline risk, and event-driven volatility mean this is not a market to chase.
As always, our focus remains on high-probability setups, clean patterns, and knowing when the best trade is to "Sit on Our Hands" (SOH).
Quality patterns, along with MTS Position and Money Management, will always put us in the best position.
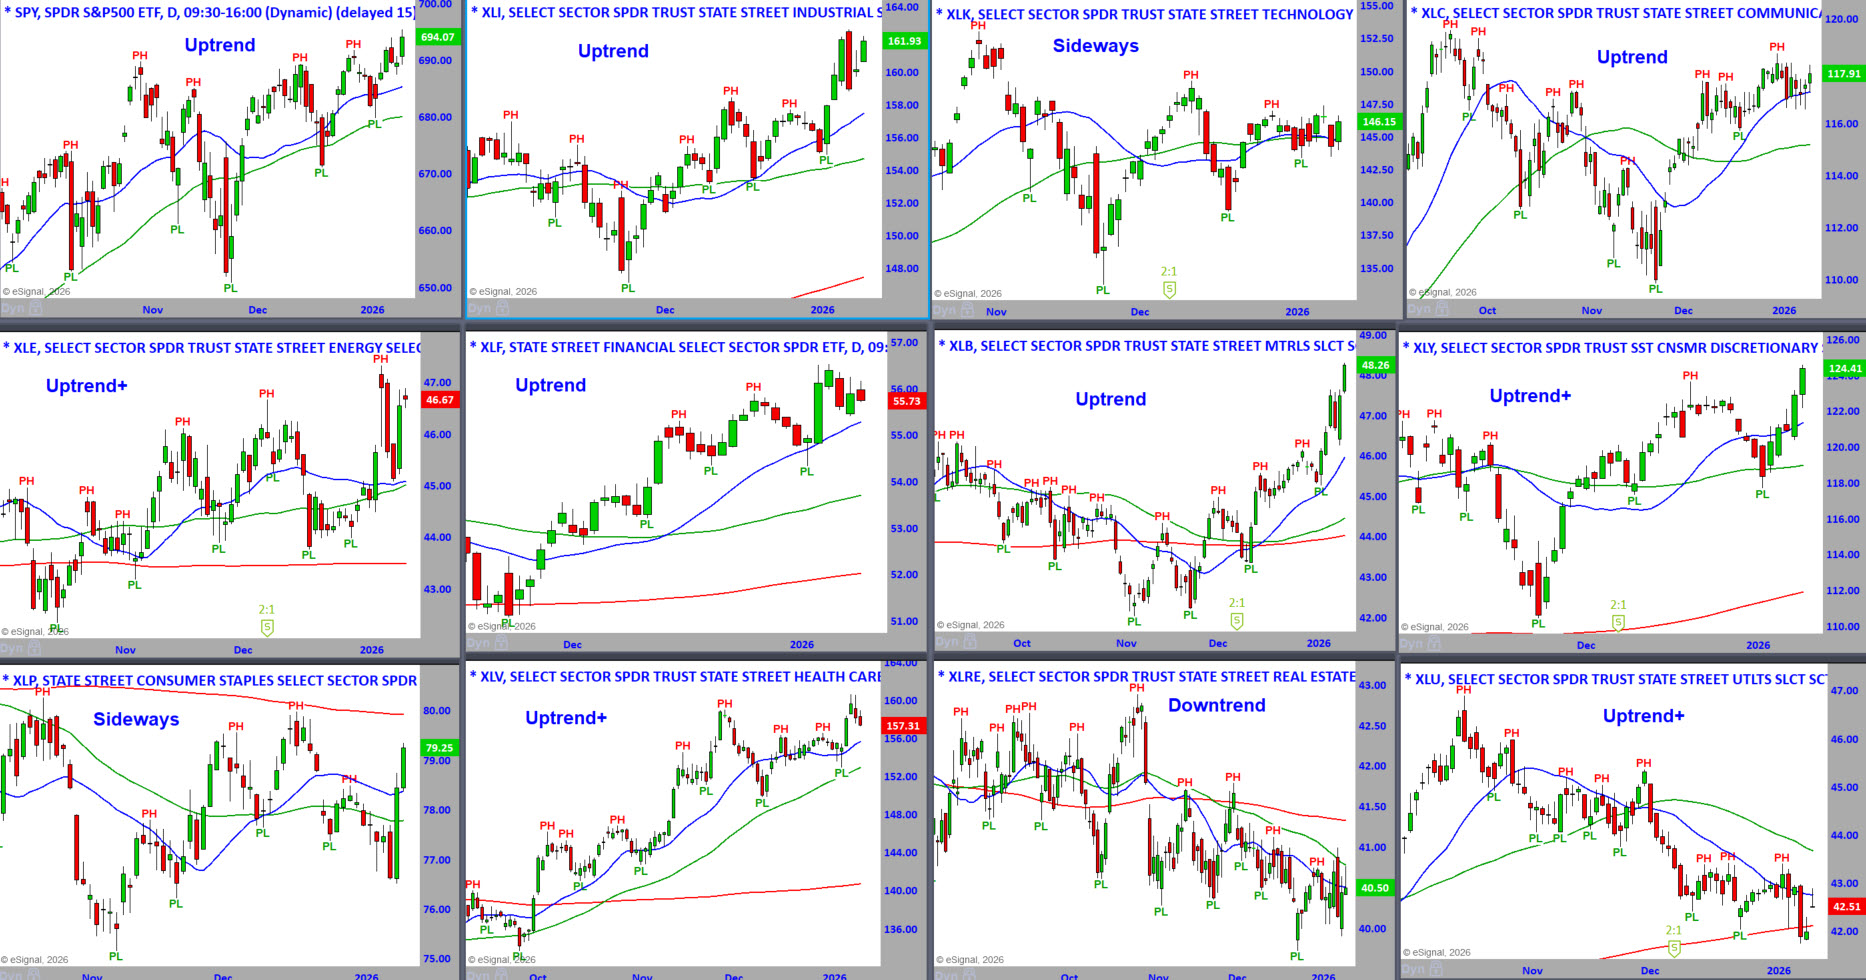
S&P Sector ETFs – Daily Charts - To See a Larger Image,
Right-Click and Press Open in a New Tab
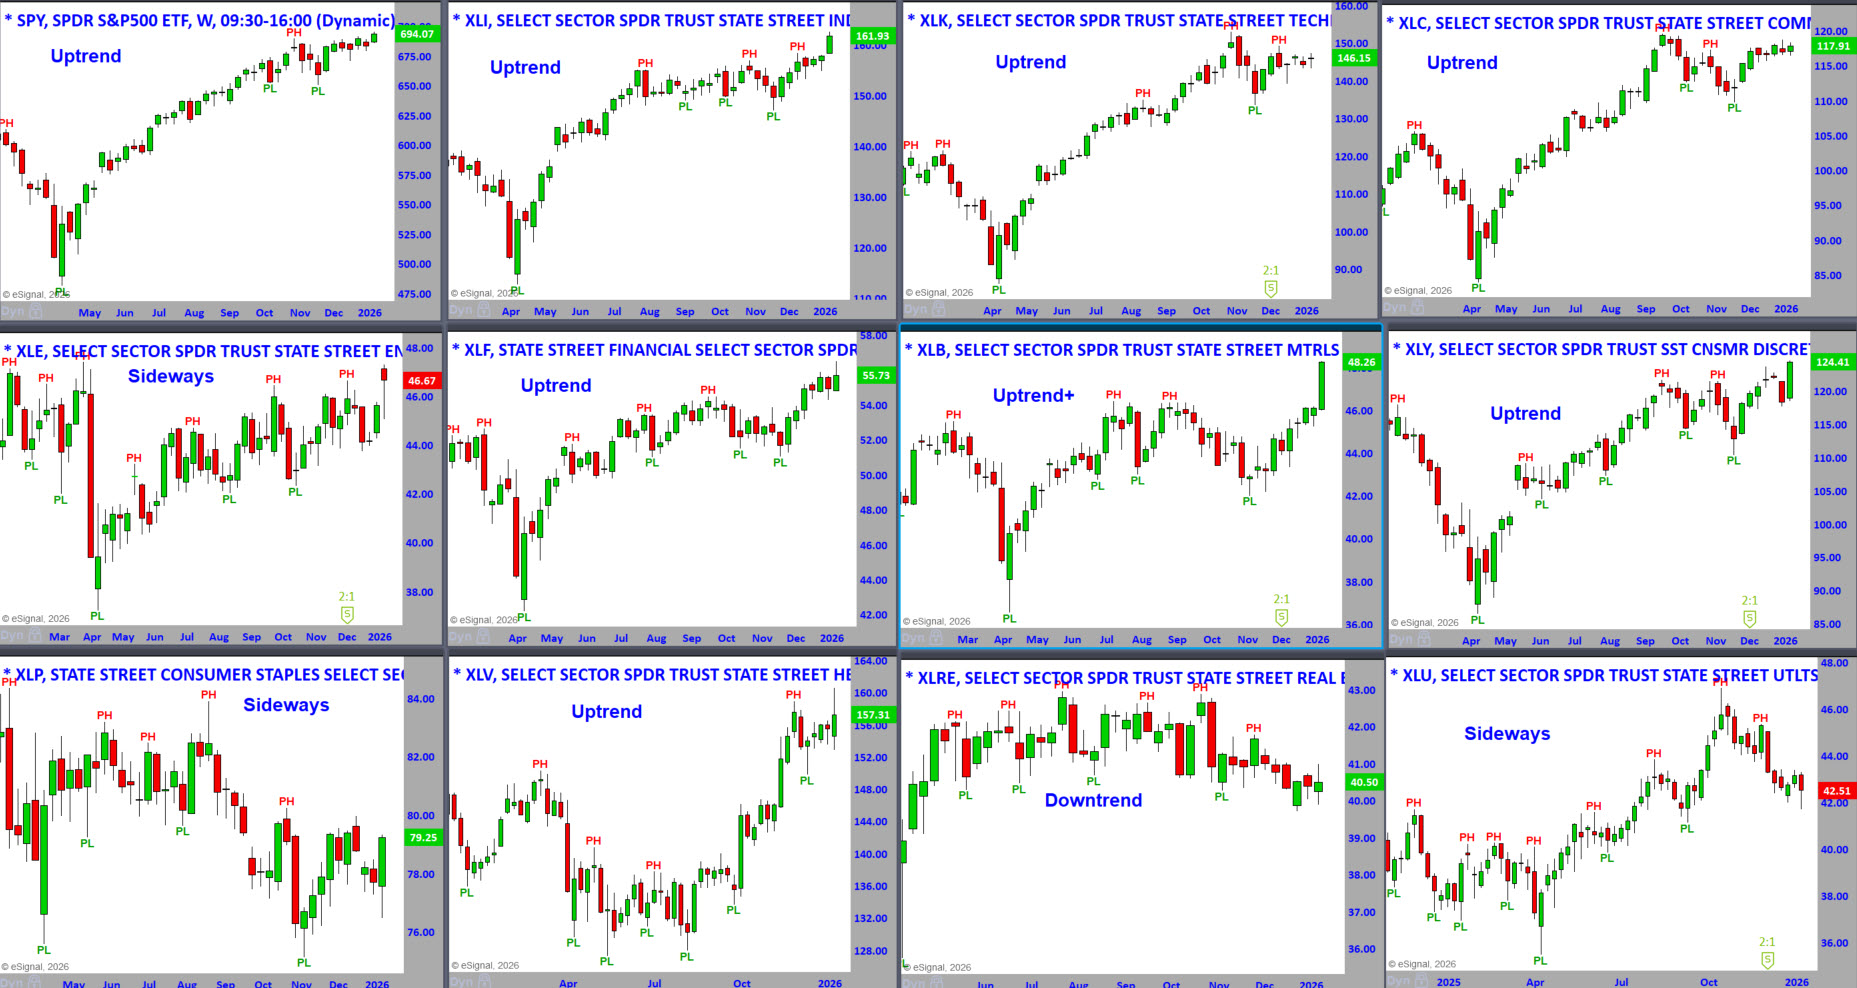
S&P Sector ETFs – Weekly Charts - To See a Larger Image,
Right-Click and Press Open in a New Tab
S&P Sector ETFs – Sorted by Weekly Percent Change This Week

Last week’s percentage changes.
The percentage changes tell you which sectors were the strongest or weakest on Friday and for the week, month, quarter, and year.
There are seven columns after the percent changes in the sector listed above.
You can see the ETFs that are the strongest getting stronger or weakening.
- Close above or below the 20-MA.
- Close above or below the 20-MA 5 Days Ago. C>20 -5
- Close above or below the 50-MA.
- Close above or below the 50-MA 5 Days Ago. C>50 -5
- 20-MA above or below the 50-MA.
- 20-MA is pointed up, and the close is above the 50-MA
Where are the Markets Headed this Week?
The markets are about as close to firing on all cylinders as we’ve seen in quite some time. That alone is enough to trigger contrarian instincts—and rightly so—but importantly, our market internals are not aligned to support a bearish bias at this time.
From a confirmation standpoint, the message is hard to ignore.
The Dow Jones Industrial Average and the Dow Jones Transportation Average both pushed to new all-time highs, confirming the bullish message of Dow Theory. At the same time, the S&P 500 and the Russell 2000 also registered new record highs—telling us that large caps and small caps are advancing together, not diverging.
That kind of alignment doesn’t happen often, and when it does, it usually reflects broad institutional participation rather than speculative excess.
Even areas that are typically erratic are cooperating. The XME, a sector ETF we rarely describe as “well-behaved,” has been trending higher with clean, bullish bar-by-bar price action. That’s another sign that this advance is not narrowly focused.
The XLY also deserves attention. After a deep retracement, it has not only recovered but pushed to new all-time highs. This move has been fueled in part by President Trump’s policy comments—often delivered with a fair amount of inconsistency—but regardless of the headlines, the charts are bullish, and that’s undeniable.
Within Consumer Discretionary, the response was explosive. Stocks such as Home Depot, Lowe’s, Pulte Homes, Pool Corp., Lennar, and D.R. Horton all saw powerful upside expansion—clear evidence of institutional accumulation rather than short-term speculation.
That said, this week brings an important speed bump.
It is options expiration week, and there is significant open interest in both calls and puts clustered around the 7,000 strike on the S&P 500. Levels like this tend to act like a magnet. An intraday consolidation near 7,000 could fuel another leg higher—but that same open interest can just as easily cap upside enthusiasm and pull prices back toward the strike.
Our internal market gauges remain neutral, which means there is still fuel in the tank for movement in either direction. For now, however, we are giving the benefit of the doubt to the prevailing uptrends, not fighting them.
Add to that the anticipated tariff decisions, economic data releases, and options expiration dynamics, and the setup clearly points to elevated short-term volatility.
The most likely path forward is continued buy-the-dip behavior, with options-related forces keeping rallies from becoming too vertical. That’s a healthy condition—one that supports higher prices over time but demands discipline and selectivity in the short run.
In other words, the trend is up—but this is not the week to get sloppy.
DOW JONES
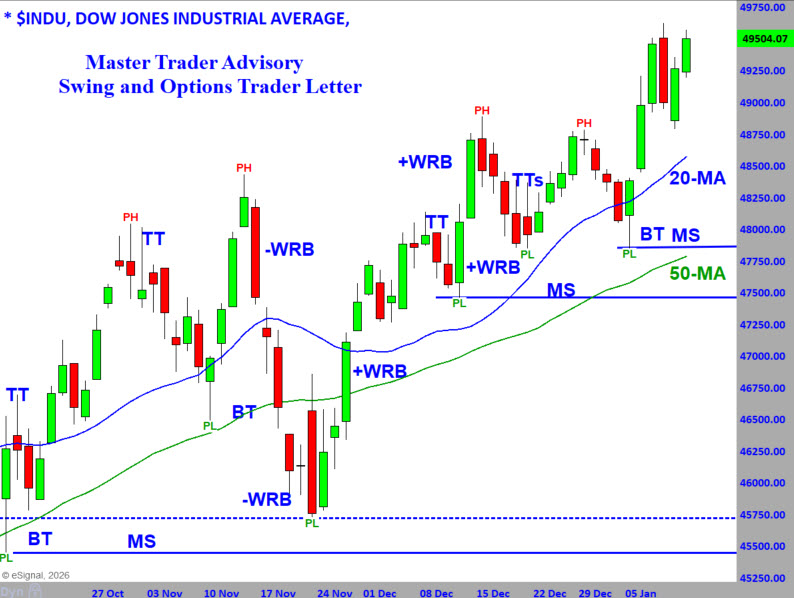
The chart above shows the Dow Jones Industrial Average through the lens of Master Trader Technical Strategies.
The Dow has been trading erratically. It broke out at the start of November, creating a new level of Major Support (MS), violated the MS, and then rallied back to a new high at the beginning of December.
The back-and-forth did not stop; instead, the whips became a smaller roller coaster!
That was a tightening, which was a small positive in price action.
The start of the month and the year's bullish seasonality came in, and the Dow made new all-time highs.
The new high creates a higher, new level of Major Support (MS) near 48,000. In an ideal bullish trend, the price never reaches MS.
At this time, the trend is up, and we know where the price should not go.
Master Trader Tip: Notice Wednesday's Wide Range Red Bar (-WRB) that was Ignored. We don't know a red bar is ignored until it happens, but in a bullish trend, that is what should happen and confirms the uptrend.
VIDEO REVIEW OF MARKETS, SECTORS AND INTERNALS - Click lower right to open Full Screen.
NEW STOCK TRADING IDEAS Below
NOTE: Please see the document in RESOURCES entitled Master Trader Guidelines for Trading the Open and Gaps.
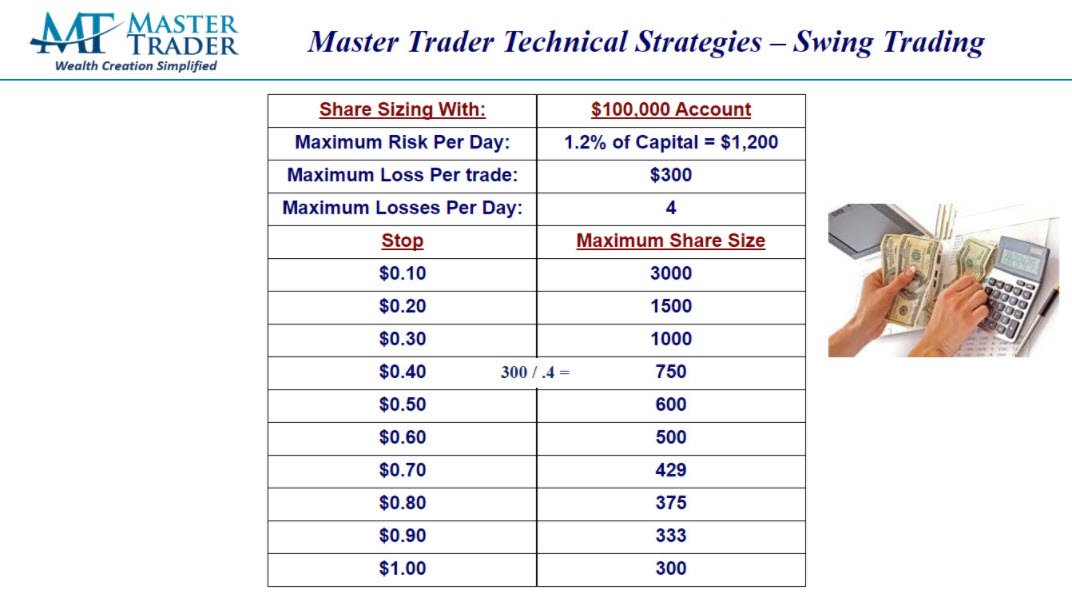
Note on Position Size Calculation in the Open Trades Sheet:
All trades are based on a hypothetical Max Loss of $300/trade. For Stocks, that is $300 / (Entry - Stop). Directional option trades use the same formula, then divided by 100, rounded down to the nearest whole number, with a minimum of one (1).
The “Master Trader Blended Method” for shorting options/spreads size starts with the stock position size, multiplying by 1.5, then divide by 100 because 1 contract represents 100 shares.
A number of our suggested trades have larger stops because of Friday's expanded volatility. Please calculate position size according using your Max Loss per your Trading Plan.
Here's an example:
AMS Teaches You How to Maximize Profits on Every Trade. Click Here to Read More
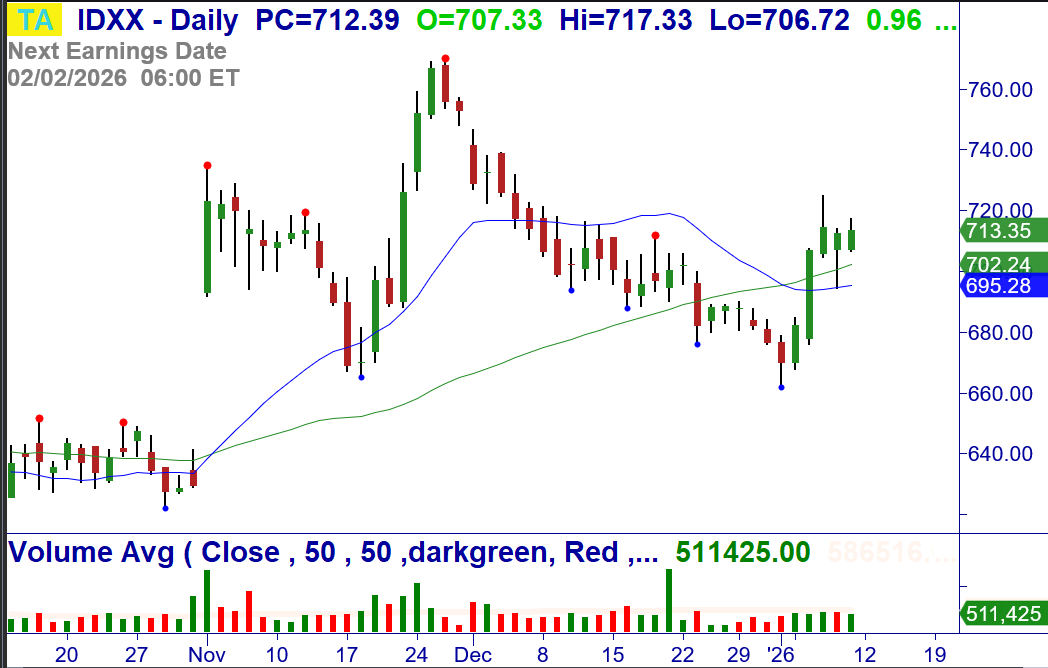
1/12: IDXX – Over $717.33, consider buying a ½ lot of the stock. Bullish consolidation after +WRB Breakout at the 20/50-MA. Stop $693.88.
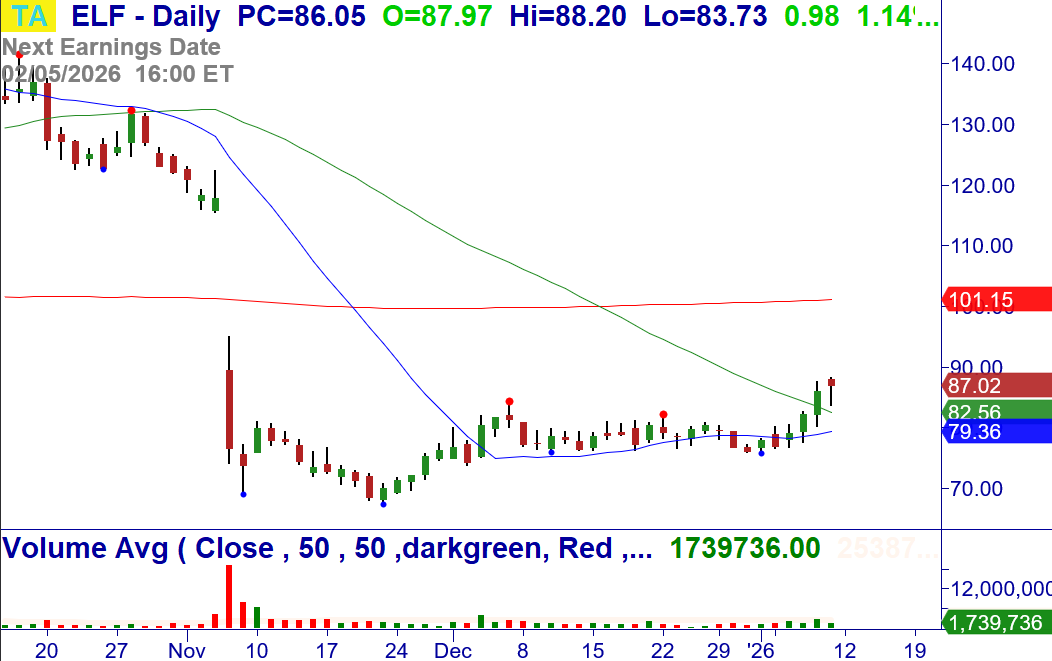
1/12: ELF – Over $88.20, consider buying the stock. Breakout of a bottoming pattern at the 20/50-MA. Stop $80.08.
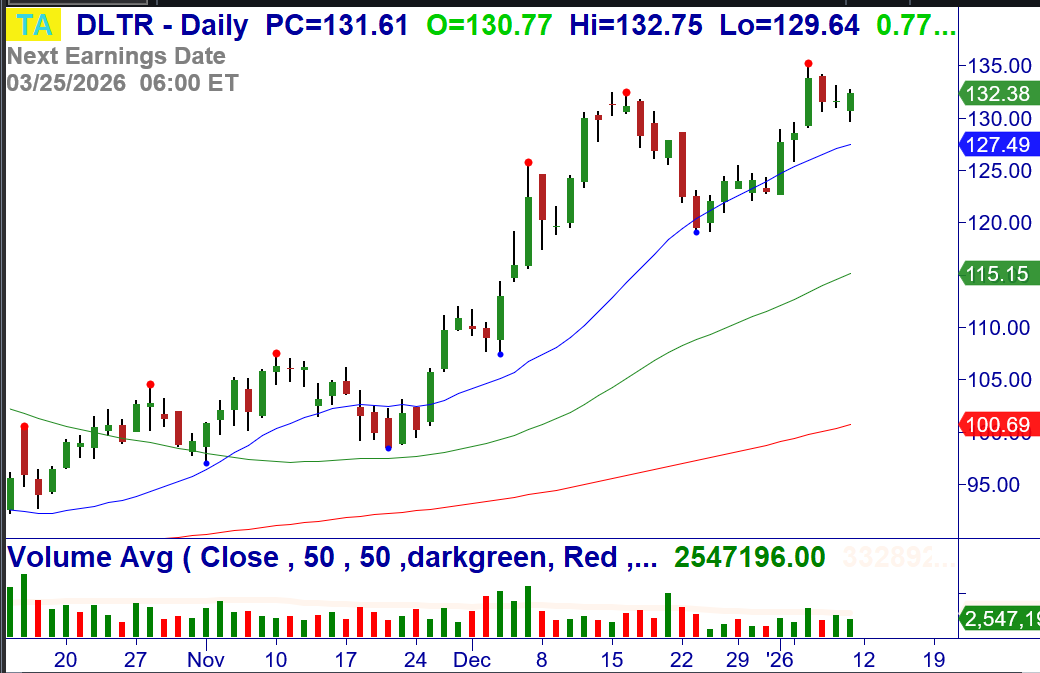
1/12: DLTR – Over $132.75, consider buying the stock. Buy Setup and reversal. Stop $129.08.
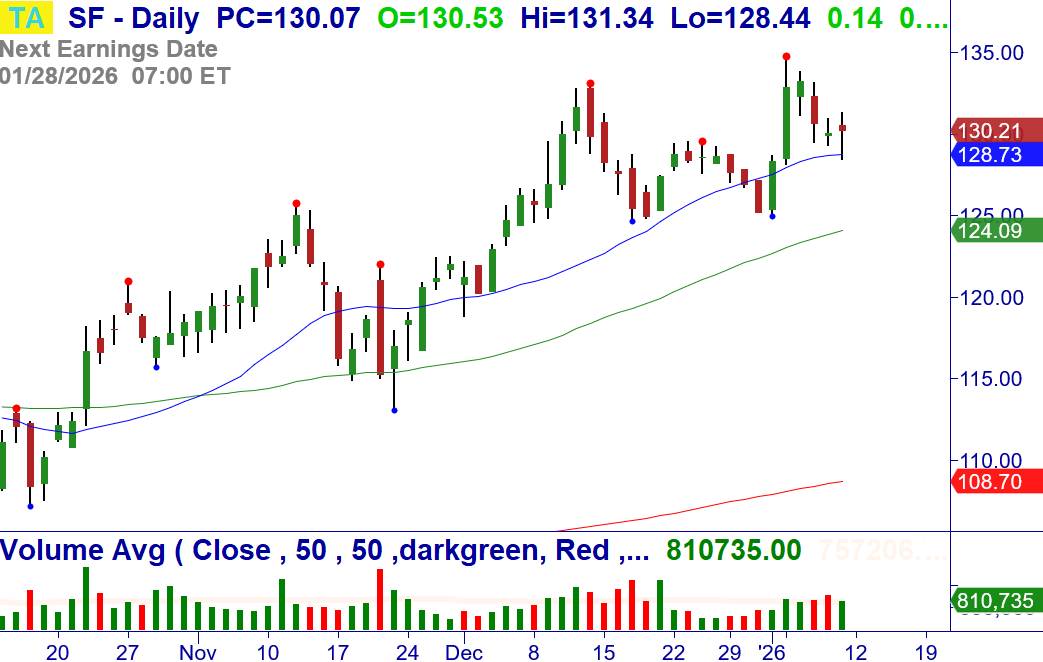
1/12: SF – Over $131.34, consider buying the stock. Buy Setup and reversal at the 20-MA. Stop $128.18.
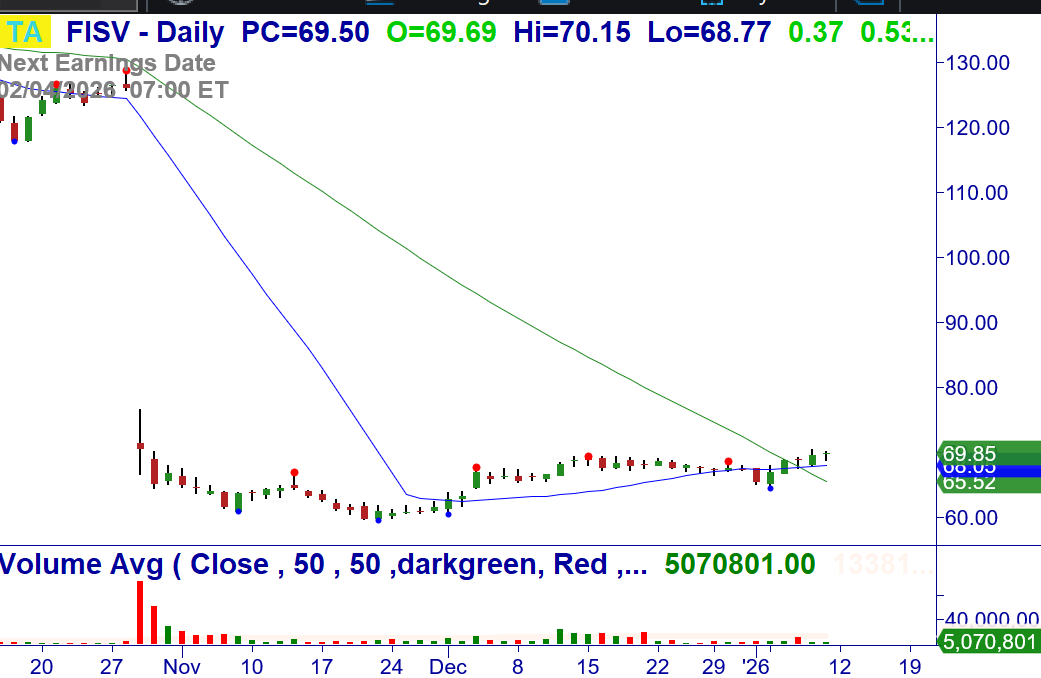
1/12: FISV – Over $70.41, consider buying the stock. Breakout of a bottoming pattern at the 20/50-MA. Stop $67.38.
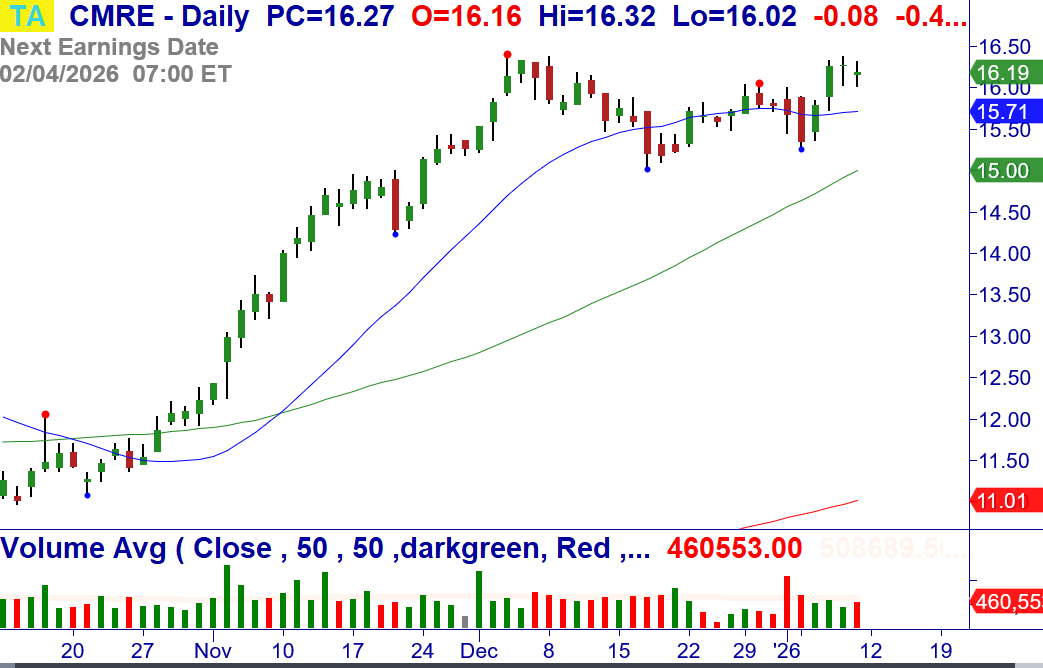
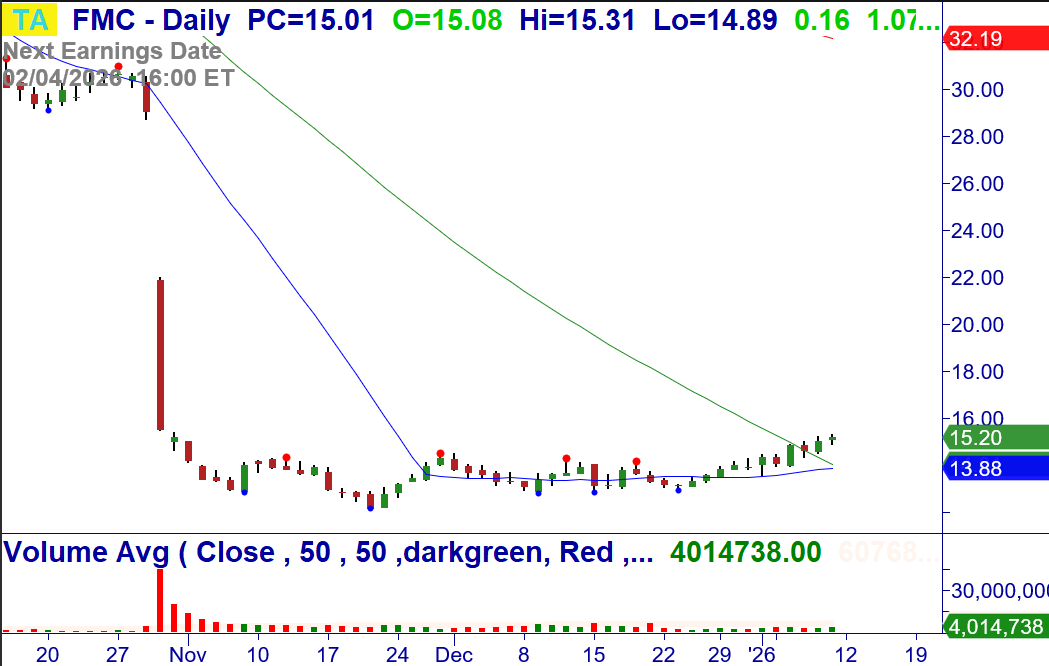
1/12: FMC – Over $15.32, consider buying the stock. Breakout of a bottoming pattern at the 20/50-MA. Stop $14.28.
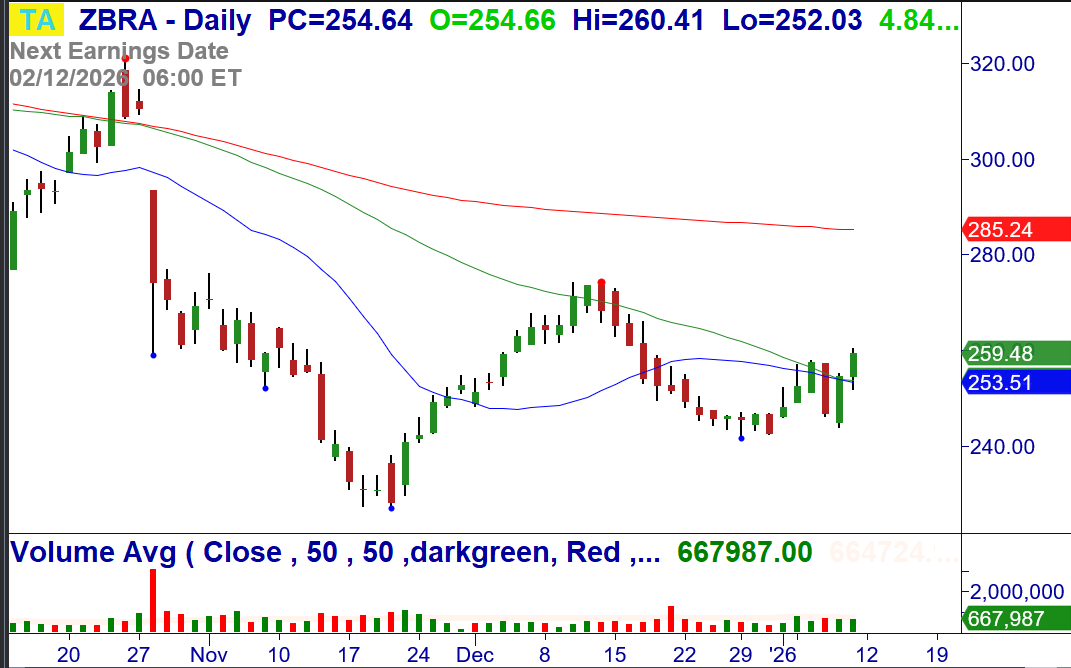
1/12: ZBRA – Over $260.71, consider buying the stock. +180 Breakout of a bottoming pattern at the 20/50-MA. Stop $247.88.
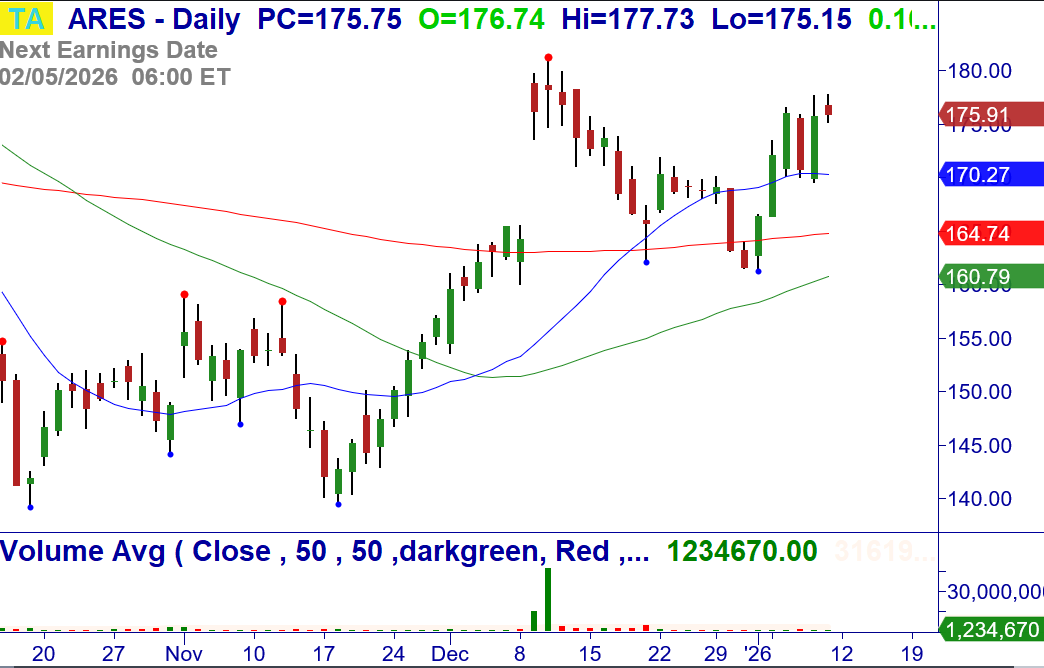
1/12: ARES – Over $177.73, consider buying the stock. +180/+123 Breakout at the 20-MA. Stop $169.53.
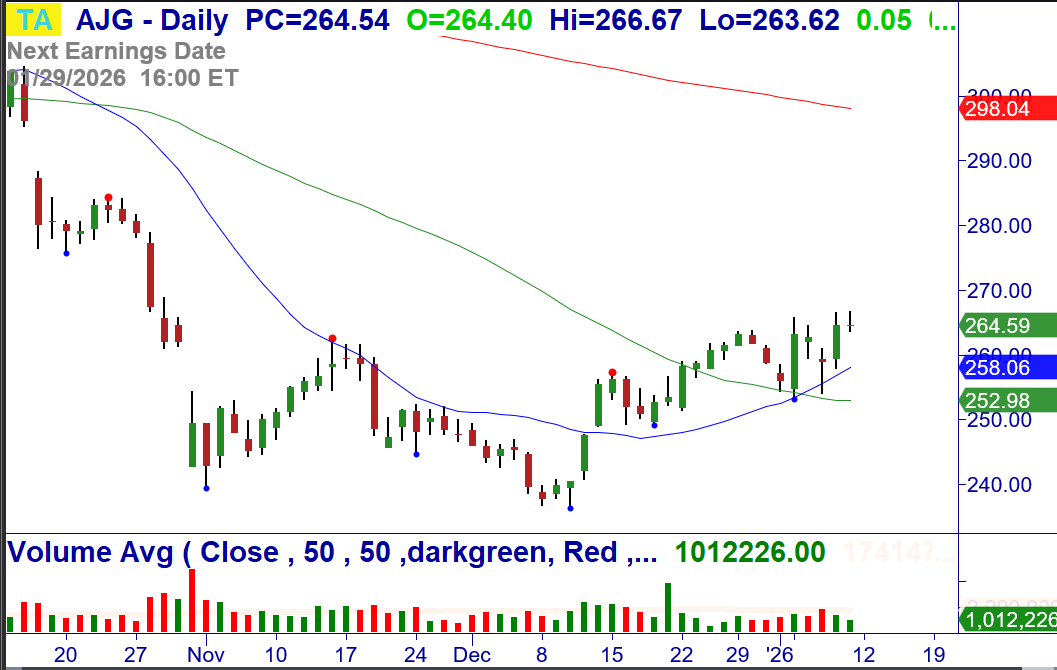
1/12: AJG – Over $266.67, consider buying the stock. +123 Breakout of a bottoming pattern at the 20/50-MA. Stop $257.98.
Money Management for Trading and Investing
Proper money management for investing and Trading starts with position-sizing based on the amount of money you are willing to risk on a signal trade.
CLICK HERE to review these Master Trader Guidelines and Basic Money Management and Position Sizing Table.
NEW OPTIONS TRADING IDEAS
Directional Options Strategies and Debit Spreads for Swing Trading (See the Weekly Options Trader letter, which sells options/spreads for weekly Income that primarily expire in 10 days or less, CLICK HERE)
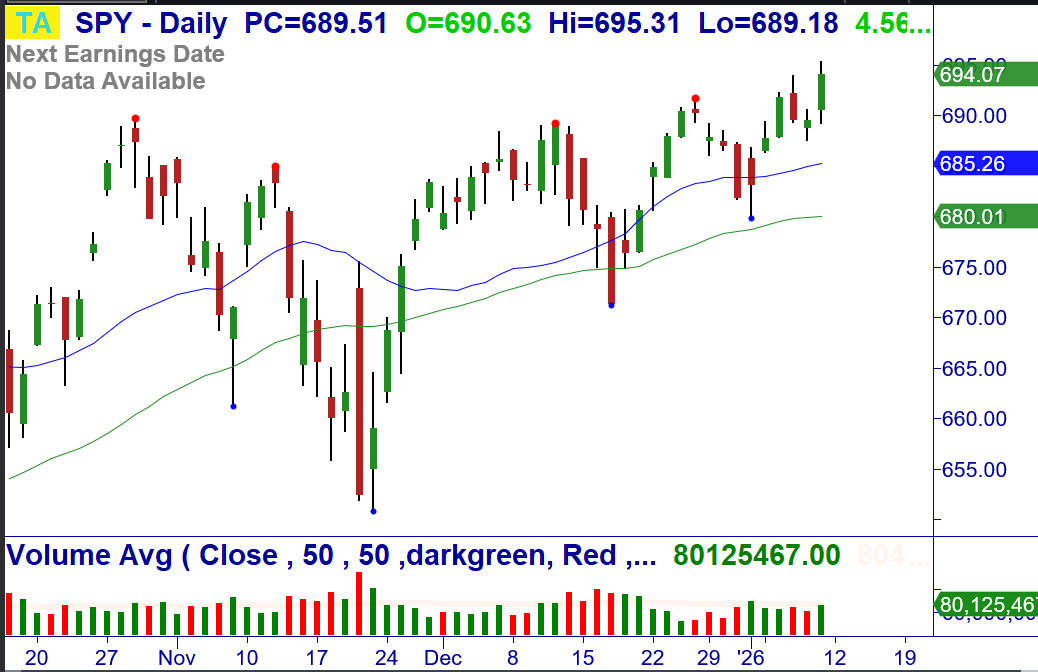
1/12: SPY – Over $695.31, consider buying Jan (1/16) $695 calls for mid-point (closed at $3.44/share). +WRB Breakout to all-time highs. Stop 688.98.
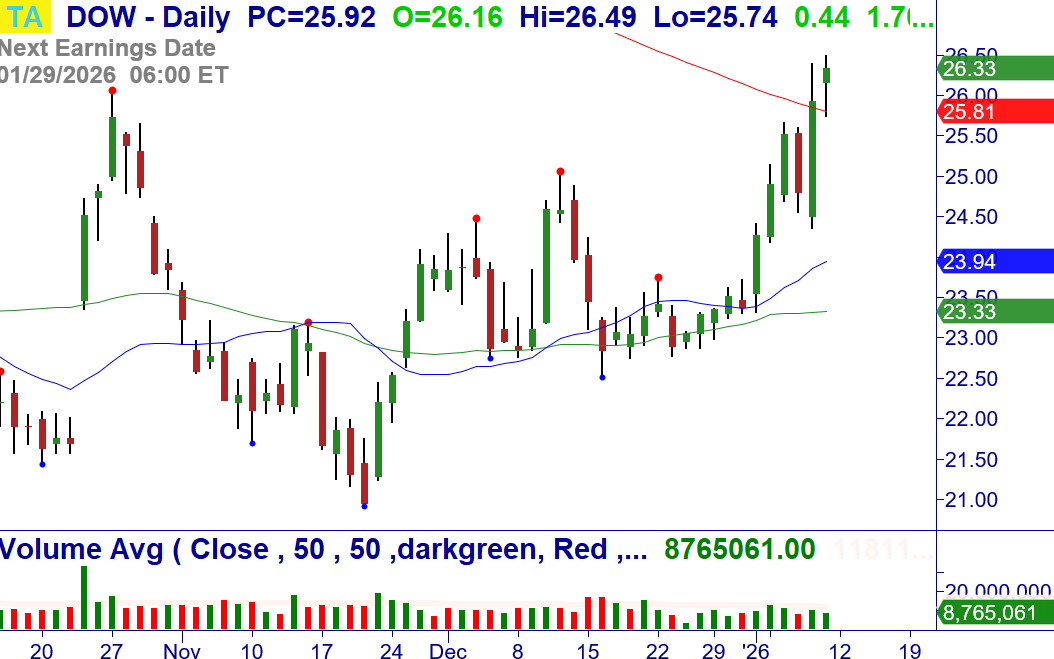
1/12: DOW – Over $26.49, consider buying Jan (1/23) $25.5 calls for a limit of $1.42/share (closed at $1.32/share). Bullish +123 after Bear Sandwich Breakout at the 200-MA, Breakout weekly/monthly. Stop $24.88.
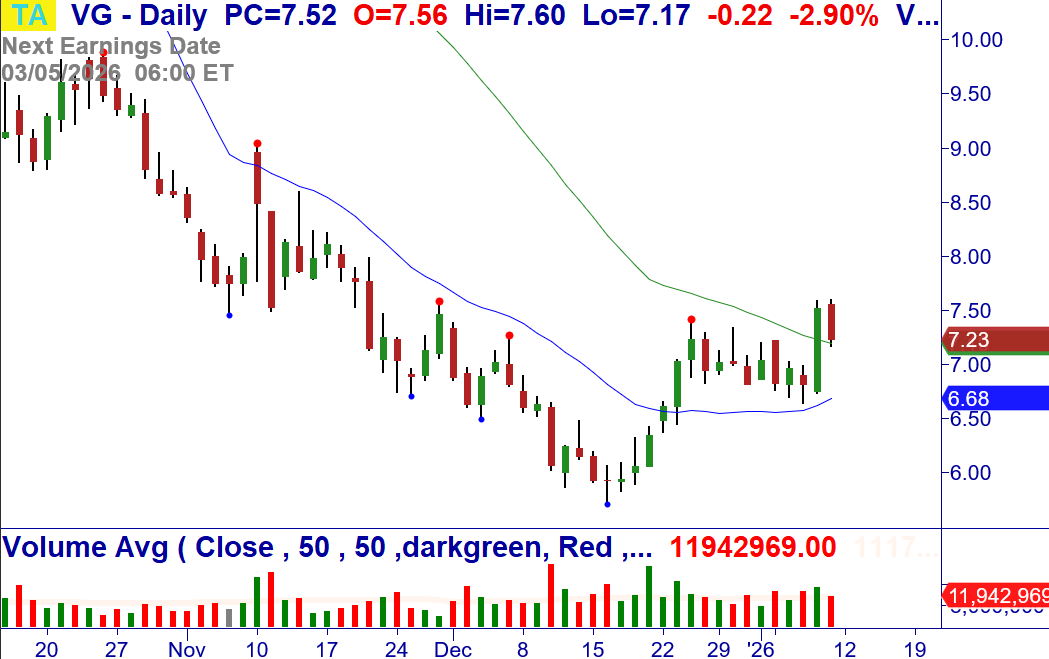
1/12: VG – Over $7.60, consider buying Jan (1/16) $7 calls for a limit of $.65/share (closed at $.35/share). Bullish +123 after +WRB Breakout at the 50-MA. Stop $6.84.
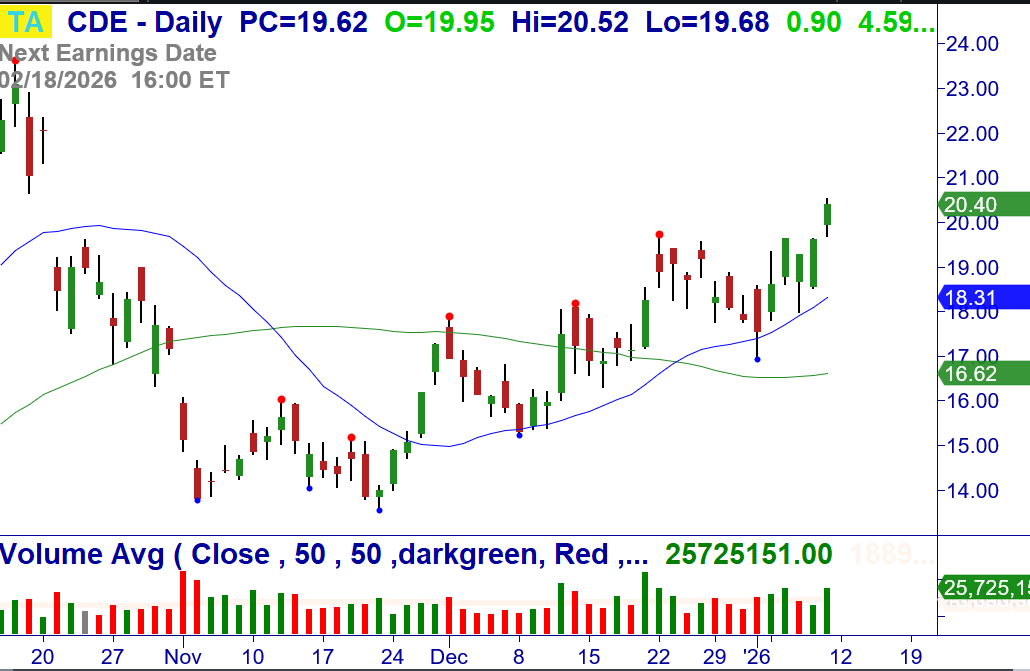
1/12: CDE – Over $20.53, consider buying Jan (1/16) $19.5 calls for a limit of $1.50/share (closed at $1.40/share). +Gap Breakout at the 20-MA, bullish weekly/monthly and sector. Stop $19.08.
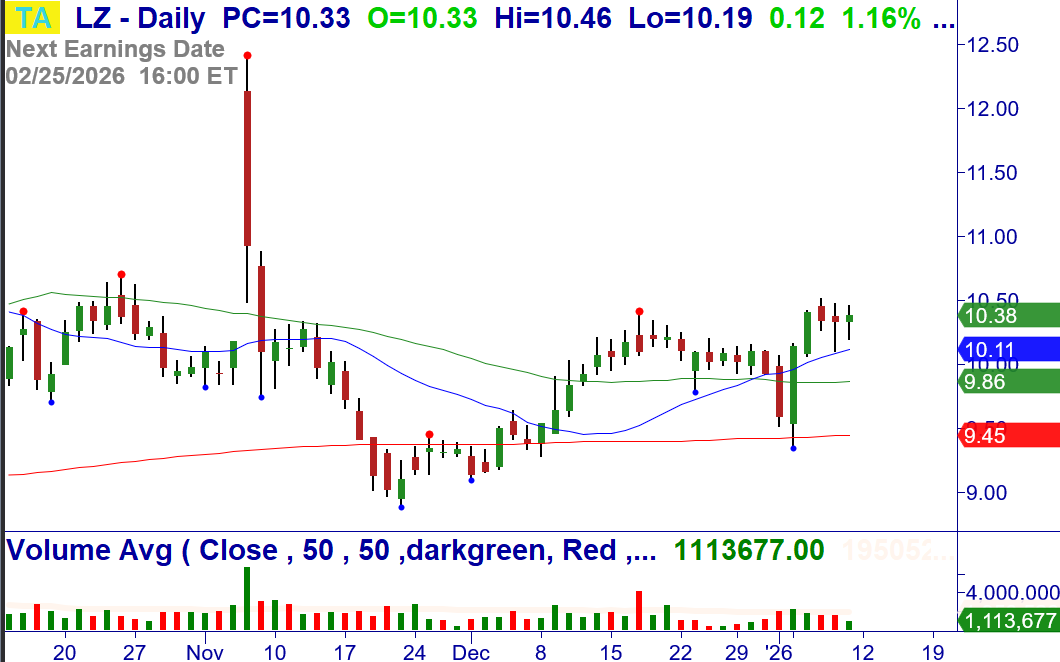
1/12: LZ – Over $10.51, consider buying Jan (1/16) $10 calls for a limit of $.55/share (closed at $.48/share). Continuation Breakout at the 20-MA. Stop $10.08.
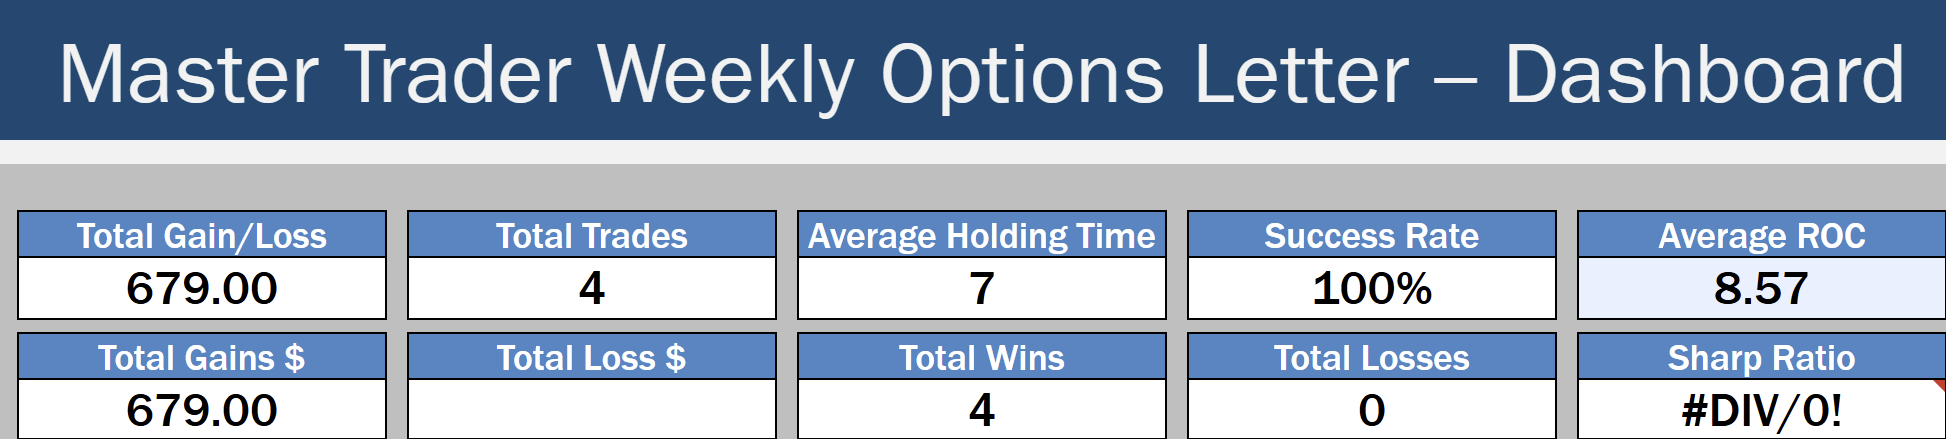
The Master Trader approach to selling credit spreads around technical turning points.
Read about the Weekly Options Trader letter, which sells options/spreads for weekly Income that primarily expire in 10 days or less, around Master Trader technical turning points, CLICK HERE
By selling spreads on stocks and ETFs where MTS indicates price is unlikely to go, we become the “smart money,” getting paid to take calculated, well-defined risk.
Check out the blog article with more information and monthly results, CLICK HERE
Professional consistency, short-duration trades, and risk-controlled income — that’s what defines the Master Trader approach.
Master Trader Holiday Sale: Courses, Memberships & More
Special deals for traders and investors of every level — enjoy savings that pay off all year long, CLICK HERE
Because your success is vital to you – and us.
Before selling options or credit spreads, we urge you to review the valuable and detailed information that we have provided for you in your Member’s Area Resources.
A quick simplified approach to calculating contract size is to simply base your contract size based on the number of shares permitted in your Trading Plan as if you were trading the stock or ETF. Simple Share Sizing = $ Risk / Stop Loss
The amount of money that you are willing to risk – divided by – the stop loss amount. For example, $100 / .20 = 500 shares. Credit Spread example, if your Trading Plan allowed you to trade 543 shares of AAPL based on the stop loss, then simply round down to the nearest hundred and short an equivalent number of contracts of the option. Since 1 contract represents 100 shares of the underlying, this would be five (5) contracts.
Master Trader and You Building Your Financial Future Together!
Good trading!
If you have any questions or comments, please e-mail Greg Capra at Greg@mastertrader.com or Dan Gibby at Dan@mastertrader.com
All the best,
Greg Capra Managing Director of Master Trader
Dan Gibby Chief Options Strategist
NOTE: Master Trader will show the opening and closing prices of all stock and options trades. We recommend that all traders and investors use proper share sizing for positions and money management. However, we cannot recommend what that is for your particular trading style, risk tolerance, or account balance. We urge you to calculate your own share/position size based on your individualized risk parameters, Trading Plan, and familiarity with the proposed trade strategy and risk. Advanced Management Strategies (AMS) covers in detail foundation and advanced position and money management.
NOTE: Master Trader and its representatives may have existing positions in actual or other trade recommendations before or after suggested herein. Additionally, we may manage them differently for internal purposes based on different risk parameters than noted herein. All trade ideas and content are for informational and educational purposes only. It is not, nor is it intended to be, trading or investment advice or a recommendation that any security, option, or investment strategy is suitable for any person. Trading securities can involve high risk and the loss of any funds. Significant gaps or volatility can increase these losses, particularly for short option strategies. Investment or trading information provided may not be appropriate for all investors, and is provided without respect to individual financial sophistication, financial situation, investing time horizon or risk tolerance. Supporting documentation for any claims (including claims made on behalf of options programs), comparison, statistics, or other technical data, if applicable, will be supplied upon request. Master Trader Consulting, Inc. is not a licensed financial advisor, registered investment advisor, or a registered broker-dealer. Options, futures, and futures options are not suitable for all investors.

