In this Chart of the Week, I’ll show you the same stock in two different time frames. .
The charts are sending different messages, but those messages may be starting to come together.
This is one of the most important lessons in Multiple Time Frame Analysis: two time frames can disagree without either one being wrong. Each chart reflects a different holding period, entry point, and risk-management plan.
The Daily Chart Says Wait
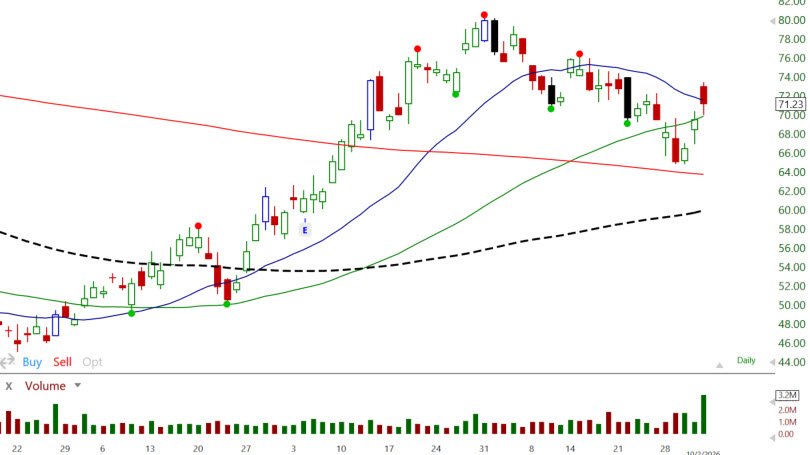
The chart is the daily time frame. It includes the moving averages I regularly use: the 20-, 50-, 100-, and 200-day moving averages. The same as used for the Advisory Swing and Options Trader Letter.
In Master Trader Technical Strategies, moving averages are visual aids. They help us identify trend direction, the strength of a move, and areas where buyers or sellers may become active. However, price action always comes first.
The daily chart shows that the prior uptrend has transitioned into a correction. The latest advance from the declining 200-day moving average was stronger than the previous attempts to turn higher, a positive sign.
However, price has now reached the declining 20-day moving average. It also gapped into that area and closed below its opening price, creating a bearish reversal at resistance.
Based on the daily chart alone, this is not a swing-trade entry. Buying directly into resistance after a bearish reversal would offer poor timing and an unattractive reward-to-risk relationship.
The daily message is simple: wait.
The Weekly Chart Shows a Potential Buy Setup
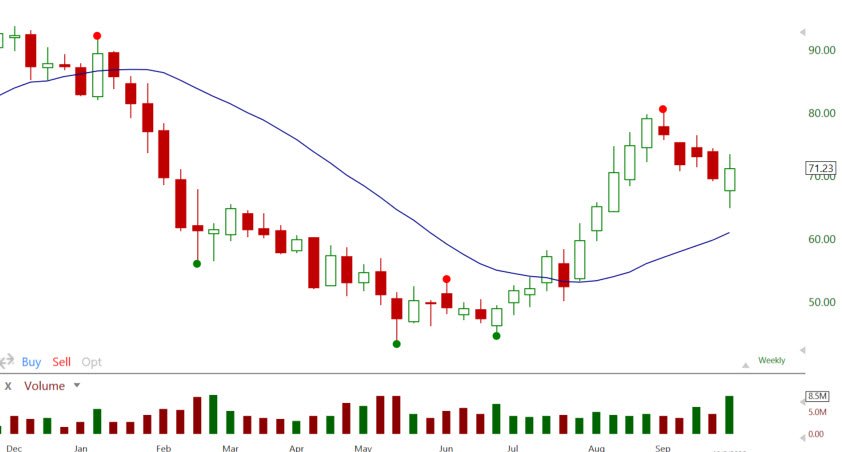
The chart displays the same price data on the weekly time frame.
Here, we see a strong advance toward $80, followed by a controlled pullback. The latest week formed a bullish reversal after testing the lower part of the correction.
This is a basic historical buy setup that I have used for decades. Additional MTS concepts can help us evaluate its quality, but the basic pattern is clear: a strong advance, an orderly retracement, and a bullish reversal.
However, a bullish pattern is not automatically a buy.
Under MTS, a long setup must provide price confirmation. At a minimum, price must trade above the high of a prior bar. For this weekly setup, the trigger would be above the high of the bullish reversal bar.
That confirmation requires paying a slightly higher price, but it has kept us out of many trades that would have become losers. We are not trying to buy at the lowest possible price.
We want evidence that buyers are taking control.
Let's look at them together - Which Time Frame Is Correct
The daily chart says not to buy yet, while the weekly chart is developing a potential buy setup. How do we reconcile that conflict?
The simple answer is to trade the time frame that matches your intended holding period.
A trader using the weekly chart could enter above the bullish reversal bar’s high and place a stop below that bar’s low. Because the weekly stop is wider, the trader would buy fewer shares so total dollar risk stays within the predetermined trading plan.
A swing trader using the daily chart would wait. Price is at resistance, the 20-day moving average is declining, and the latest daily bar is a bearish reversal. The daily trader needs another pattern and another signal.
Both approaches can be correct because they represent different trade plans.
The Deeper MTS Explanation
The weekly chart doesn't tell us price must move higher immediately. It tells us that a potentially bullish pattern is developing within the weekly time frame.
The daily chart shows what must happen inside that weekly pattern.
The depth and strength of the latest daily advance suggest improving momentum. That strength helped create the bullish reversal visible on the weekly chart. However, price has reached daily resistance, so it may move sideways or pull back before it is ready to advance. Common Sense Analysis.
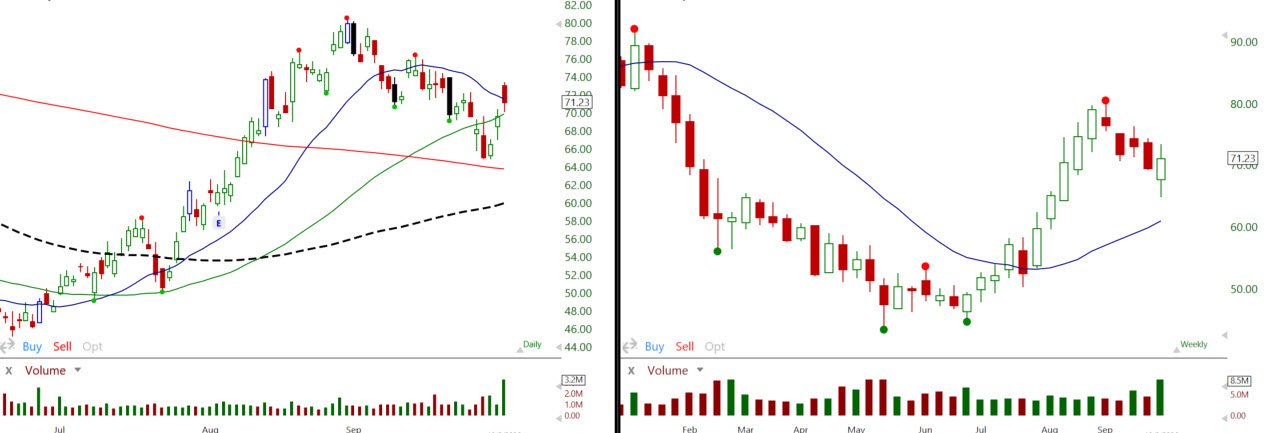
Rather than predicting the next move, we evaluate each new bar as it forms:
- Does price hold above the recent low?
- Does the pullback remain controlled?
- Does a higher low develop?
- Does price consolidate under the declining 20-day moving average?
- Does a bullish bar finally clear resistance?
As the daily pattern develops, the messages from the two time frames may begin to align. If the daily chart forms a new bullish setup and breaks higher while the weekly reversal remains intact, momentum can accelerate because both time frames point in the same direction.
Two Valid Trading Choices
The weekly trader may enter on the next weekly bar if price trades above the reversal bar’s high. That trader accepts a wider stop, reduces the number of shares, and allows more time for the pattern to develop.
The daily trader remains patient. Alerts can be placed near key levels, allowing the trader to move on to other opportunities while waiting for the daily chart to confirm it is ready.
The weekly trader may enter earlier in the larger pattern but must accept more price movement and a wider stop.
The daily trader may enter later, after greater alignment, but may receive a tighter stop and clearer short-term momentum.
Neither approach is automatically better. The right choice depends on your trading style, holding period, account size, and tolerance for price movement.
Learn to Make Objective Trading Decisions
This example shows why technical analysis involves more than identifying a pattern or watching a moving-average crossover. Traders must understand the trend, momentum, location, multiple time frames, entry confirmation, stop placement, and position size.
Master Trader Technical Strategies education teaches you how these concepts work together so you can evaluate stocks, options, ETFs, futures, and other actively traded markets with an objective and repeatable process.
The Master Trader Education bundles combine our focused courses into complete learning paths for technical traders and options traders. You will learn how to recognize high-probability setups, determine when time frames are aligned or conflicting, and structure each trade according to your own planned risk.
The goal is to help you become a self-reliant trader who understands what the charts are communicating—and knows when to act and when to wait.
Learn more about Master Trader Education at MasterTrader.com.