Learn How an objective checklist keeps a bearish idea from becoming an emotional trade
Scanning is not about finding a reason to trade every chart. It is about applying consistent criteria that identify high-probability patterns - and quickly eliminating those that do not qualify.
More...
Not every chart will have every Master Trader concept aligned. At times, a setup can work without perfect alignment. However, the more pieces that support the same conclusion, the greater the probability that the trade will work as expected.
Bloom Energy (BE) provides onsite electricity-generation systems for businesses, data centers, manufacturers, hospitals and utilities.
The stock had been a strong momentum name, but its recent price action raises a different question: Is BE now a high-probability swing short, or merely a stock that has weakened?
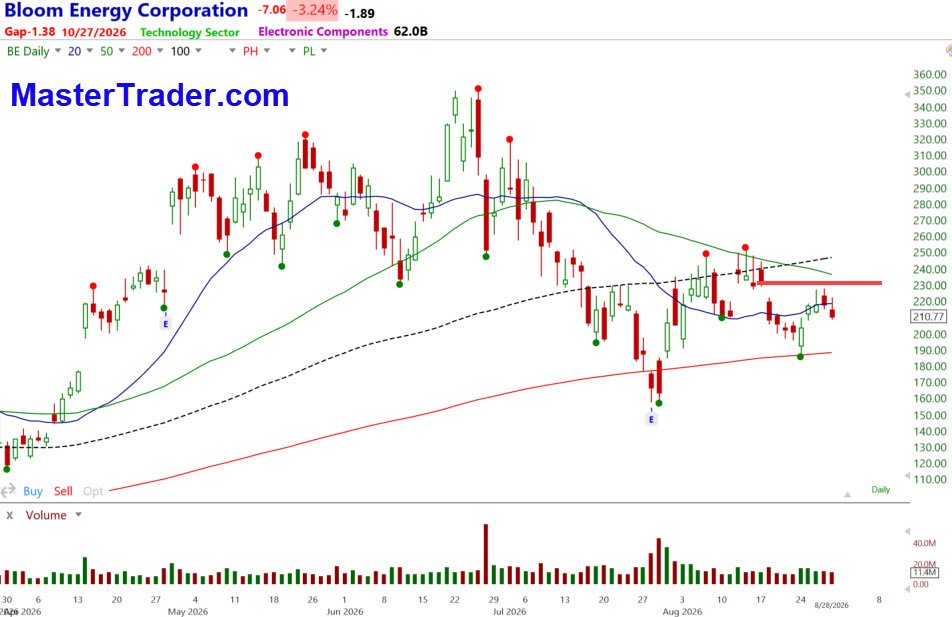
The MTS Checklist for a Swing Short
A high-probability short is more than a red bar or a stock below a moving average. MTS evaluates trend, price location, momentum, support and resistance, multiple time frames, risk and the likely path to the target.
MTS factor | What the BE chart says | Status |
Downtrend | A clean short should show sellers in control through lower pivot highs and lower pivot lows. BE has weakened and broken a prior low, but the daily pivot structure is not yet a textbook series of lower highs and lower lows. | PARTIAL |
Moving averages | The shorter moving averages are rolling over and price is trading beneath them, which is bearish. However, the rising-to-flat 200-MA remains below price and represents longer-term support. | PARTIAL |
Rally into resistance | The rebound has carried BE toward an unfilled gap, a prior breakdown area and the 20-/50-MA zone. That is a logical location for sellers to reappear. | ALIGNED |
Price location | The rally has improved the entry location compared with chasing the initial decline. Still, the prior swing low and 200-MA reduce the open downside path and must be weighed against the stop distance. | PARTIAL |
Momentum and reversal | Momentum slowed as price reached resistance and a bearish reversal began. The turn, however, did not produce a decisive wide-range shock bar or other range expansion that would strongly confirm seller control. | PARTIAL |
Multiple time frames | The weekly chart is not included here. Without the higher timeframe, we cannot confirm a bearish trend or determine whether major support is directly below the daily setup. | NOT CONFIRMED |
Objective stop | A stop can be defined above the recent swing high and resistance zone. The stop belongs beyond the price structure that would invalidate the bearish idea - not at an arbitrary dollar amount. | ALIGNED |
Downside reference | The first references are the prior swing low and the 200-MA. Price should be reassessed there rather than assuming it will continue through support. | ALIGNED |
Event risk | Earnings, company news and major economic events can produce upside gaps against a short. Confirm the calendar before considering any entry. | REQUIRED |
MTS Conclusion: Bearish Evidence, Incomplete Alignment
The odds favor another decline, but BE does not qualify as a fully aligned, high-probability MTS trend short. The setup is tactical: price has rallied into resistance and begun to turn, while nearby support, the still-rising 200-MA, the absence of a shock bar and the unconfirmed higher timeframe argue for caution.
This example evaluates the daily chart only. Broader-market direction, sector strength or weakness, market internals and the higher timeframe could materially increase or reduce the probability of the trade.
The Same Process Applies Intraday
The time frames change, but the criteria do not. Intraday traders still need trend, price location, momentum, support and resistance, multiple-time-frame agreement, an objective stop and a realistic target. The chart may move faster; the decision-making process should not.
Learn the Complete Master Trader Thought Process
One Chart of the Week can teach a concept. A complete education teaches you how to put all the concepts together. Master Trader Educational Bundles provide structured learning paths designed to help traders evaluate opportunities objectively instead of depending on indicators, opinions or guesswork.
Stop collecting indicators. Start building an objective trading process.
Explore Master Trader Educational Bundles
Master Trader - Educating Tomorrow's Professional Traders and Investors Today
Educational content only. Trading and investing involve risk.