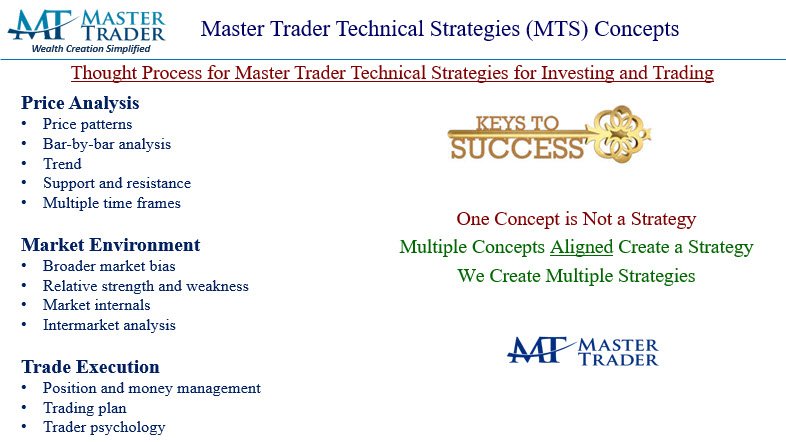
This week’s Chart of the Week covers the foundational concepts behind Master Trader Technical Strategies and how they are combined to create the Master Trader Thought Process.
Our example is Abercrombie & Fitch (ANF).
More...
I cannot cover every MTS concept in one example. However, this chart provides an excellent starting point for understanding how price patterns, trend, support and resistance, moving averages, bar-by-bar analysis, multiple time frames, and risk management work together.
That distinction is important:
One concept is not a strategy. Multiple concepts aligned create a strategy.
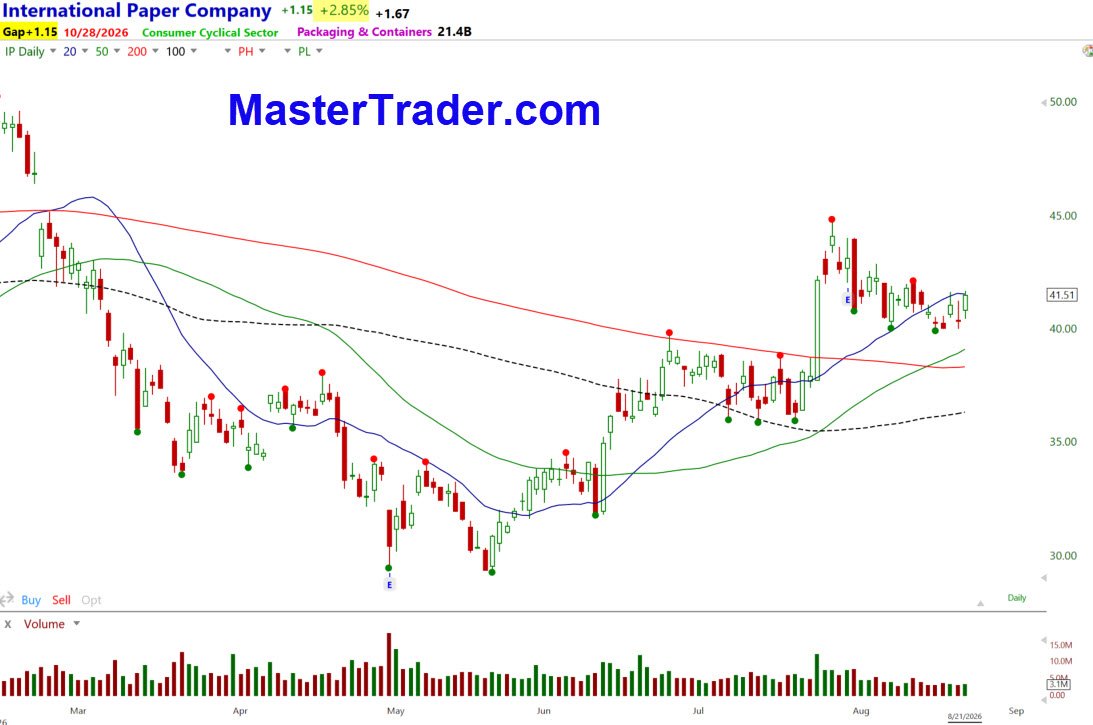
Another example appears near the bottom using IP - not exactly the same - it rarely is.
Begin With the Trend
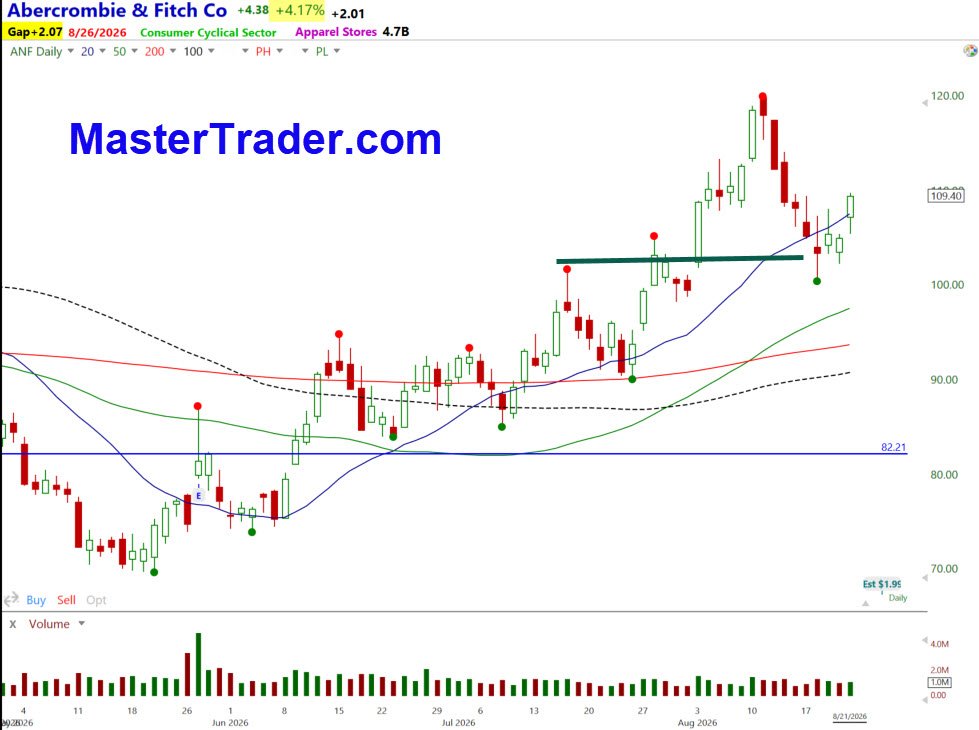
ANF has been forming a series of higher pivot highs and higher pivot lows, which defines an uptrend.
We define a pivot high as a bar with at least three bars with lower highs to its left and three bars with lower highs to its right. A pivot low has at least three bars with higher lows on both sides.
One pivot does not establish a trend. The progression of multiple pivots tells us whether prices are trending higher, trending lower, or moving sideways.
The red and green dots on the chart identify these pivot highs and lows. Since the June low, ANF has established a clear pattern of advancing pivots.
What the Moving Averages Tell Us
The chart includes four moving averages:
- 20-period moving average—blue
- 50-period moving average—green
- 100-period moving average—black
- 200-period moving average—red
The 20-MA is rising at approximately a 45-degree angle, and the 50-MA is also rising beneath it. Prices are trading above both, which supports the intermediate-term bullish trend.
However, the longer-term moving averages are not yet in the ideal arrangement of a mature uptrend.
In a fully aligned uptrend, the moving averages would be positioned:
20 above the 50, 50 above the 100, and 100 above the 200.
In this example, the 100-MA remains below the 200-MA. That tells us ANF previously experienced a significant correction and is still transitioning into a stronger long-term trend. The short- and intermediate-term trend has improved, but the longer-term alignment is not yet complete.
Moving averages should not be viewed as automatic buy or sell signals. They provide visual reference points that help us evaluate trend, momentum, price location, and the maturity of a move.
Support, the Price Void, and the Pullback
At the beginning of August, ANF accelerated sharply higher and created a price void—a rapid advance with relatively little price support established underneath it.
The area from which that acceleration began becomes an important reference point.
Within MTS, we define minor support as a prior high from which prices subsequently move to another higher high. In this case, the area near $100 represents minor support and the approximate origin of the August advance.
ANF then pulled back from approximately $120 into that support area. The pullback also brought prices between the rising 20- and 50-MAs.
This creates technical confluence:
- An established uptrend
- Rising 20- and 50-MAs
- A pullback from a prior high
- Minor price support near $100
- A reversal developing between the 20- and 50-MAs
No single concept creates the setup. The alignment of the concepts is what makes the chart technically interesting.
Reading the Reversal Bar by Bar
Bar-by-bar analysis helps us determine whether momentum is increasing, decreasing, or beginning to shift.
As ANF declined from its August high, the sellers initially controlled the price action. As prices approached $100, the downward momentum began to slow. Bars became less decisive, prices failed to move substantially lower, and buyers began responding near support.
ANF then formed a bullish reversal and turned back above the rising 20-MA.
This suggests buyers are trying to regain control. It does not guarantee that ANF will continue higher, but it provides objective confirmation that the support area is being defended.
The Basic MTS Buy Setup
This is the structure of a basic MTS buy setup:
- Prices are in an uptrend
- The 20- and 50-MAs are rising
- Prices pull back into an area of price support
- The pullback reaches the space between the 20- and 50-MAs
- Selling momentum slows
- A bullish reversal forms
This setup does not tell us exactly how high ANF will go. Based on the uptrend, prices may retest the prior high and potentially form another higher high.
The first obvious resistance reference is the August high near $120. A move above that level would confirm the continuation of the uptrend, while a failure below it could produce a trading range or a deeper correction.
Risk and Position Management
The setup also provides an objective reference point for risk.
The low of the reversal and the minor support area identify where the bullish setup would begin to fail. You can use that reference to determine a stop-loss location.
Once you know the distance between the potential entry and stop, you can calculate share size based on how much money the trader is prepared to risk. This is how technical analysis connects directly to position and money management.
We do not decide how many shares to buy first and then look for a convenient stop. We identify the technical stop and calculate the appropriate share size from that risk.
A Video Review of the chart can be watched here in the MT Education Hub
The Next Steps in the Thought Process
Before considering any trade, we would continue the MTS Thought Process by:
- Reviewing the weekly chart for the longer-term trend and major resistance
- Using a shorter time frame to refine the entry and assess the developing reversal
- Evaluating ANF’s relative strength compared with its sector and the broader market
- Determining the broader market bias
- Checking for upcoming news and earnings
- Creating a complete trading and risk-management plan
ANF is scheduled to report second-quarter results before the market opens on August 26, 2026. Stocks sometimes advance ahead of earnings as institutions anticipate positive results. However, an earnings announcement also creates significant overnight gap risk.
A stop-loss order cannot protect a trader from a large earnings gap. Therefore, the position size, options strategy, or decision to hold through the report must account for that additional risk.
Bringing the MTS Concepts Together
This chart provides a strong foundational structure for studying technical analysis. It shows why the Master Trader Method isn't based on a single candlestick pattern, moving average, indicator, or support level.
The real value comes from understanding how multiple concepts work together:
Trend + Price Location + Support + Moving Averages + Bar-by-Bar Confirmation + Multiple Time Frames + Risk Management
That is the Master Trader Thought Process.
The more consistently you follow that process, the less dependent you become on opinions, predictions, and unnecessary indicators—and the more objective and self-reliant you can become in your trading and investing decisions.
Learn more about Master Trader education and research our comprehensive course bundles:
https://mastertrader.com/trading-education/
Learn the method. Follow the plan. Build the skills to trade with confidence.
Questions? Email Support@mastertrader.com
If you have found this post helpful, Share it Forward with other Traders. All the best Greg Capra