
How MTS and Multiple Time Frame Analysis Turn a Shocking Open into an Objective Plan
More...
An earnings announcement can change a stock’s price in seconds—but it should not change a trader’s discipline.
When Meta Platforms (META) opened almost 11% below the prior day’s close, investors, options traders, and day traders faced very different decisions. Each decision, however, began with the same Master Trader Technical Strategies (MTS) analysis.
Every MTS analysis starts with the price chart and four objective questions:
• What is the trend—up, down, or sideways?
• Where are the next significant areas of support and resistance?
• Is there a Price Void between the current price and the next opposing area?
• Are the relevant time frames aligned, or are they sending conflicting messages?
Only after answering those questions do we select the strategy, define the risk, and determine whether the potential reward justifies the trade. We will also examine what to do when an earnings gap opens beyond a planned stop—when reacting emotionally at the opening bell may be the worst decision.
For this example, assume you were long META going into earnings. You could have been a longer-term investor, an overnight directional speculator, or a day trader waiting to trade the reaction.
The holding period and strategy are different, but the analytical foundation is the same. Let’s apply the MTS thought process.
META Daily Chart—Establishing the Technical Reference Points
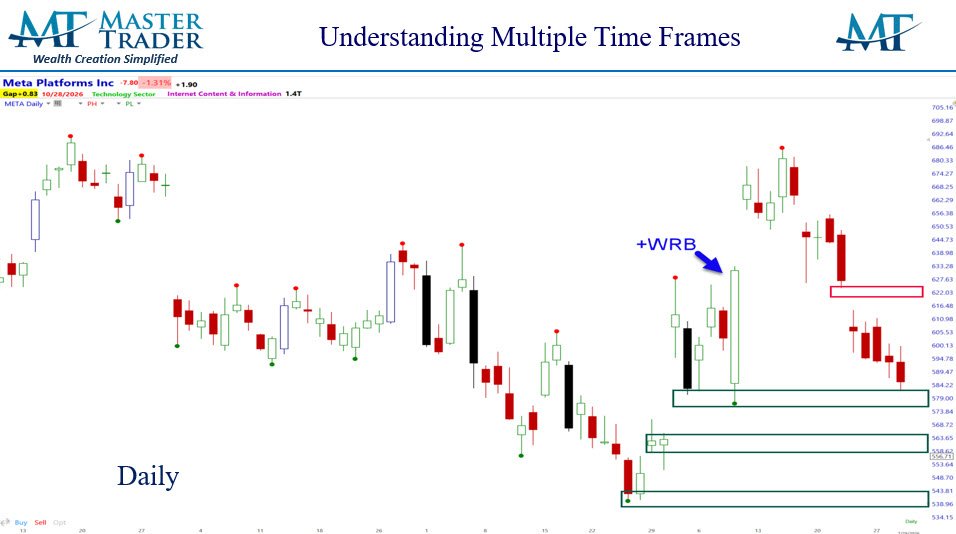
We begin with the daily chart and identify the trend, the price structure, and the nearest meaningful support and resistance.
Before the announcement, META was sitting near an area where buyers had previously produced a sharp reversal and a bullish wide-range bar (+WRB). Buying continued during the following sessions, confirming that institutional demand had been present in that area.
That history made the area important—but support is a location, not a buy signal. Prior buying tells us where demand may return; current price action must tell us whether buyers are actually returning now. Going into earnings, META had not produced a new bullish reversal or other confirmation.
A longer-term investor could decide to hold if the position size and investment plan allowed for earnings-gap risk. The chart also identified lower support areas where buyers might become active if the first area failed. Because META had recently been volatile, those lower levels were not unusually far away in percentage terms.
An investor seeking protection could buy a put. The put acts like insurance, but the protection depends on the strike price, expiration, and number of contracts. If META advanced, the premium paid could be lost; if META declined, the put could offset part or all of the stock loss below the selected strike, less the premium.
An overnight directional trader might buy calls for an upside reaction or puts for a downside reaction. Long options cap the loss at the premium paid, but limited risk does not mean favorable odds. The move still must be large enough—and occur quickly enough—to overcome the elevated option premium.
Implied volatility typically rises before an earnings announcement. That makes options expensive and raises the move required for a long call or put to profit after volatility contracts. Being correct about direction may not be enough if the move was already priced into the option.
A premium seller might consider a defined-risk put spread, call spread, or both sides as an iron condor. The attraction is the post-announcement volatility contraction, but the trade is not simply a bet on volatility falling. Strike selection, distance from support or resistance, credit received, time to expiration, and maximum loss all matter.
Volatility crush helps only while price remains within the spread’s risk parameters. A gap through a short strike can overwhelm the benefit of falling volatility and quickly move a spread toward its maximum loss.
Defined risk and disciplined position sizing are essential before the announcement—not decisions to make after the gap occurs.
The same principle applies to a call spread or iron condor. Earnings trades can offer attractive reward, but they contain event risk that cannot be managed with an ordinary stop while the market is closed. Traders should know the worst-case loss and be financially and emotionally prepared to accept it before entering.
If these strategies are unfamiliar, review Master Trader’s short options-strategy videos before risking capital. Understand the position, the breakeven levels, and the maximum loss—not just the potential credit or profit.
What should the day trader do before the announcement? Nothing. There is no advantage in predicting the reaction when the higher-probability opportunity may come after the news, once the gap location and opening price action can be evaluated.
META Opens—The Gap Changes the Decision
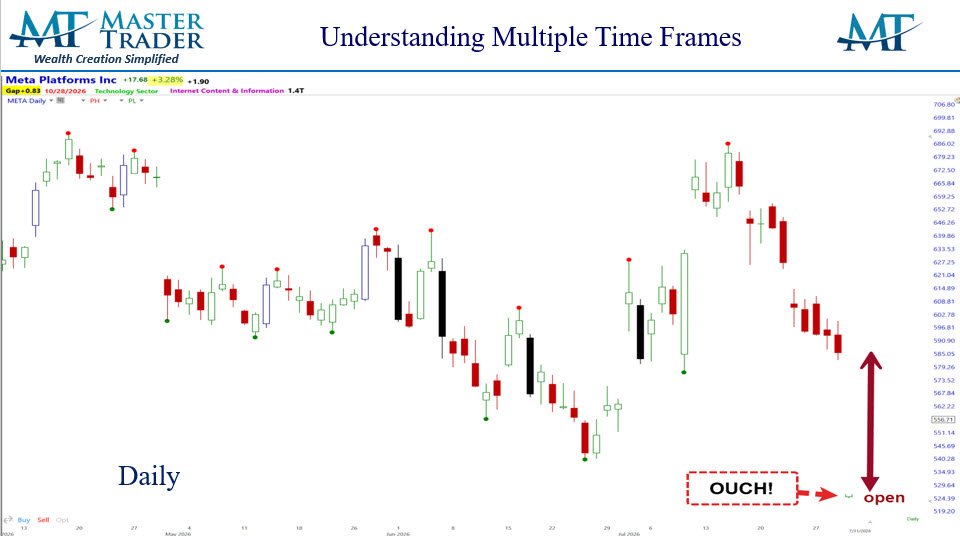
META opened almost 11% below the prior day’s close. The size of the gap was dramatic, but the percentage decline alone did not tell us whether to buy, sell, or stand aside. Location within the larger price structure was the critical information.
For options traders, the result depended on much more than simply calling the direction. The strike prices, expiration, premium paid or received, width of the spread, and magnitude of the gap determined the actual profit or loss.
The call buyer likely lost most or all of the premium. A put buyer could profit if the selected contract captured enough of the decline to overcome the pre-earnings premium and volatility contraction.
A call-spread seller likely benefited, while a put-spread seller faced losses that depended on where META opened relative to the short and long strikes.
If META gapped below a stock trader’s planned stop, blindly selling into the opening imbalance was not automatically the best response. A stop cannot execute while the market is closed, so the trader had to reassess the new information:
Where was major support? Was the gap showing continuation or exhaustion? Did buyers appear after the open? This is not permission to ignore risk. It is a disciplined process for replacing an unusable premarket stop with a clearly defined opening plan and a new maximum-risk level. MTS Thought Process.
Weekly and Daily Charts—Finding Major Support
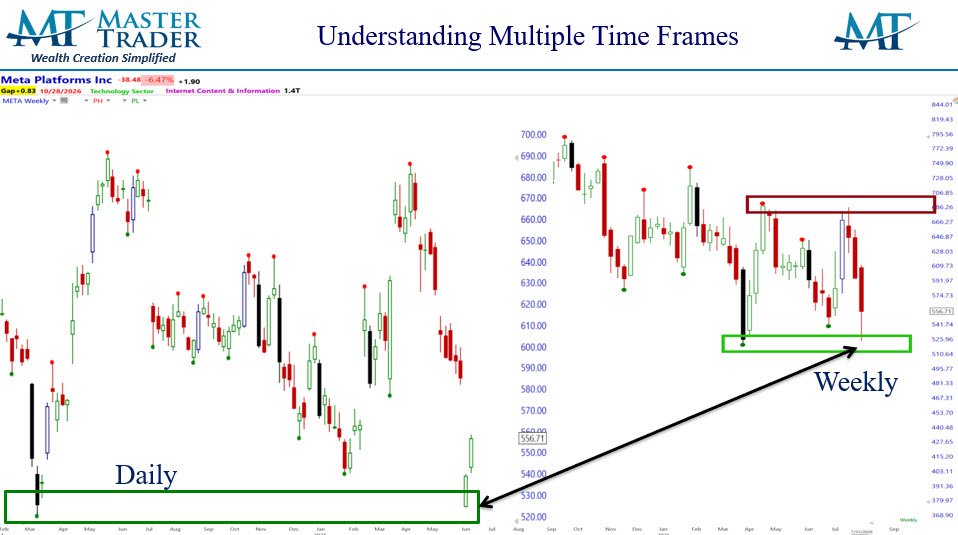
The next step was to move to the weekly chart and look left. The weekly and daily charts together showed META opening directly into an area of major support. MTS teaches us to expect buyers near support, but expectation is not confirmation.
META had declined from resistance near $690 and then gapped almost 11% on bad news into major support. That combination created the possibility of an exhaustion gap: sellers might have temporarily exhausted themselves as fearful holders rushed to exit.
The label could be confirmed only if price stabilized and buyers produced a bullish response. If support failed, the gap could instead become the start of another leg lower.
Five-Minute Chart—Waiting for Buyers to Confirm
MTS day traders allow the first five-minute bar to form after a large opening gap. That pause avoids reacting to the opening imbalance and gives price a chance to reveal whether buyers are willing to defend the higher-time-frame support.
META’s first five-minute bar was a bullish wide-range bar (+WRB). The bar showed an immediate rejection of lower prices and provided an objective reference point: its high for a possible entry and low initial risk.
A long entry above the five-minute high became reasonable only because several pieces aligned: the gap reached major weekly support, the first bar confirmed buying, and the entry had a defined stop slightly below the bar’s low. Before entering, the trader still had to confirm adequate upside room and a favorable reward-to-risk relationship.
META did not advance aggressively. It ground sideways before eventually moving higher. That outcome is an important lesson: a valid setup does not promise an explosive move. Another stock with the same structure might rally sharply; another might fail. The trader’s edge comes from repeating a sound process, controlling position size, honoring the defined risk, and evaluating the result without hindsight.
One Chart—Different Trades, One MTS Process
The investor, options trader, and day trader used different vehicles and held different risk. Yet all three began with the same objective process: define the trend, locate support and resistance, evaluate the Price Void, align the time frames, wait for confirmation when appropriate, and match the strategy to the risk.
Master Trader education teaches this complete thought process—not isolated patterns or another collection of indicators. You learn how MTS, Multiple Time Frame Analysis, position sizing, money management, and trader psychology work together so you can make confident, self-reliant decisions in changing market conditions.
Our Advisory Letters apply this analysis to actionable swing trades, options strategies, and ETF opportunities. If you want to see the process unfold as the market moves, join us in the Master Trader Green Trading Room for real-time analysis, trade planning, and management.
The market will always deliver uncertainty. Your advantage is having a method that tells you what to look for, what must happen before you act, and exactly how much you are willing to risk. Learn the method. Follow the plan. Become a Master Trader. Questions? Greg@mastertrader.com
