In this week’s Chart of the Week, we will review the price structure of Bioventus Inc. (BVS), identify the current pattern, and discuss how the setup could be traded using Master Trader Technical Strategies (MTS). Using the charts below.
Every technical trade begins with a few foundational questions:
More...
- What is the trend?
- Where are support and resistance?
- Is there a price void between the current price and the next significant area?
- Is price approaching demand at support or supply at resistance?
Once those facts are established, we can form an objective bias, determine whether the current pattern offers an entry, and select the appropriate position and money management strategy.
Let’s apply that process to BVS.
The Weekly Price Structure
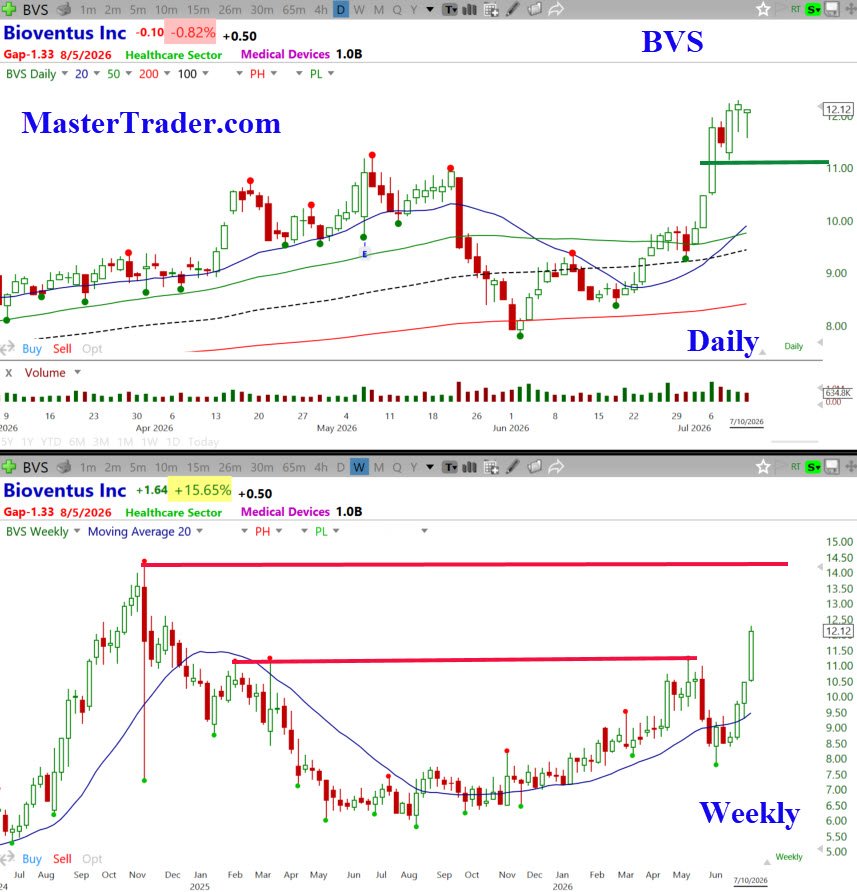
BVS experienced a significant correction after reaching approximately $14.00 in late 2024. The decline continued into 2025, when the stock formed a broad bottom near the $6.00 area.
From that low, BVS began a gradual recovery. The weekly chart shows a developing uptrend, with prices forming higher lows and eventually advancing back toward the prior consolidation near $11.00.
That area represented significant overhead resistance because it was where sellers had previously taken control.
BVS has now broken above that resistance.
The next major weekly resistance area is near the prior high around $14.00. This creates a potential price void between the recent breakout and the old high, assuming the breakout continues to hold.
The Daily Pattern
The daily chart shows that BVS declined sharply during May, along with much of the broader market.
The stock began forming a bottom in June, although there was initially no confirmation that the decline had ended. That changed when prices turned higher near the end of June, reclaimed the moving averages, and began forming higher lows.
After briefly stalling above the moving averages, BVS accelerated higher and broke through the resistance area near $11.00.
It has now formed a tight continuation pattern above that breakout.
Continuation patterns are signs of strength because sellers are unable to produce a meaningful retracement. Even minor declines are being bought, demonstrating continued demand.
However, strength does not guarantee that the pattern will hold. A trader must always consider what to do if the expected move does not occur. Position and Money Management Choices Below.
Additional Chart Concepts are Reviewed Below
The Trading Bias
The current technical bias is bullish as long as BVS remains above the breakout area and the continuation pattern holds.
Ideally, prices will continue higher from the current consolidation and begin moving through the weekly price void toward the prior high near $14.00.
A move below the continuation pattern would weaken the immediate setup. A deeper decline below the breakout area near $11.00 would raise the possibility that the breakout had failed.

Position and Money Management Choices
There is more than one correct way to manage this setup.
An aggressive trader could enter a full position and place a stop below the current continuation pattern. This approach provides greater participation if prices move higher immediately, but it also increases the probability of being stopped out by a typical short-term pullback.
A more conservative trader could begin with one-third or one-half of the intended position and use a wider stop below the breakout area.
Should prices pull back, hold support, and form a new buy setup or higher low, the trader could then add to the position with a newly defined stop.
Both approaches are based on the same bullish expectation. The difference is how much capital is committed initially and how much room the trade is given to develop.
There is no single position management strategy that is right for every trader. The proper choice depends on account size, risk tolerance, trading timeframe, and the trader’s ability to follow the original plan.
The Master Trader Lesson
Price patterns represent the beliefs and expectations of market participants expressed through real money.
The breakout tells us that buyers were willing to pay above the prior resistance area. The continuation pattern tells us that those buyers have not yet been overwhelmed by sellers.
That evidence creates a bullish bias—but the pattern, entry, stop, position size, and management plan must all work together.
That is the difference between simply recognizing a chart pattern and building a complete trading strategy.
We have applied this analysis using daily and weekly timeframes appropriate for swing trading. Traders who want a complete education in trend analysis, price patterns, multiple timeframes, and position and money management should consider the MTS Swing Trading Bundle.
The same foundational analysis can also be applied to intraday trading, gap trading, and shorter-term opportunities through the MTS Intraday Trader Bundle.
Markets will always change.
The skill of reading price action can last a lifetime.
If you have found this post helpful, Share it Forward with other Traders
All the best
Greg Capra