

Some of Last week’s comments were:
For now, the market is not broken, but it is far from comfortable. Internals have improved, but leadership remains narrow. Interest rates eased late in the week, but the trend is not decisively lower. Crude oil broke support, but it needs follow-through.
More...
That remains a fair summary of where things stand.
Over the last month, the markets have been pushed and pulled by sharp news-driven swings, most of them tied to the war in the Middle East, crude oil, interest rates, and expectations for Fed policy.
On Monday, the broader markets gapped sharply higher on news of a deal that could end the war. Crude oil fell, intermediate-term interest rates moved lower, and equities opened with everything in bullish alignment.
However, aside from the Dow, Monday was the high of the week for the major index ETFs — DIA, SPY, QQQ, IWM, and IYT.
Some of that selling may have been simple profit-taking. The markets had made a low the prior week, and Monday’s strong gap was another example of “too far, too fast.” From a technical perspective, the retracement was not surprising.
The news catalyst was Fed Chairman Kevin Warsh’s comments following the Fed's decision to hold the federal funds rate steady at 3.50%–3.75%. While the market had been hoping for signs of an easing bias, his comments did not provide that comfort. Instead, they reinforced the idea that the Fed may remain tighter for longer and that a rate hike is still a possibility if inflationary pressures persist.
We have been reviewing the movement in yields over the last few weeks, and last week brought additional confirmation of what the bond market had already been suggesting. The 13-week yield rose sharply, reflecting pressure in short-term rates.
In other words, short-term rates were already signaling that the market was backing away from the easy-money expectation. Last week, the Fed Chairman’s comments confirmed that shift.
10-Year and 13-Week Yields
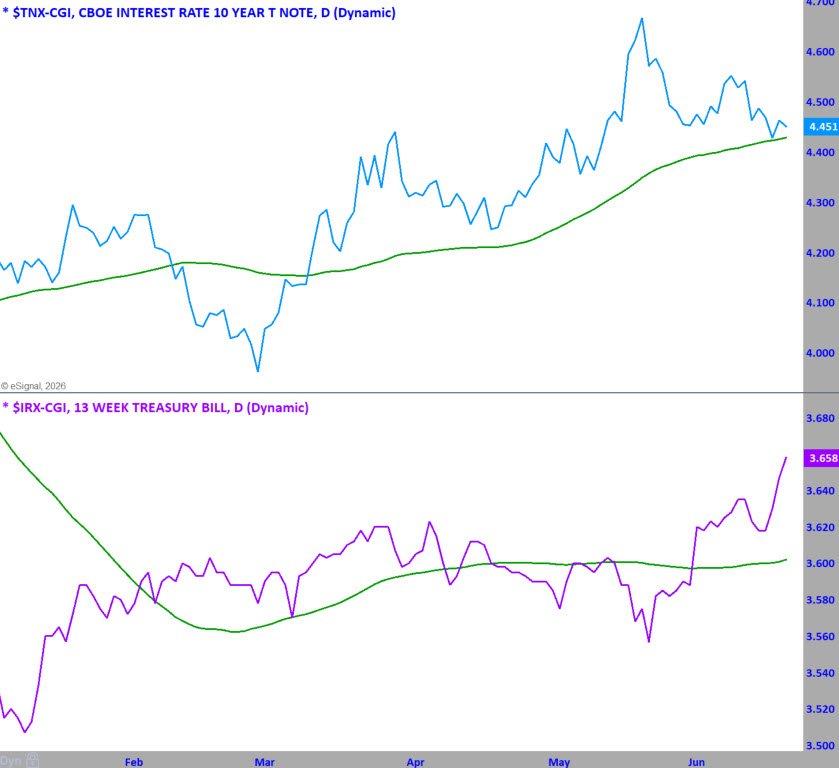
At the same time, the 10-year yield moved lower. As short-term rates rise and intermediate-term rates decline, the yield curve flattens.
The bond market message is not especially equity-friendly. It suggests expectations for slower future growth and potentially less inflation later, but the short-term pressure from higher front-end rates remains a headwind.
That combination — short-term rates rising while the 10-year eases — is not supportive of an aggressive advance in equities. Higher short-term yields also make lower-risk income alternatives more attractive, making them more competitive with stocks.
As has been the case for quite some time, other factors are contributing to erratic price action across many sectors and individual stocks. Last week was also an options expiration week and a holiday-shortened week, both of which may have added to the retracement from Monday’s high.
As we review the charts, you will see that most markets and sectors remain in trading ranges.
The S&P 500 and NASDAQ 100 are near the upper end of their ranges, which is constructive, as deep retracements are bullish. However, last week’s pullback from Monday’s high, followed by Friday’s reversal, creates a less-than-ideal buy setup.
Less-than-ideal does not mean bearish. It means the setup is forming within a trading range, and trading ranges require more patience, tighter risk management, and respect for support and resistance.
There were also positive developments. Financials, Industrials, Home Construction, Small Caps, Mid Caps, and Materials all showed improvement.
Semiconductors continued their advance to new all-time highs, which remains an important positive for the broader market. Healthcare also continued to improve, and the Biotech ETF, XBI, broke out to new highs. Moderna (MRNA) made a significant move higher on news of FDA approval of its vaccine.
So, the market is mixed, but not broken.
Most sectors are still trading in ranges, but if the war ends, crude oil continues to fall, and interest rates continue to decline, that would support equities.
The problem is that uncertainty in the Middle East may not be over.
On Friday, U.S. and Iranian officials were expected to meet in Switzerland to further cement the deal, but the meeting did not take place. Israel and Hezbollah continued fighting, and the meeting was called off.
As of Saturday midday, reports said Iran had announced a closure of the Strait of Hormuz, although confirmation and enforcement remain uncertain.
Markets will have to deal with whatever develops over the weekend. By Monday morning, crude oil, interest rates, and futures should tell us how seriously investors are taking the latest geopolitical headlines.
For now, the key things to watch remain simple:
Do crude oil and interest rates continue to decline?
Do the recent improvements in lagging sectors continue?
Do the leaders hold up while money rotates into areas that have been left behind?
That is what we will focus on as we review the daily charts, weekly charts, and the trend matrix.
S&P Daily Charts
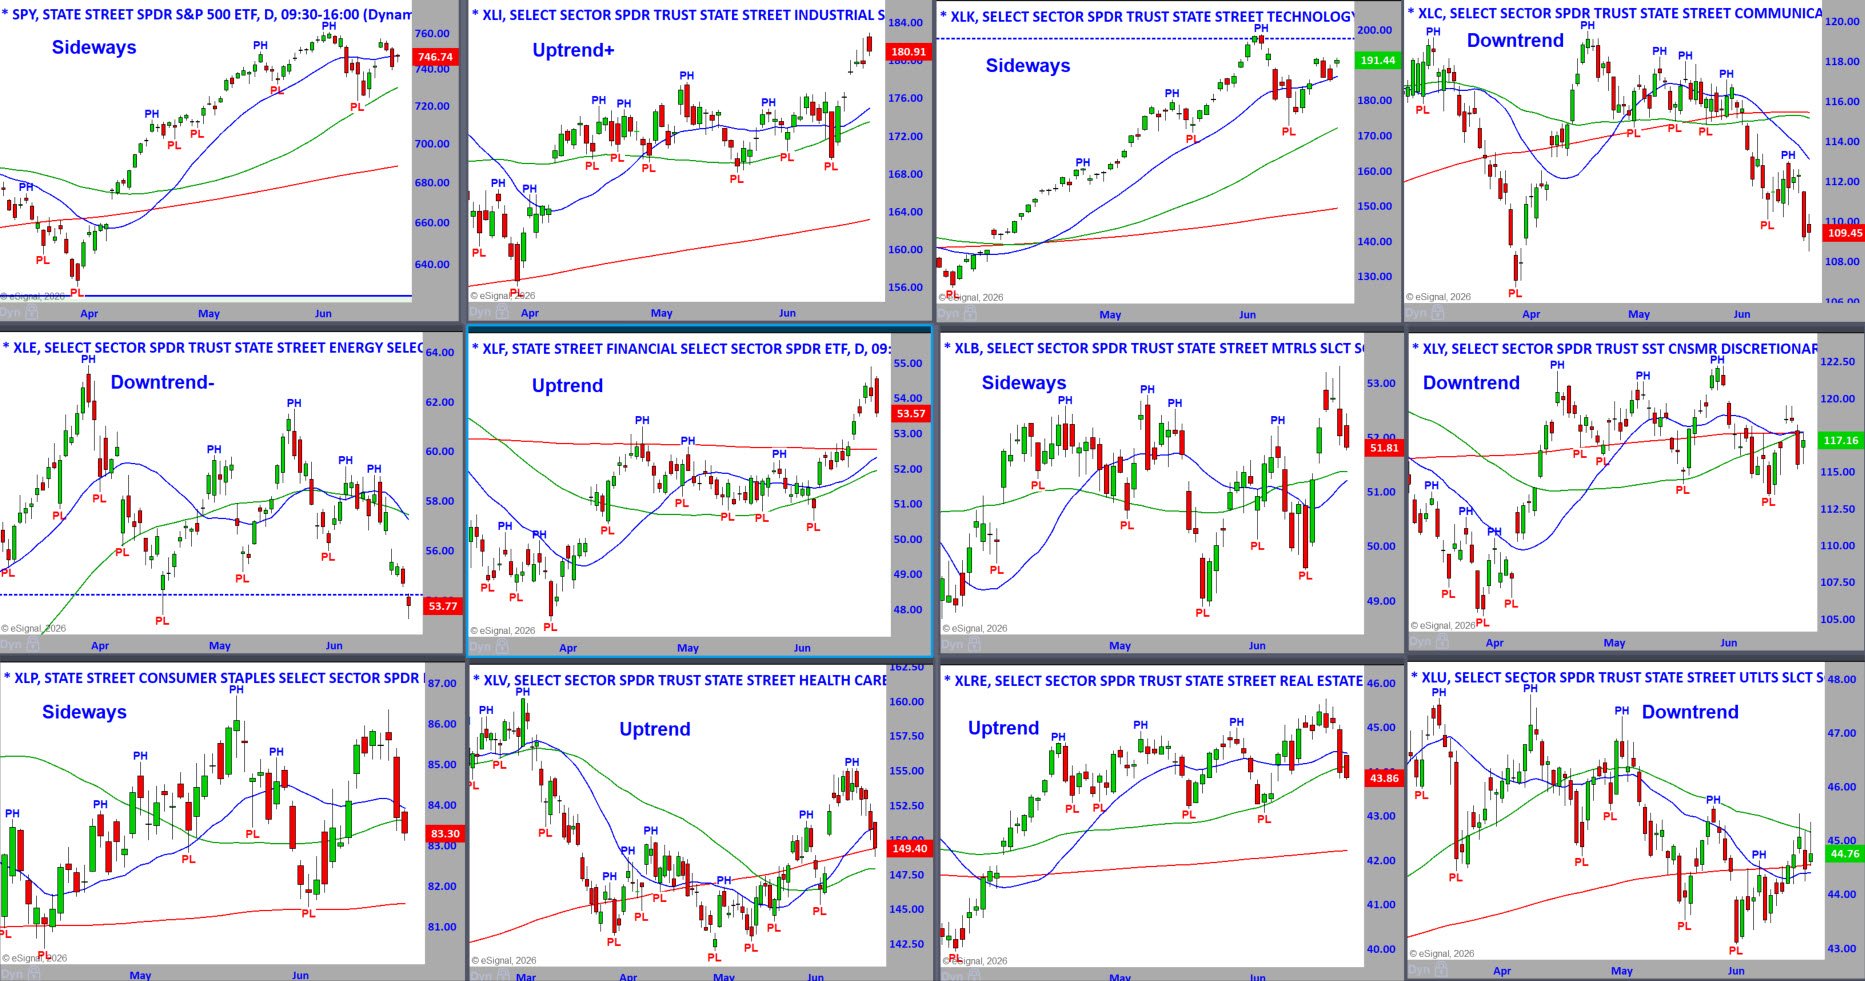
The daily sector charts continue to show a market that is improving in some areas, but still uneven beneath the surface.
The S&P 500 is marked Sideways on the daily timeframe. It pulled back from the recent high, held above the rising 20-MA, and is still above the rising 50-MA. That keeps the index constructive, but not in a clean daily uptrend. A move above the recent Pivot High would be bullish, while a close below the recent Pivot Low would shift the short-term tone more negative.
Industrials remain one of the stronger daily charts. XLI is in an Uptrend+ and is showing relative strength after breaking above the prior trading range. The advance is getting extended short term, so a pause or pullback toward the rising 20-MA would be normal. As long as buyers defend the recent breakout area, this remains a leadership sector.
Technology is still labeled Sideways, even though it remains one of the most important sectors in the market. XLK has not broken down, but it has been unable to push decisively above the recent high. The sector is holding above the rising 20-MA, which is constructive, but the sideways label is appropriate until it clears resistance or violates the recent Pivot Low.
Communication Services remains in a Downtrend. XLC has been one of the weaker areas, with price below the declining 20-MA and 50-MA. The recent bounce failed quickly, and the sector closed weak. That remains a negative divergence versus the broader market and a warning that leadership is not broad.
Energy is also in a Downtrend-. XLE broke below the bottom of its prior range and remains weak. Crude oil weakness may help the broader market from an inflation standpoint, but it is clearly pressuring the Energy sector. Until XLE can reclaim broken support and repair the moving average structure, this remains one of the weakest daily charts.
Financials remain in an Uptrend and continue to show strength. XLF broke out above the recent range and held the move reasonably well. This is an important positive because financials often confirm or question broader market strength. A controlled pullback toward the rising 20-MA would be normal, but a sharp reversal back into the prior range would be a warning.
S&P Weekly Charts
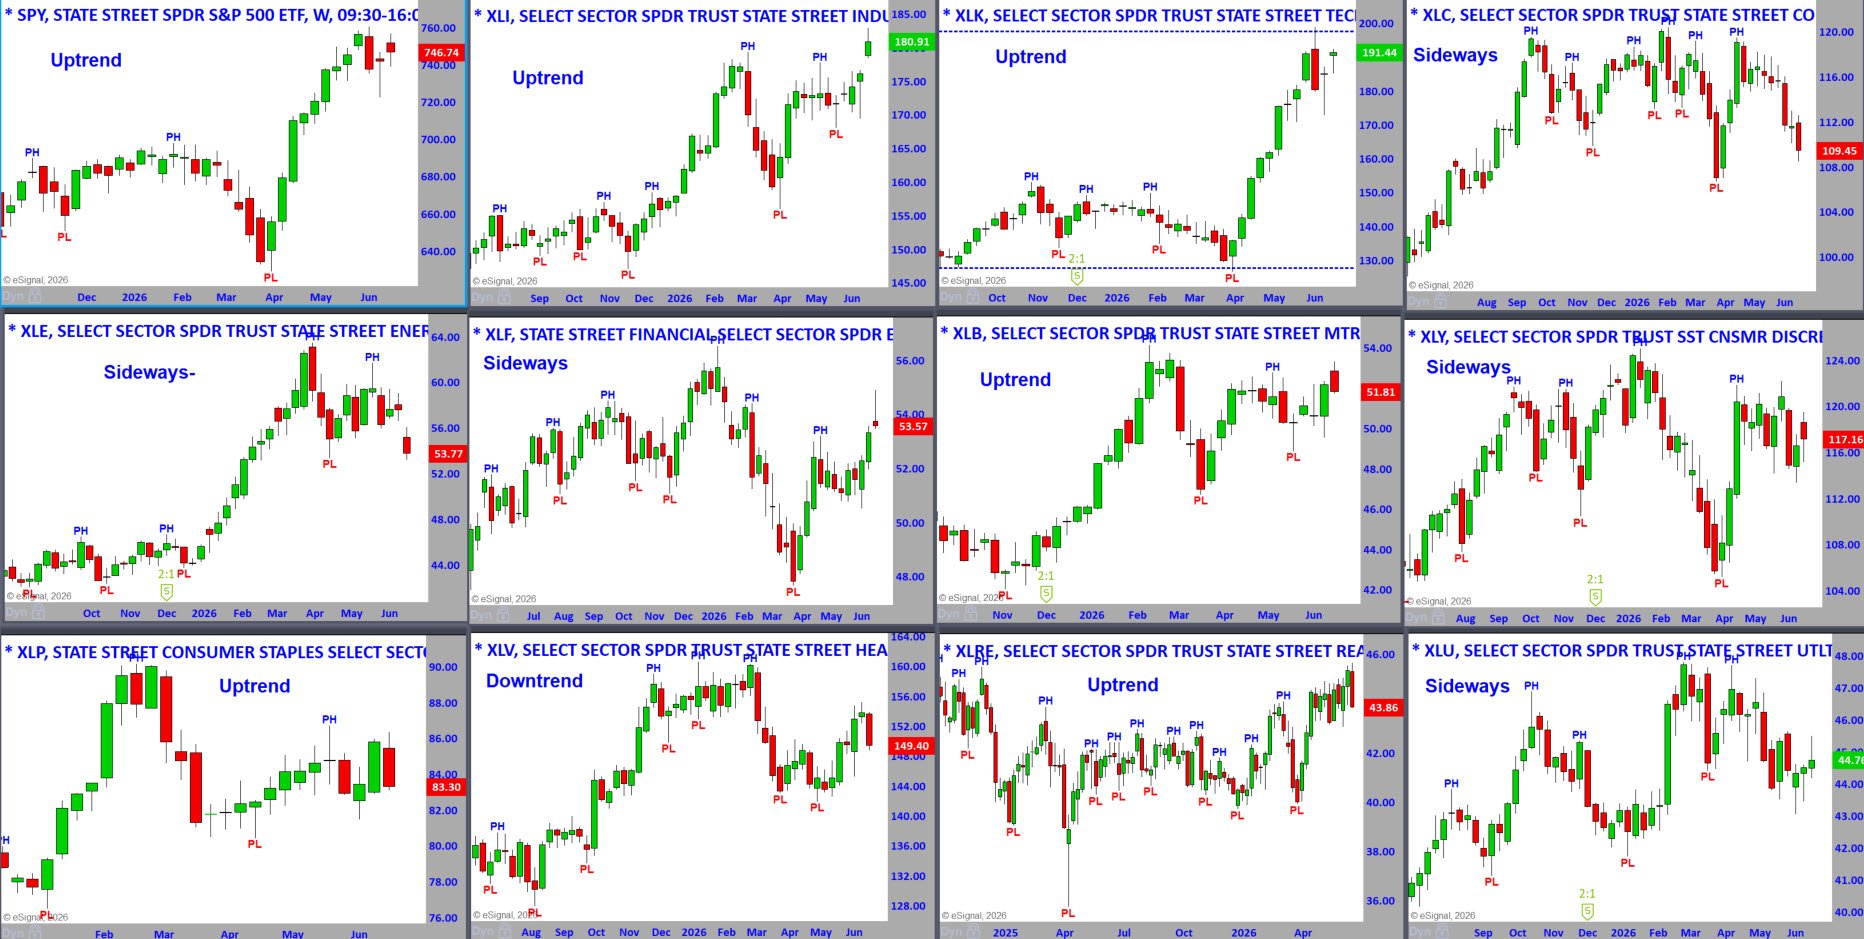
S&P 500 – Uptrend
The S&P 500 remains in a weekly uptrend. Last week pulled back from the recent high, but the broader trend is intact. A move above the recent high would confirm buyers are still in control, while a break below last week’s low would increase short-term caution.
Industrials – Uptrend
Industrials continue to show relative strength. XLI pushed higher last week and remains one of the better weekly charts. The move is getting extended short-term, but the trend remains bullish.
Technology – Uptrend
Technology remains in a strong weekly uptrend. XLK is extended but holding near its highs, with no clear evidence of institutional selling. As long as Technology holds up, it continues to support the broader market.
Communication Services – Sideways
Communication Services remains sideways on the weekly timeframe. XLC has been unable to sustain upside momentum and is now pulling back toward the lower part of its range. This remains a warning that leadership is not broad.
Energy – Sideways-
Energy remains sideways with a negative bias. XLE has weakened from its recent Pivot High and is moving toward the lower part of the weekly range. Lower crude oil may help inflation expectations, but it is pressuring the sector.
Financials – Sideways
Financials are still sideways on the weekly chart. XLF has improved from the April low, but it has not broken out above the prior highs. This is an important sector to watch because broader market rallies are healthier when Financials participate.
Materials – Uptrend
Materials remain in a weekly uptrend. XLB has recovered from the April decline and is holding above the recent weekly Pivot Low. The chart is constructive, but still somewhat choppy.
Consumer Discretionary – Sideways
Consumer Discretionary remains sideways. XLY recovered sharply from the April low, but the last several weeks have been erratic. A move above the recent Pivot High would improve the chart, while a break below the recent Pivot Low would be negative.
Consumer Staples – Uptrend
Consumer Staples remain in a weekly uptrend, but the sector is not acting like a strong leader. XLP has been choppy for several weeks and is still working through resistance. It is constructive, but not powerful.
Healthcare – Downtrend
Healthcare remains the only weekly downtrend. XLV has improved on the daily timeframe, but the weekly chart has not repaired enough to change the trend. If the daily strength continues, the weekly may begin to stabilize, but it is not there yet.
Real Estate – Uptrend
Real Estate remains in a weekly uptrend. XLRE has been one of the more constructive defensive/rate-sensitive areas, though last week’s pullback on the daily chart creates some caution. The weekly trend is still intact.
Utilities – Sideways
Utilities remain sideways on the weekly timeframe. XLU has stabilized after the recent decline, but it has not regained enough strength to become bullish. It needs to clear recent resistance to improve.
Trends and Trend Alignments
Category | Count | ETFs | Comment |
Daily Uptrends | 4 | XLI, XLF, XLV, XLRE | Selective daily leadership, with Industrials, Financials, Healthcare, and Real Estate holding the strongest daily trends. |
Weekly Uptrends | 5 | XLI, XLK, XLB, XLP, XLRE | Weekly charts remain more constructive than daily charts, but not as broadly bullish as we would like. |
Up on Both Daily & Weekly | 2 | XLI, XLRE | Cleanest bullish alignment. Industrials and Real Estate are the best aligned sectors across both timeframes. |
Daily Downtrends | 4 | XLC, XLE, XLY, XLU | Current daily problem areas. Energy and Communication Services are especially weak. |
Weekly Downtrends | 1 | XLV | Healthcare has improved on the daily timeframe, but the weekly trend still needs repair. |
Down on Both Daily & Weekly | 0 | None | No sector is bearish on both timeframes, which keeps the broader market from being broadly bearish. |
Opposite Daily / Weekly Trends | 1 | XLV | Daily Uptrend, Weekly Downtrend. Healthcare is improving in the short term, but the longer-term trend has not been confirmed yet. |
Daily Sideways / Weekly Uptrend | 3 | XLK, XLB, XLP | Weekly trends remain constructive, but daily momentum has stalled. |
Daily Downtrend / Weekly Sideways | 4 | XLC, XLE, XLY, XLU | Daily weakness, but the weekly charts are not fully broken. These are the areas that need improvement. |
Daily Uptrend / Weekly Sideways | 1 | XLF | Financials are improving on the daily chart, but the weekly remains range-bound. |
Bottom line: The weekly picture is still constructive, but the daily trends are mixed. There are only two sectors aligned bullishly across both timeframes, and no sector is bearish in both. That keeps the market from being broadly bearish, but it also shows that leadership is selective. The best alignment is in Industrials and Real Estate, while Technology, Materials, and Staples have constructive weekly charts that need better daily confirmation. The main concerns remain the daily downtrends in Communication Services, Energy, Consumer Discretionary, and Utilities.
Matrix
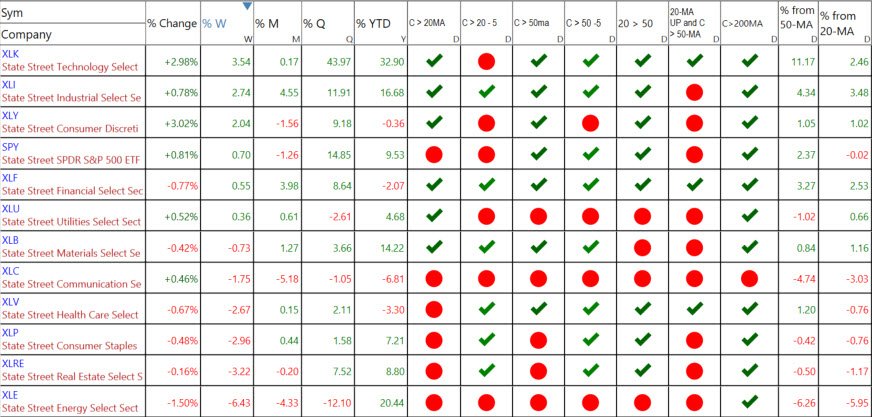
The percentage-change matrix confirms the same message we saw in the charts: improvement beneath the surface, but not a clean risk-on alignment.
The strongest sectors for the week were Materials (XLB +3.30%), Consumer Staples (XLP +2.96%), Technology (XLK +2.66%), Financials (XLF +2.07%), Real Estate (XLRE +1.68%), and Industrials (XLI +1.62%).
That mix is constructive, but not one-dimensional. Materials, Financials, Real Estate, and Industrials improving shows money moving into more economically sensitive areas. At the same time, Consumer Staples near the top of the list shows defensive money has not gone away.
Technology remains the major leader, up 28.57% year-to-date and still 10.14% above its 50-MA. That keeps XLK extended intermediate term. The short-term condition is better, with XLK only 0.57% above its 20-MA.
The matrix also shows that the market has broadened somewhat. XLB, XLP, XLK, XLF, XLRE, XLI, and XLV are all above their 20-, 50-, and 200-MAs. That is a meaningful improvement.
The weak areas remain clear. XLC is below its 20-, 50-, and 200-MAs and remains the weakest sector on the matrix. XLE is below its 20- and 50-MAs, while XLY and XLU are also below their 50-MAs.
SPY being slightly below its 20-MA shows the broader market is not fully repaired yet, even though it remains above the 50- and 200-MAs.
Overall, the matrix improved, but it did not flip fully bullish. The positives are broader participation in Materials, Financials, Real Estate, Industrials, Staples, and Healthcare. The negatives are that SPY is still below the 20-MA, Technology remains extended from the 50-MA, and XLC and XLE remain technically weak.
The market is improving, but still selective. Sector and stock selection remain more important than assuming everything will move together.
Where are the Markets Headed this Week
The market enters the week with a cautiously bullish bias, but not a clean one.
The positives are clear. Several sectors improved last week, including Financials, Industrials, Materials, Real Estate, and Healthcare. That broadening is constructive because it reduces the market’s dependence on Technology. Crude oil also moved lower, and if that continues, it should ease inflation concerns and support equities.
The negatives are also clear. Short-term interest rates moved higher, and that is not supportive of an aggressive equity advance. The internals remain neutral, which means they are not confirming a strong risk-on move, but they are not warning of a major breakdown either.
That leaves the market vulnerable to news-driven movement in either direction.
If crude oil continues lower, interest rates stabilize or decline, and sector rotation broadens, the market can move higher. If crude oil reverses higher, short-term rates continue to rise, or geopolitical headlines worsen, last week’s improvement could be tested quickly.
For now, the message is selectivity. The market has improved enough to support new trade ideas, but not enough to assume everything will move together.
We will continue to focus on the sectors and stocks showing the best alignment across the daily, weekly, and matrix readings, while respecting the risk of another whipsaw in this news-sensitive environment.
Dow Jones
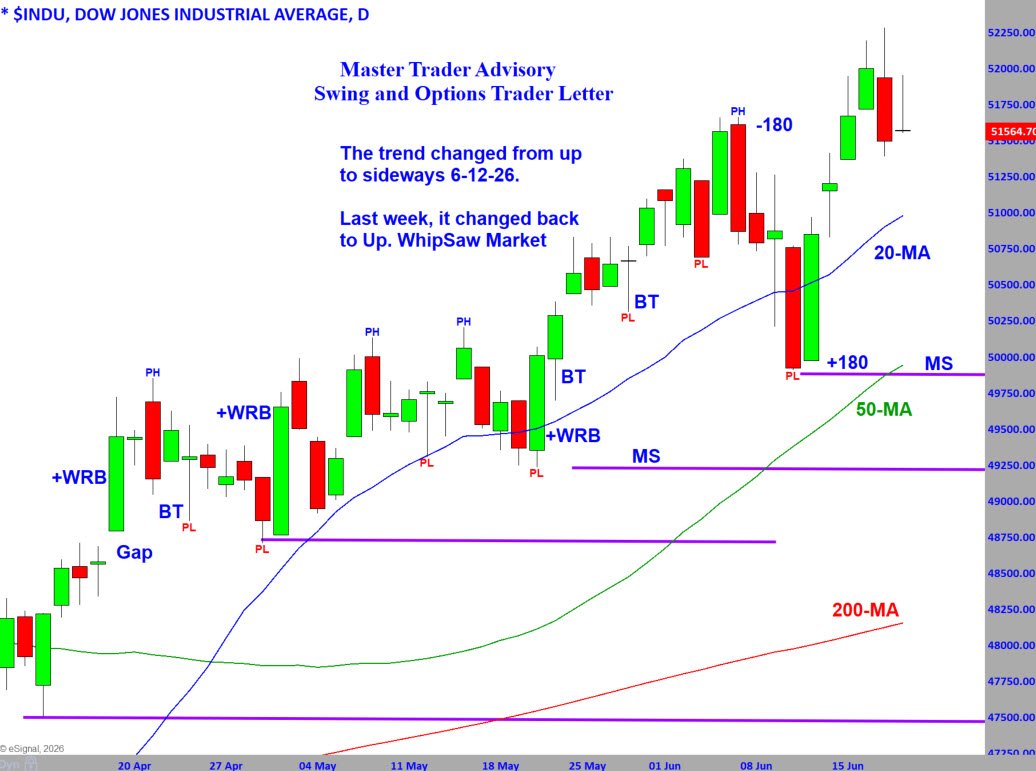
The chart above shows the Dow Jones Industrial Average through the lens of Master Trader Technical Strategies (MTS).
The Dow’s daily trend changed from Up to Sideways on June 12, and then changed back to Up last week. That is the definition of a whipsaw market.
The day-to-day movement has been extreme. Two weeks ago, the Dow broke below Major Support (MS) with a wide-range bar, suggesting sellers had taken control. However, the very next day produced a powerful +180 reversal back above MS and the rising 50-MA. That was the first sign that the break may have been a shakeout rather than the start of a larger decline.
Then, after news that the war may be ending, the Dow gapped and surged to new all-time highs. That move was especially notable because the Dow outperformed the S&P 500 and Nasdaq 100 last week.
However, the advance was not smooth. The Dow reached new highs and then pulled back sharply, leaving another wide-range reversal bar near the top. That keeps the market in a high-volatility environment, even though the trend has shifted back to Up.
The key short-term support is last week’s low and the rising 20-MA. Below that, the higher Major Support area near the 50-MA becomes important. As long as those areas hold, the bullish trend gets the benefit of the doubt.
A move above last week’s high would confirm that buyers remain in control and support further upside. A close below last week’s low would be a warning that the breakout to new highs failed.
The bottom line is that the Dow improved and reclaimed its uptrend, but the path has been anything but comfortable. The trend is bullish again, but the wide-range bars and fast reversals suggest we respect the risk of another whipsaw.
VIDEO REVIEW OF MARKETS, SECTORS, AND INTERNALS - Click lower right to open Full Screen.
NEW STOCK TRADING IDEAS Below
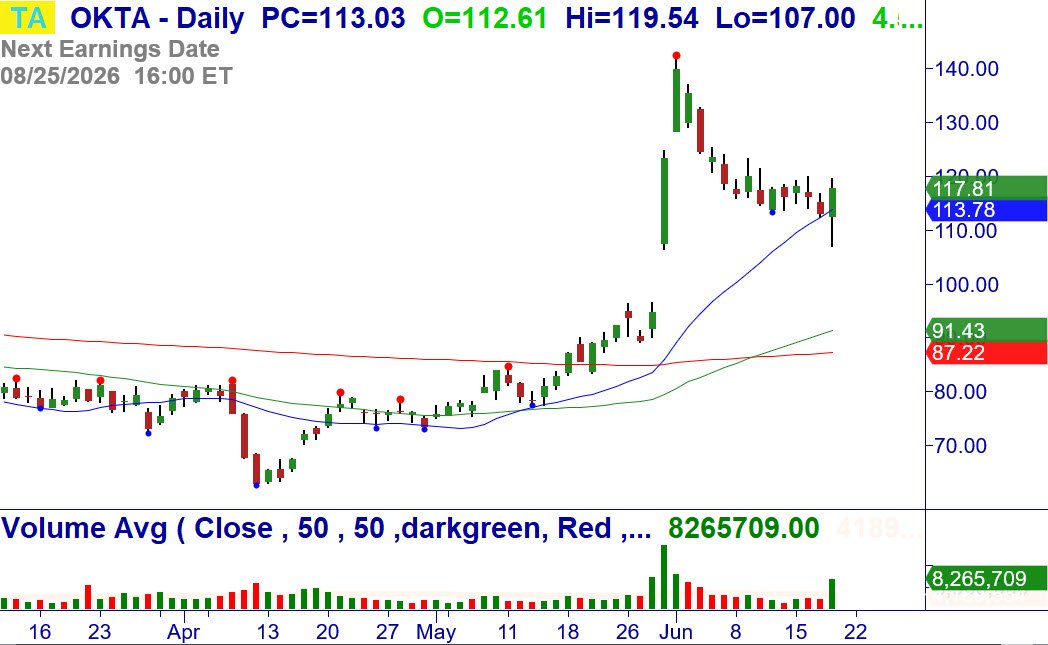
6/22: OKTA – Over $119.55, consider buying a ½ lot of the stock (and ½ over $120.01). Anticipated Breakout after Buy Setup and Breakdown Failure, Buy Setup weekly. Stop $106.88.
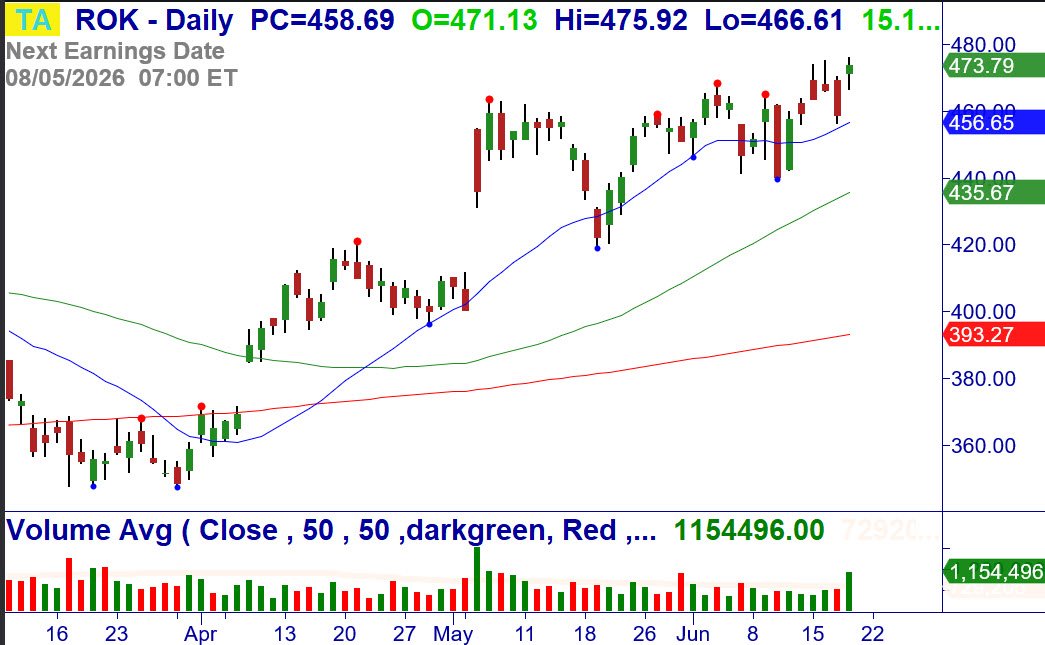
6/22: ROK - Over $475.92, consider buying the stock. Breakout daily/weekly at the 20-MA. Stop $456.18.
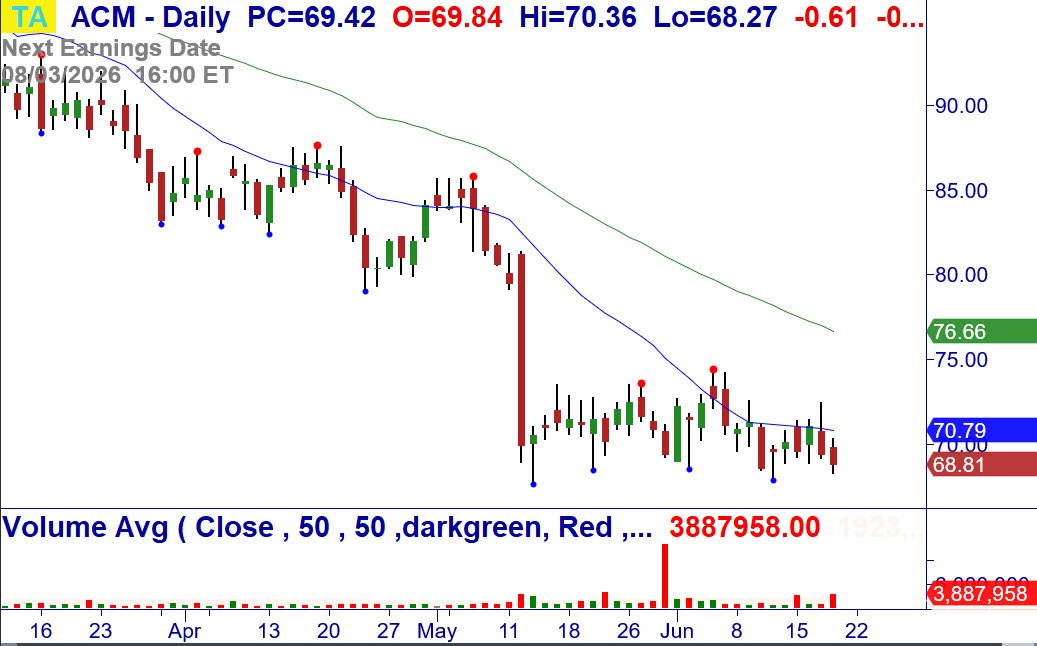
6/22: ACM – Under $67.90, consider shorting the stock. Breakdown daily/weekly. Stop $71.82.
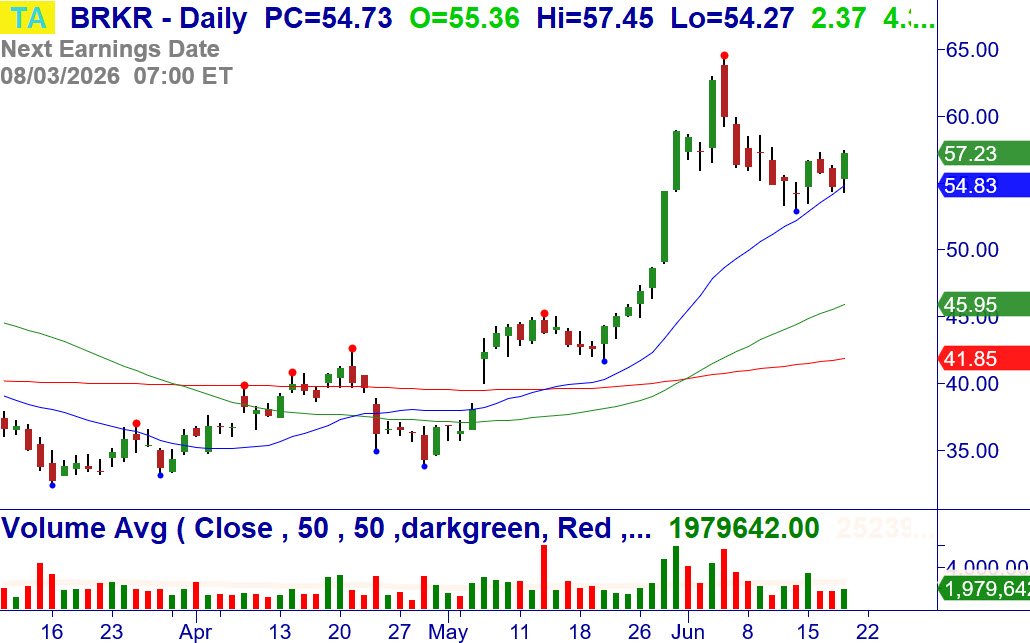
6/22: BRKR – Over $57.49, consider buying the stock. Retest of a Buy Setup and bullish reversal at the 20-MA. Stop $52.88.
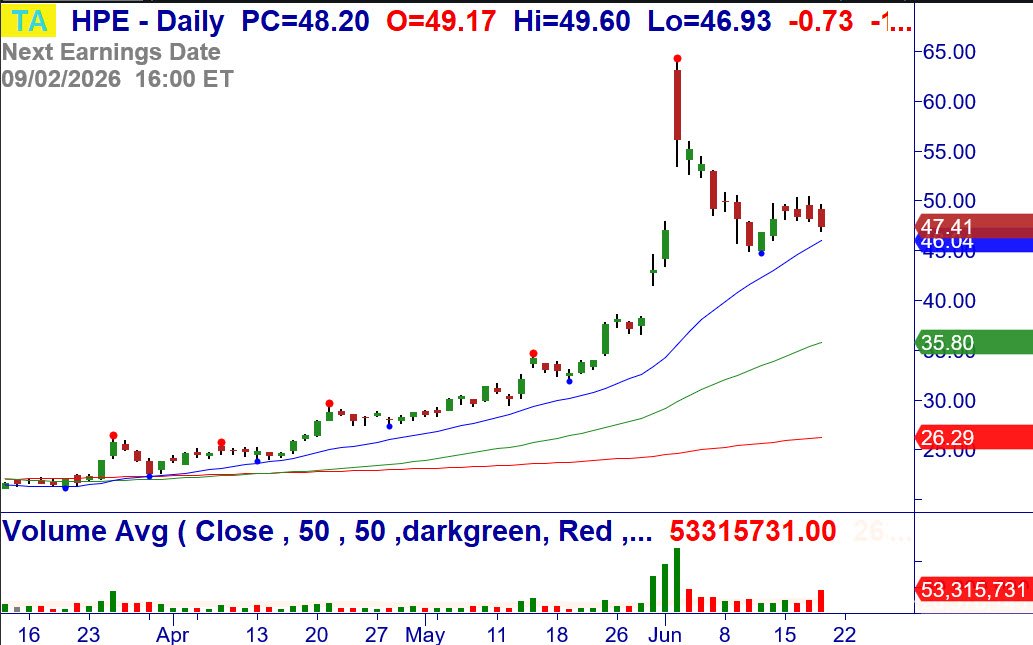
6/22: HPE – Over $50.45, consider buying the stock. Breakout after Buy Setup and reversal at the 20-MA. Stop $45.88.
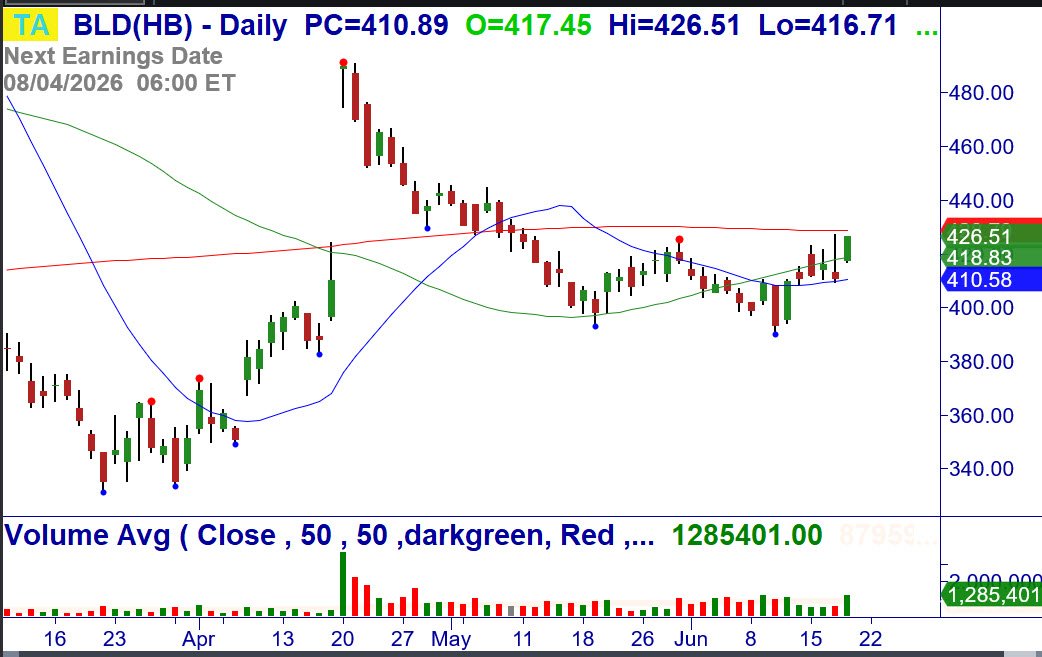
6/22: BLD – Over $427.17, consider buying a ½ lot of the stock. Breakout at the 200-MA after Breakdown Failure, W-Reversal weekly at the 20-MA. Stop $405.88.
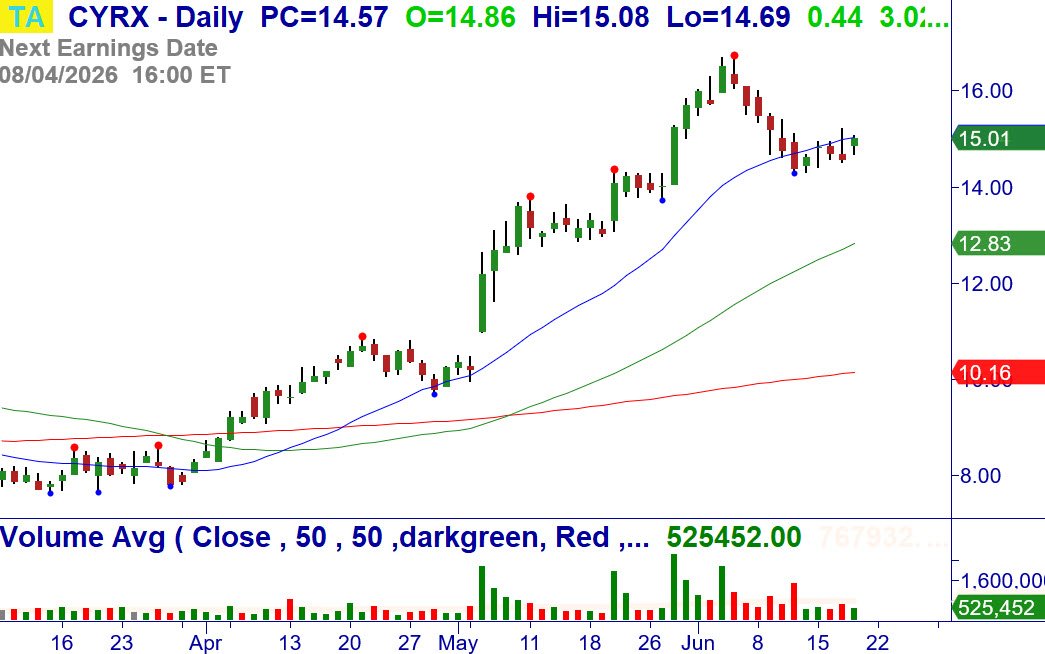
6/22: CYRX – Over $15.22, consider buying the stock. Breakout after Buy Setup and bullish reversal at the 20-MA. Stop $14.28.
NEW OPTIONS TRADING IDEAS
Directional Options Strategies and Debit Spreads for Swing Trading (See the Weekly Options Trader letter, which sells options/spreads for weekly Income that primarily expire in 10 days or less, CLICK HERE)
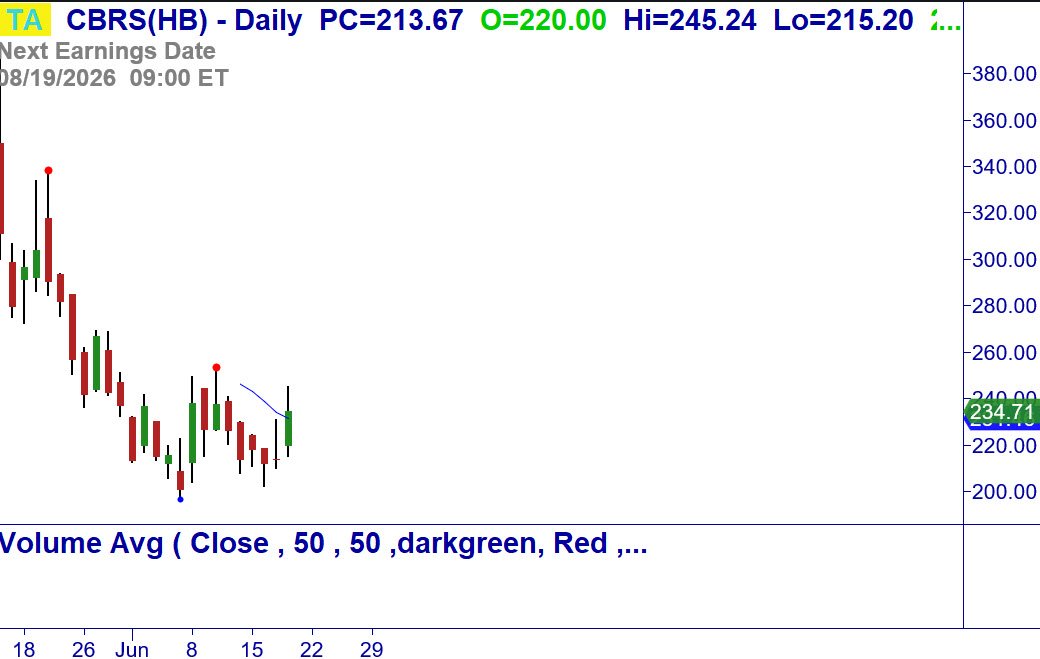
6/22: CBRS – W-Reversal after recent IPO, long stock/call watch.
Master Trader and You Building Your Financial Future Together!
Good trading!
If you have any questions or comments, please e-mail Greg Capra at Greg@mastertrader.com or Dan Gibby at Dan@mastertrader.com
All the best,
Greg Capra Managing Director of Master Trader
Dan Gibby Chief Options Strategist
NOTE: Master Trader will show the opening and closing prices of all stock and options trades. We recommend that all traders and investors use proper share sizing for positions and money management. However, we cannot recommend what that is for your particular trading style, risk tolerance, or account balance. We urge you to calculate your own share/position size based on your individualized risk parameters, Trading Plan, and familiarity with the proposed trade strategy and risk. Advanced Management Strategies (AMS) covers in detail foundation and advanced position and money management.
NOTE: Master Trader and its representatives may have existing positions in actual or other trade recommendations before or after suggested herein. Additionally, we may manage them differently for internal purposes based on different risk parameters than noted herein. All trade ideas and content are for informational and educational purposes only. It is not, nor is it intended to be, trading or investment advice or a recommendation that any security, option, or investment strategy is suitable for any person. Trading securities can involve high risk and the loss of any funds. Significant gaps or volatility can increase these losses, particularly for short option strategies. Investment or trading information provided may not be appropriate for all investors, and is provided without respect to individual financial sophistication, financial situation, investing time horizon or risk tolerance. Supporting documentation for any claims (including claims made on behalf of options programs), comparison, statistics, or other technical data, if applicable, will be supplied upon request. Master Trader Consulting, Inc. is not a licensed financial advisor, registered investment advisor, or a registered broker-dealer. Options, futures, and futures options are not suitable for all investors.