
Comments from the 6-1-26 letter. Last week, crude oil and interest rates both pulled back, and that was exactly what the equity market needed. Lower oil helps reduce inflation pressure. Lower rates help relieve pressure on housing, Consumer Discretionary, growth stocks, and the broader risk appetite. XLK is 21.50% above the 50-MA and 8.61% above the 20-MA, which is extremely extended. The internals are not bearish, but they are not strongly bullish either. They are more neutral.
More...
The improvements from the prior week were encouraging. We saw money begin to rotate beyond the same narrow group of AI-related leaders, suggesting the rally might finally start to broaden. That would have been the healthier path.
But as we have said many times, hope is not a trading plan.
By the end of last week, much of that improvement had evaporated. The rotation that began in software stocks and then spread in fast but furious spurts to other sectors looked promising, but early in the week it became clear that many of those gains were being given back too quickly.
I mentioned in the Green Room that some of the improving areas were not holding gains well. At the time, that alone was not enough to anticipate the magnitude of Friday’s decline. Bottoming stocks and sectors are often volatile, and the early stages of rotation are rarely clean. But by week’s end, most of the improvement was gone.
Friday’s decline was not created by one thing. It was the result of several warnings lining up at the same time.
The first warning has been with us for weeks: breadth. Letter Subscriptions Options - See Here
Since the beginning of May, we have been discussing how anemic the market’s breadth has been. The broader market has not been as strong as the major averages suggested. A small number of AI-related stocks have been doing the heavy lifting, and when a few stocks are carrying the market, the market looks stronger than it really is.
That is the danger of a narrow rally. It can keep going longer than most expect, but when the leaders begin to stumble, there is not enough broad participation underneath to absorb the selling.
The S&P 500 had gained about 11% through May, but excluding AI-related stocks, the gain was only about 2.4%. As of Friday’s close, the S&P 500 was still up 7.8% for the year, but without the AI stocks, it was essentially flat. That is not a broad bull market. That is a concentrated advance wearing a broad-market disguise. I think everyone was aware.
The second warning was sentiment.
Overly bullish sentiment, especially excessive call buying versus put buying, can accelerate a move lower once prices begin to fall. However, this was not a perfect “risk-off” signal from the internals because breadth never reached an excessively bullish extreme. That matters. The internals were not bearish in the classic extreme sense, but they were not strongly bullish either.
S&P 500 - Breadth - Sentiment
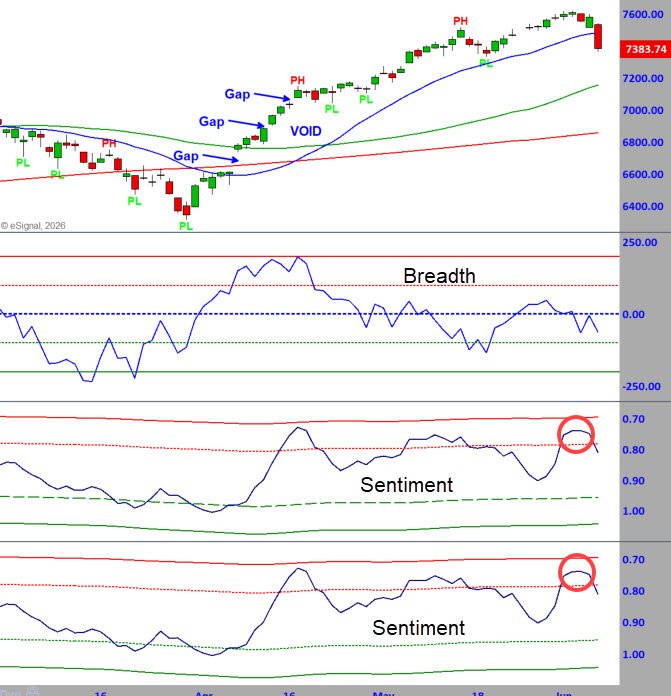
In other words, the market was vulnerable, but not unanimously overbought beneath the surface.
That is why Friday’s decline was a shock in speed, but not a total surprise in structure.
The third warning came from the options market. Letter Subscriptions Options - See Here
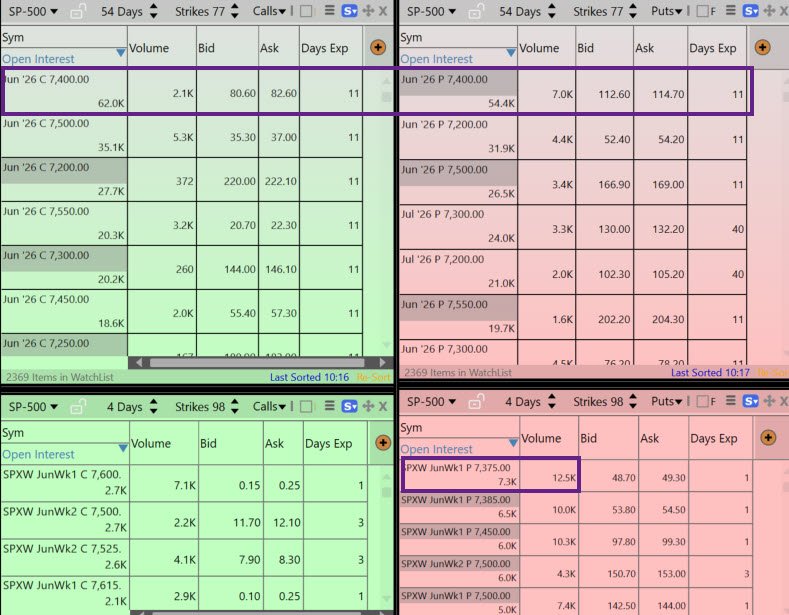
There was a large amount of call open interest at the 7550 and 7500 strikes. Once those levels gave way, there was a void of price support below. That alone did not suggest the full magnitude of Friday’s decline, but it did tell us that if those levels failed, prices could move quickly.
There was also significant call and put open interest around 7400, but those options do not expire until the end of next week. See below.
That was a significant distance away, and, based on the recent 5-day average true range of the S&P 500 and the fact that testing 7450 must happen first, it “seemed” unlikely 7400 would happen Friday.
S&P 500 - 5-Min. Chart and Call and Put Options
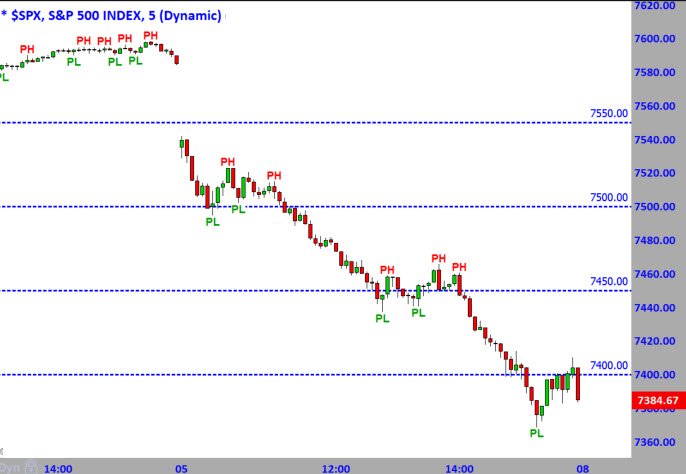
They did test 7450, held there for almost an hour, and then dropped again.
That was a good reminder that options open interest can act like a magnet, but price still has to deal with support, resistance, and trader reactions along the way.
The final straw: the May jobs report.
The stronger-than-expected report showed job growth of 172,000, roughly double expectations. In a normal world, that would be good news.
In this market, it became another case of “good news is bad news.” The report immediately raised concerns that the Fed may not be able to cut rates as soon as the market had hoped. Worse, it raised the possibility that the Fed may have to remain tighter for longer — or even hike again if inflation pressures return.
That quickly changed the market’s focus. Letter Subscriptions Options - See Here
10-Year Yield and 13-Week Yield
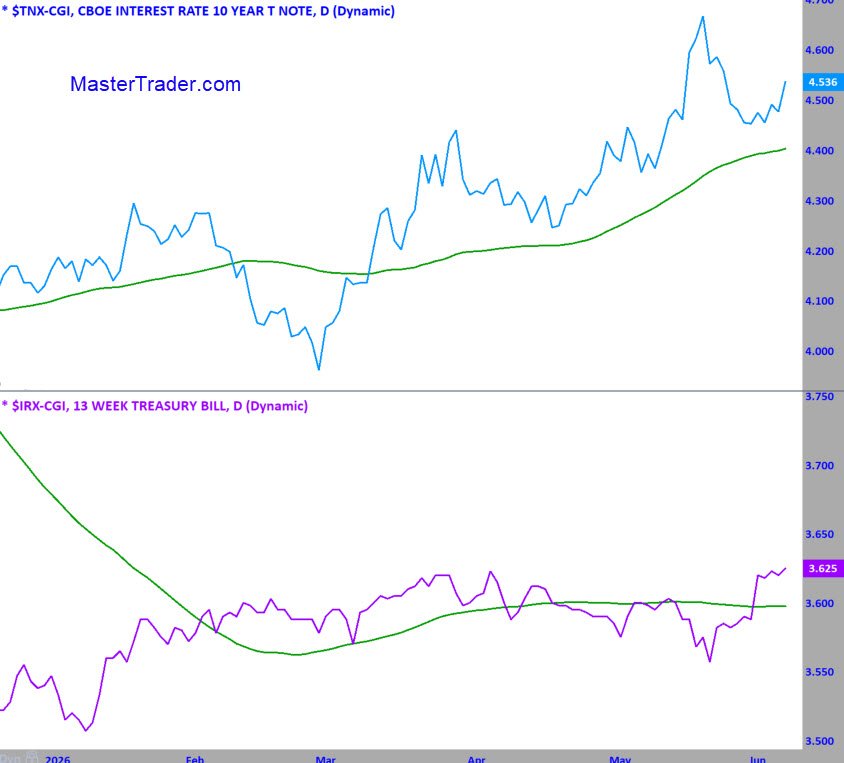
The 2-year yield rose more than 11 bps, one of the largest one-day moves. This suggests a higher chance of a rate hike. And the 13-Week Treasury Bill yield also moved higher
The 10-year Treasury yield pushed above 4.5%, and the 30-year moved above 5%. Higher yields pressure growth stocks because they increase borrowing costs and reduce the present value of future earnings. That matters most for technology and AI-related companies, where a large part of the valuation is based on future growth expectations.
The U.S. dollar spiked higher alongside yields. Bonds, stocks, oil, gold, silver, bitcoin, and many commodities all came under pressure. The Nasdaq fell 4.2%, more than 1,100 points, in its worst decline since the tariff rout of April 2025.
Semiconductor ETF (SMH) and Broadcom (AVGO)
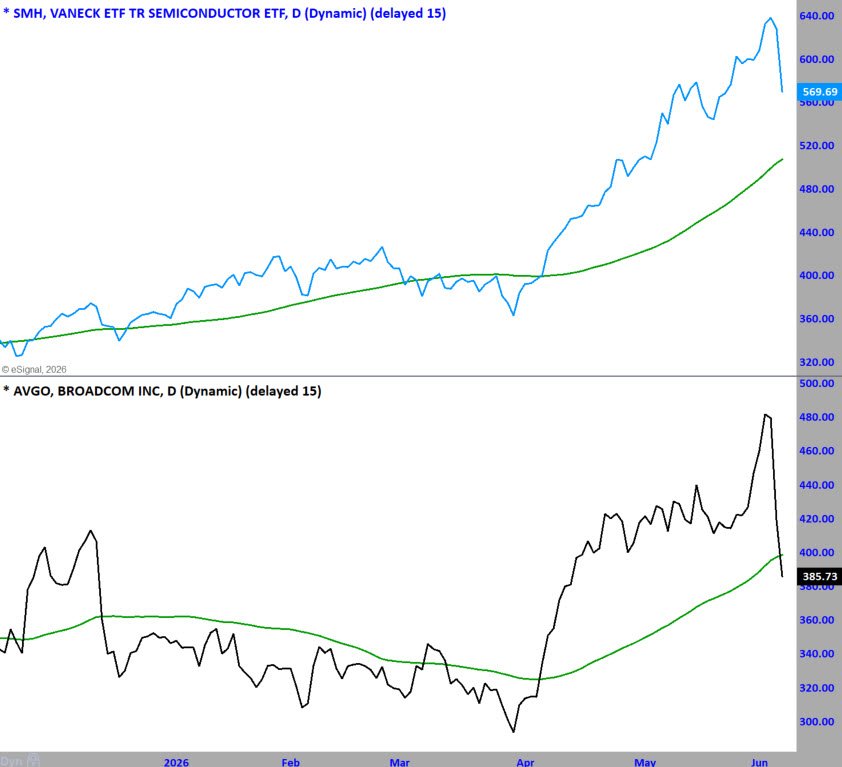
The damage was most obvious in semiconductors.
The PHLX Semiconductor Index fell hard, erasing more than $1 trillion in market value and dropping sharply from its recent high. But context matters. The semiconductor index had risen dramatically from the April 2026 low, so while Friday’s move was ugly, it was also a correction against a huge prior advance. That does not make it bullish, but it does put the decline in perspective.
Cracks had already started before the jobs report. AVGO’s earnings reaction was a warning. MU fell Thursday and continued lower Friday. Once the semiconductors began to break, the selling spread quickly through the AI leadership group.
This is the other side of a narrow rally. When money is concentrated in the same crowded winners, everyone feels smart on the way up. But when the exit door gets crowded, the move lower can feel like an elevator with the cable cut. Letter Subscriptions Options - See Here
There is also a bigger question building around AI spending.
Alphabet and Meta have both been tied to massive funding needs for AI expansion. If companies can sell stock while prices are high, Wall Street calls it raising capital. I call it free money. But if the stocks keep falling, investors may not be as eager to buy those offerings. Then the companies may have to turn more heavily to the debt market and pay interest on those billions.
That is not a problem when the market believes the payoff will be enormous. It becomes a problem when investors start asking, “When do we actually see the return?”
That is why Friday’s selloff was about more than one jobs report. It was about valuations, rates, positioning, AI spending, sentiment, and narrow leadership all colliding at the same time.
The Good, the Bad, and the Next Test
The good news is that one bad day does not end a bull market.
The bad news is that one bad day can quickly change short-term psychology.
The S&P 500 and Nasdaq are now in a position where follow-through matters. If Friday’s selling continues early this week and buyers do not step in near support, the correction can continue. If buyers do step in and stabilize the market, the next question is whether the bounce is real buying or just short covering.
At Master Trader, we do not need to guess. We need to watch the reaction.
The key is whether prior support becomes resistance, whether the leaders can repair, and whether the lagging sectors hold up or also begin to roll over. If selling spreads beyond the AI and semiconductor names, that would be a bigger problem. If the damage remains mostly concentrated in extended leaders while money rotates into less extended areas, the market can still hold together.
But the burden of proof has shifted. Letter Subscriptions Options - See Here
A week ago, the market had a chance to broaden. This week, the market has to prove that Friday was a shakeout and not the start of something larger.
S&P Daily Charts
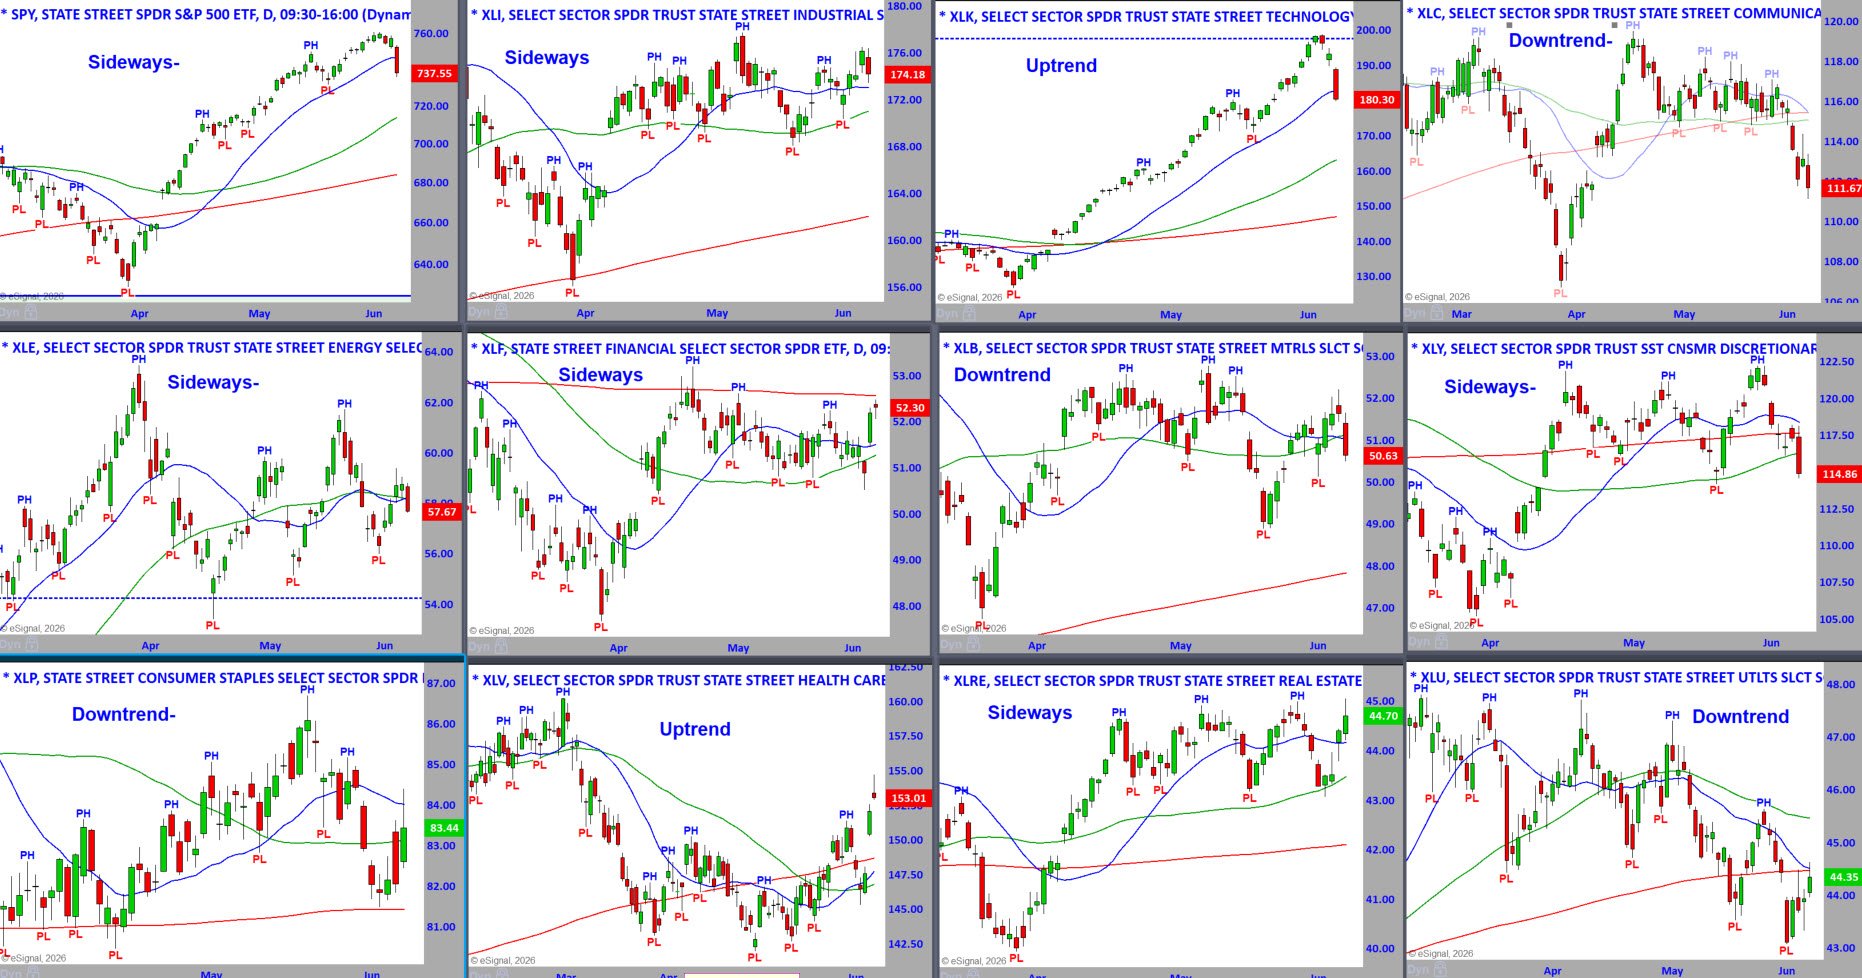
Friday’s sharp decline was a meaningful shot across the bow and a reminder that this market has been uneasy for weeks.
A point of clarification on the chart labels: those with “Sideways-”, like SPY, mean a negative trend change from Up to Sideways. That is not a bearish trend yet, but it is a loss of momentum. XLC weakened further, moving from Sideways to Downtrend, which is a more significant deterioration.
The leaders took the hit. Technology (XLK), while still technically in an uptrend, suffered a sharp break. Consumer Discretionary (XLY), Financials (XLF), Industrials (XLI), and SPY are now showing more hesitation than strength. Materials (XLB) and Utilities (XLU) remain in downtrends, while Energy (XLE) continues to be erratic and range-bound.
On the bottom row, the more defensive areas saw rotation again. Healthcare (XLV) remains the strongest chart and is still in an uptrend. Real Estate (XLRE) is sideways but improving, while Consumer Staples (XLP) and Utilities (XLU) continue to reflect the back-and-forth defensive rotation we’ve been seeing week to week.
That “in and out” movement into defensive sectors tells us institutions and active traders have been walking on eggshells. Between the war, historically extended technology stocks, and a generally uneasy macro backdrop, a break was inevitable. We never know the exact day it will happen, but when leadership is narrow and markets are stretched, it is only a matter of time.
Some air was let out of the balloon last week. Letter Subscriptions Options - See Here
For now, the charts suggest a market that is rotational, uneasy, and vulnerable. Not broken, but clearly less comfortable than it was just a week ago. If money continues to rotate defensively while the leaders fail to recover, this pullback likely has further to go.
S&P Weekly Charts
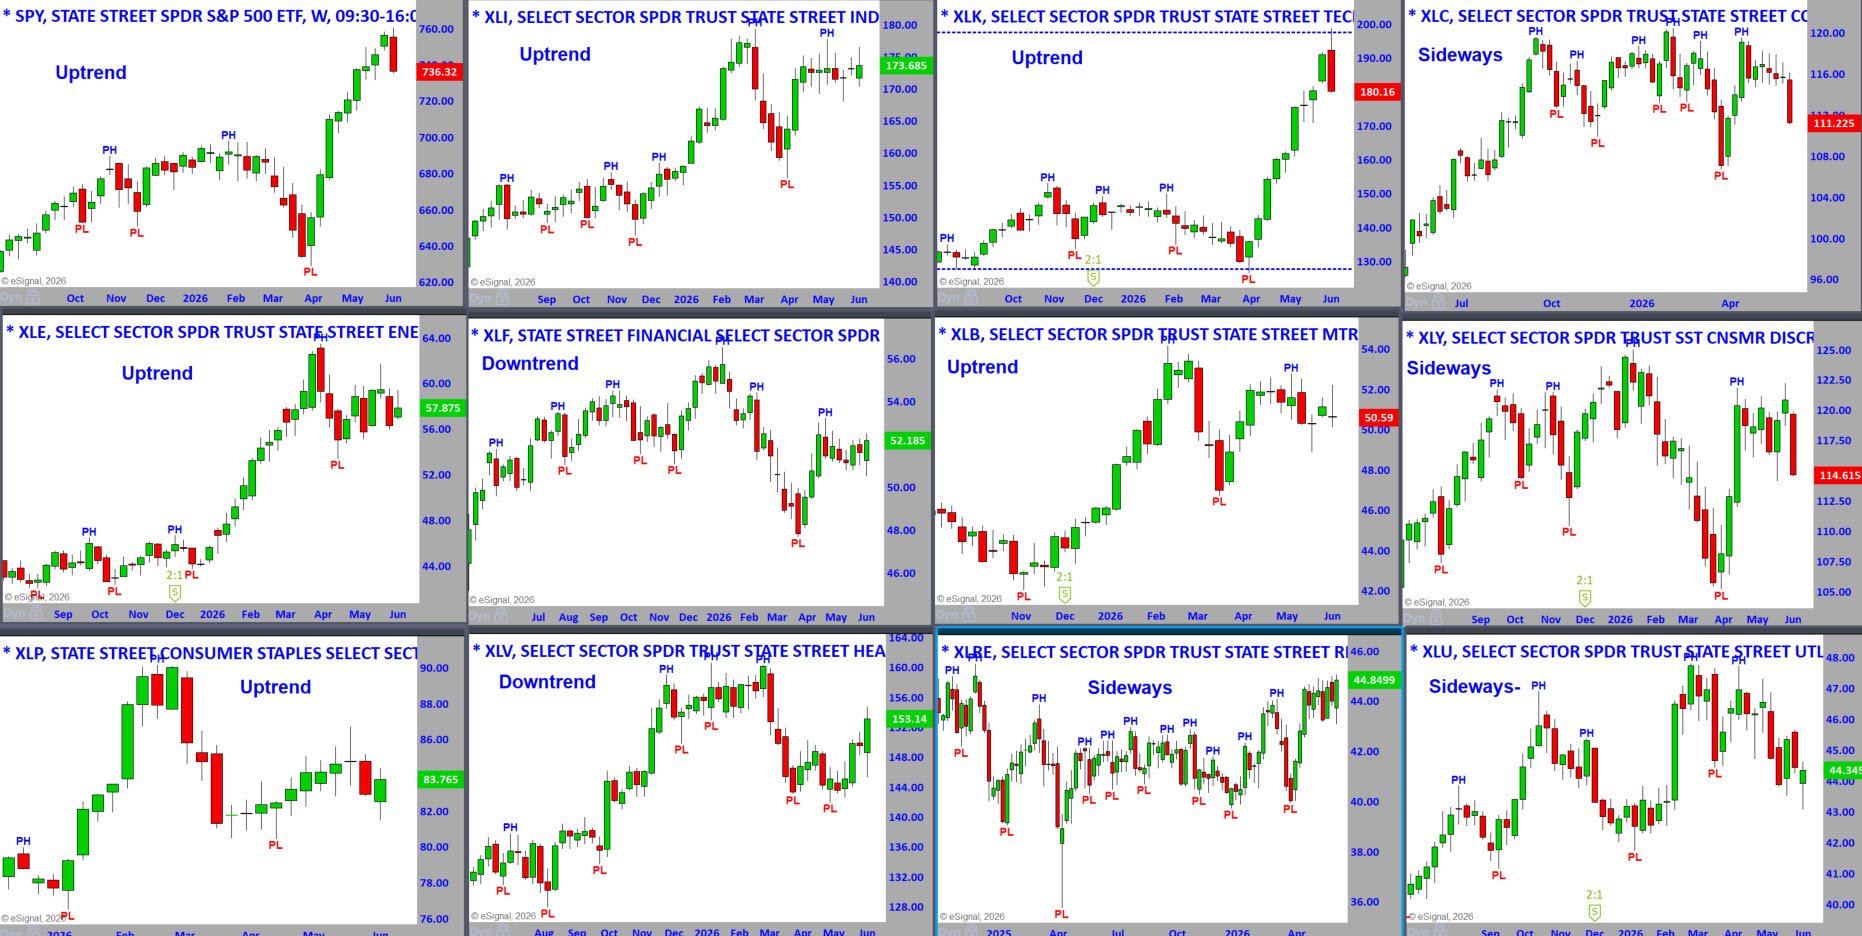
The weekly charts held up better than Friday’s daily damage would suggest.
The two strongest areas, SPY and XLK, both had large down weeks. That is never something to ignore, especially after the extended advance from the April low. However, both remain in weekly uptrends, so the longer-term trend has not been broken.
Technology (XLK) is still the strongest weekly trend, but last week’s reversal took some air out of the balloon. That was needed, but whether it was enough remains to be seen.
SPY also remains in an uptrend, but the size of the red bar tells us institutions were not shy about taking profits.
Most of the other sectors are still holding within their respective ranges. Industrials (XLI), Energy (XLE), Materials (XLB), Consumer Staples (XLP), and Real Estate (XLRE) are not breaking down on the weekly charts. They are mostly consolidating, which keeps the broader market from looking like a major breakdown.
Financials (XLF) improved last week, but we have seen this movie before. The sector remains erratic, and one week of improvement does not change that. Still, it is a start, and if Financials can continue higher, it would help support the broader market.
Communication Services (XLC) and Consumer Discretionary (XLY) remain sideways on the weekly charts, but both are struggling. They need buyers to show up quickly, or the daily weakness can begin to infect the weekly patterns. Letter Subscriptions Options - See Here
The weaker areas are still Healthcare (XLV) and Utilities (XLU), which remain in weekly downtrends. Healthcare had a strong daily improvement, but the weekly chart still has repair work to do.
Overall, the weekly charts are not as bearish as the daily charts. The damage was real, especially in the leaders, but most sectors are still holding within their ranges. That means the market is wounded, not broken.
The key now is whether last week’s selling was profit-taking in extended leaders, or the start of broader institutional distribution. As always, the next few days should tell the story.
Matrix
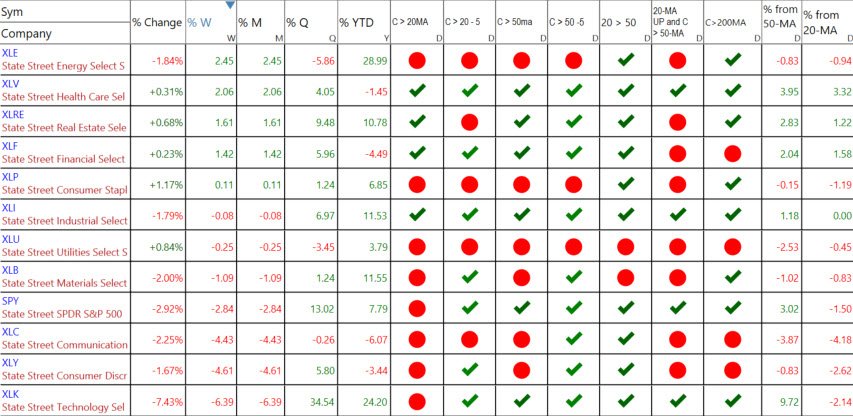
Last week’s matrix shows a clear shift: money rotated into laggards and defensives, while the prior leaders were hit hard.
The best performers were Energy (XLE +2.45%), Healthcare (XLV +2.06%), Real Estate (XLRE +1.61%), and Financials (XLF +1.42%). Healthcare had the cleanest improvement, now above its 20-, 50-, and 200-MAs, and 3.32% above the 20-MA. Real Estate also improved, moving back above its 20-MA after being below it the prior week.
The worst performers were the former leaders: Technology (XLK -6.39%), Consumer Discretionary (XLY -4.61%), and Communication Services (XLC -4.43%). That is the important message. The selling was concentrated in the areas that had carried the market higher.
The ETFs that fell below the 20-MA after being above it the prior week were XLB, SPY, XLY, and XLK. That tells us short-term momentum weakened in the broader market and in several important sectors.
The ETFs that fell below the 50-MA after being above it the prior week were XLB, XLC, and XLY. That is more meaningful deterioration, especially in Communication Services and Consumer Discretionary.
Technology deserves special attention. XLK fell 7.43% on Friday and 6.39% for the week, yet it is still 9.72% above the 50-MA. That shows how extended it was, and even after the sharp decline, it is not washed out. However, XLK is now 2.14% below the 20-MA, which is the first real technical warning in the strongest sector.
The S&P 500 ETF (SPY) fell 2.84% for the week and moved below its 20-MA, but it remains 3.02% above the 50-MA. So, this is a short-term correction, not yet a major trend break.
The takeaway is simple: last week was not broad-based destruction, but it was a leadership hit. Healthcare, Real Estate, and Financials improved or held up, while Technology, Communication Services, and Consumer Discretionary weakened sharply.
That can still be a healthy rotation if money continues to move into laggards. But if the former leaders keep falling and the laggards fail to hold their gains, the market will have more downside to work through. Letter Subscriptions Options - See Here
Where are the Markets Headed this Week
This week brings several important economic reports.
On Tuesday, the market gets inflation data, including core inflation, month-over-month inflation, and year-over-year inflation. That report will matter because Friday’s jobs number put inflation and Fed policy back at the center of attention.
On Thursday, PPI, initial jobless claims, and continuing jobless claims will be reported.
On Friday, the Michigan Consumer Sentiment report will be released.
In addition, next week is an options expiration week. That matters because the large open interest around the 7400 level could draw “PINN” the S&P 500 back toward it if price moves too far away. Options-related positioning does not control the market, but during expiration weeks, it can influence short-term price movements.
Options pinning (or "pinning the strike") is the tendency for the underlying asset’s price (e.g., the S&P 500) to gravitate toward and close near a strike price that has very high open interest (OI), especially as expiration approaches.
There is likely to be some follow-through from Friday’s significant move lower. The first bounce may not be trustworthy. The first drop may not be the final drop. This is the type of environment where traders who chase every move can get chopped up quickly.
That means we should expect volatility to remain elevated. Letter Subscriptions Options - See Here
Technically, we want to see where buyers show up, whether Major Support holds, whether the 20-MA and 50-MA begin acting as resistance, and whether the prior leaders stabilize or continue lower.
Intermarket-wise, we want to see whether interest rates and the dollar continue to rise. If they do, that remains pressure on growth stocks. If yields calm down, the market has a better chance to stabilize.
Internally, we want to see if breadth improves on any bounce. A rally led by only a few names after Friday’s damage would not be enough. The market needs better participation.
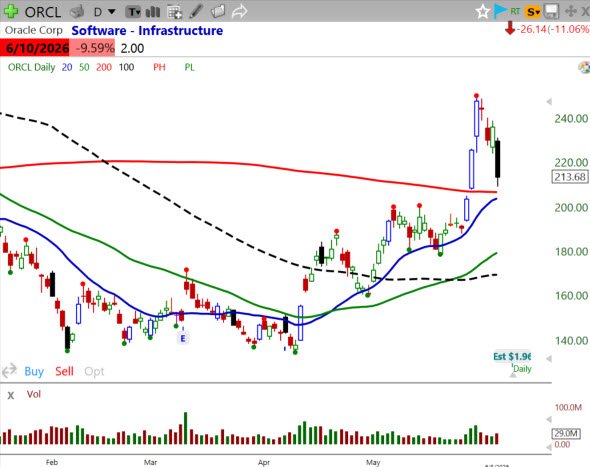
Oracle (ORCL) reports Earnings on 6-10
Adobe Systems (ADBE) reports Earnings on 6-11
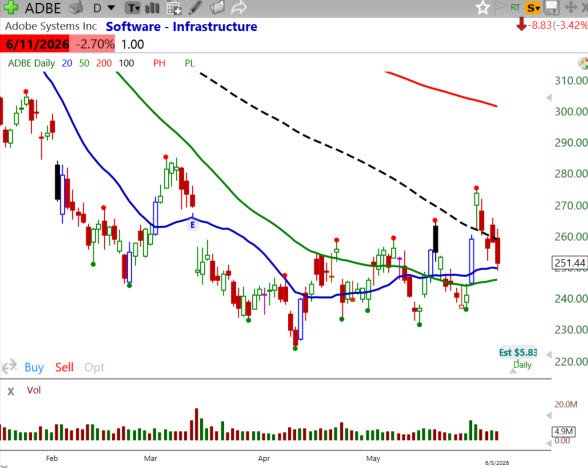
Technically, both ORCL and ADBE have been improving, bottoming out after extended declines. Both are pulling back to support and may be in focus for active traders ahead of their reports.
For now, the market has moved from cautiously optimistic to cautious.
There will be opportunities, but selectivity matters more now. Extended leaders have proven they can fall quickly. Bottoming patterns that do not hold gains are not ready. And when price, internals, intermarket analysis, and options positioning are not aligned, sitting on our hands is sometimes the best trade.
Friday was a reminder that complacency can still result in a financial spanking. The market gave the warning signs. Now we watch to see whether buyers defend the key levels or sellers have more work to do.
Dow Jones
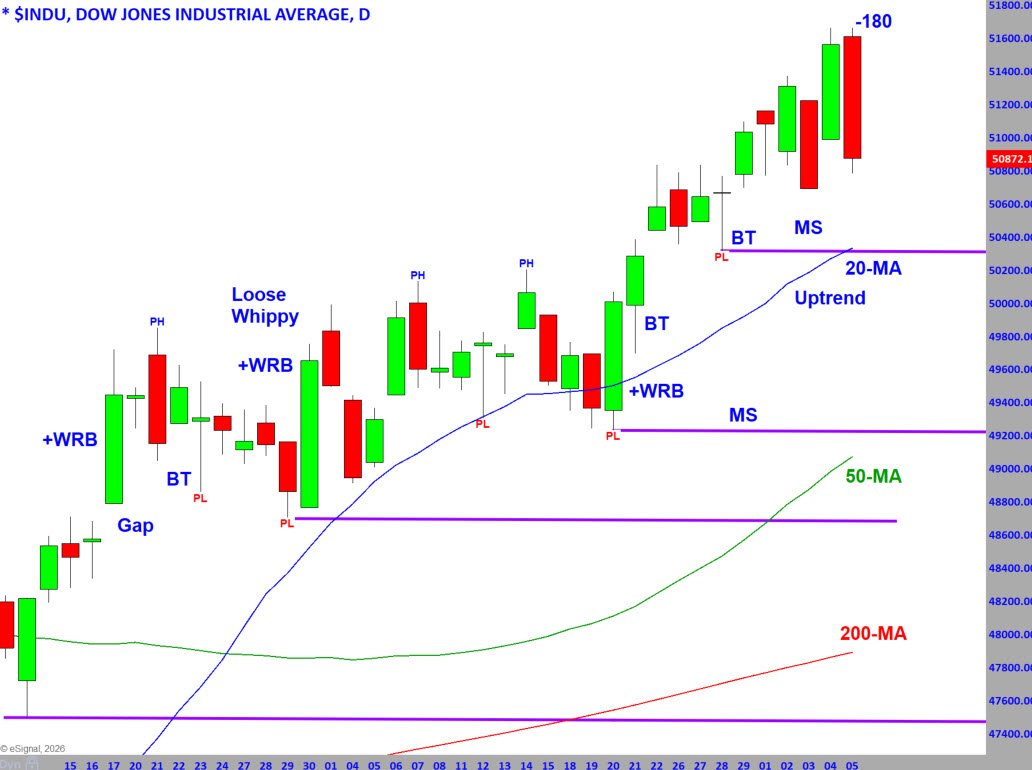
The chart above shows the Dow Jones Industrial Average through the lens of Master Trader Technical Strategies (MTS).
The Dow remains in an uptrend, but it is an uptrend inside a roller coaster. This is not a smooth institutional grind higher. It has been loose, whippy, and full of wide overlapping bars that require a strong stomach.
Last week’s range expanded again, with sharp moves up and down, ending with the largest downside move on Friday. That selling was meaningful, but it did not break the uptrend.
The recent new all-time high created a higher level of Major Support (MS), which now aligns closely with the rising 20-MA. That area becomes the next important reference point. As long as the Dow holds above that support zone, the trend remains intact. Letter Subscriptions Options - See Here
A break below that MS and the 20-MA would change the picture and suggest the Dow is ready for a deeper pullback toward the lower support area, possibly toward the rising 50-MA.
For now, the Dow is still bullish, but not comfortable. It is advancing, but with enough volatility to remind us that buyers are still nervous and sellers are quick to take a swing when given a reason.
VIDEO REVIEW OF MARKETS, SECTORS, AND INTERNALS - Click lower right to open Full Screen.
NEW STOCK TRADING IDEAS Below
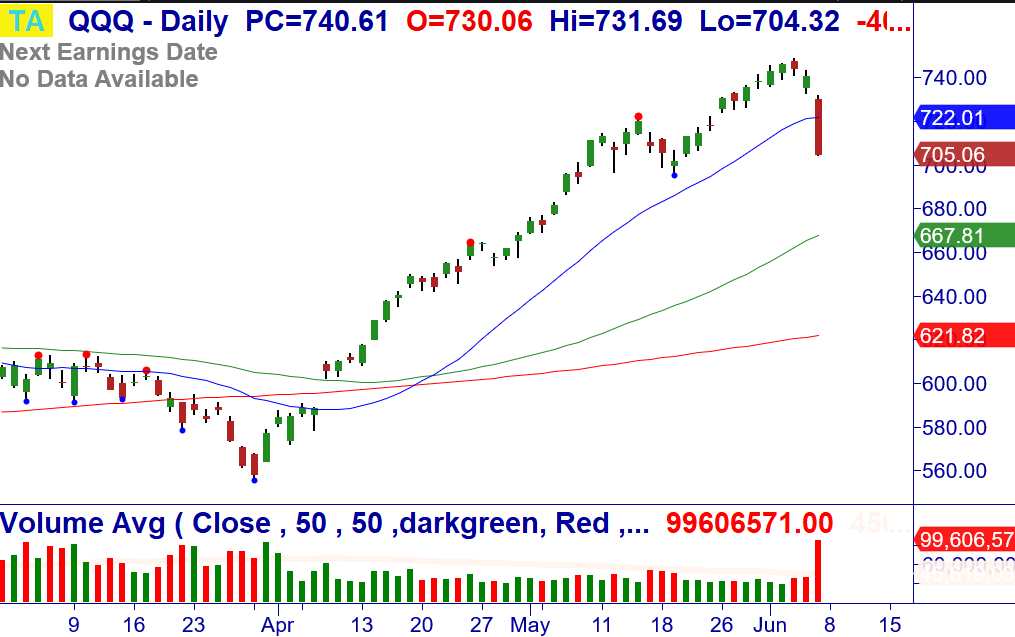
Because of the broad-based selloff last Friday (particularly with extended QQQ, XLK, and Semiconductors), there are not many quality swing setups; thus, we are providing you with a large watch list: Letter Subscriptions Options - See Here
6/8: LONG WATCH: Airlines (SKYW, LUV, ALK, UAL, DAL), Hotels (many made new highs even with market rout), WH, Railroads (CSX, UNP), Software (IGV, NOW, QLYS, NTNX, ESTC, RBRK), MSOS, RL, XAR/ITA (RTX, TDG, GE, VVX), AIIO, CLOV, HSIC, PPC, IGV, CBOE, CME, ZTS, IBIT, ORCL, SBRA, MSTR, ENR, VIRT, and MNDY. Some, but not all, will be considered in the Green Room. If you don't know the pattern, don't trade.
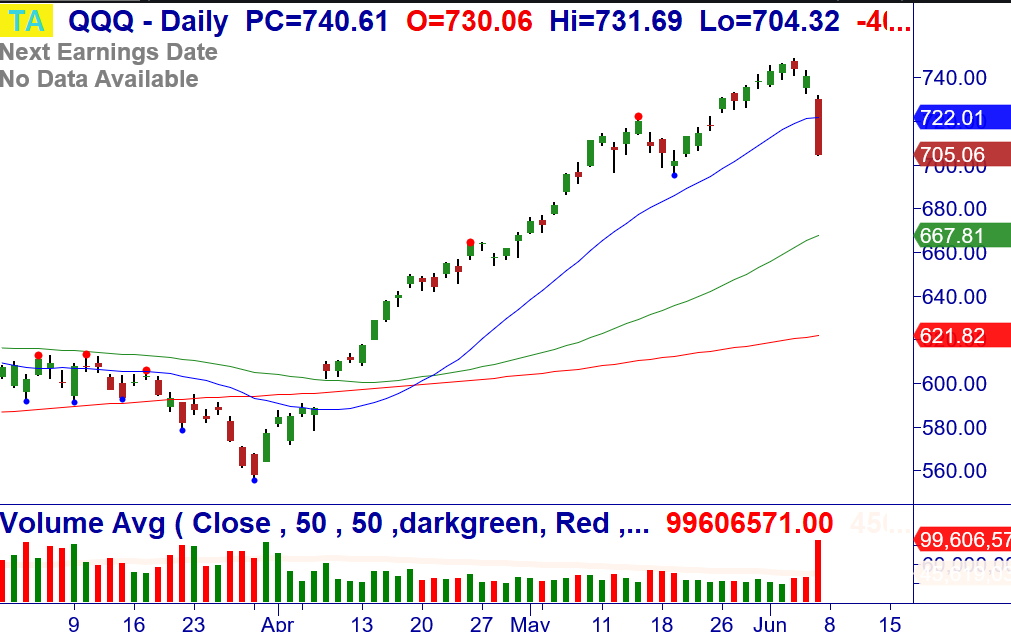
SHORT WATCH: QQQ, XLK, Semiconductors (SMH, TXN, AMD, MU, INTC), IWM, PYPL, and PLNT. Caution: Extended ETFs and Stocks in uptrends that fell Friday, they may move lower, but do not short them unless you are an experienced intra-day trader and can manage them.
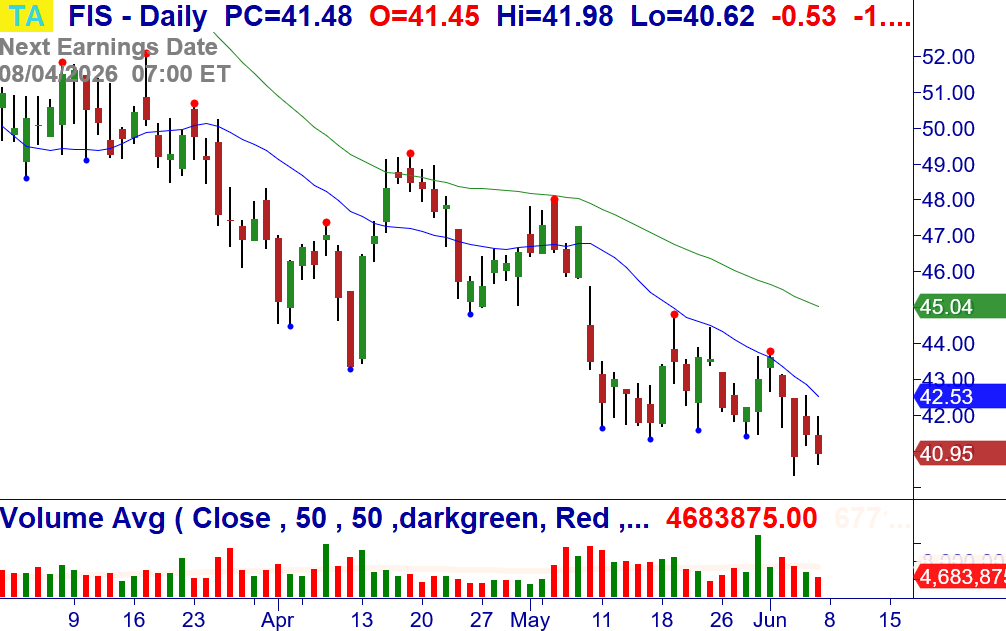
6/8: FIS – Under $40.33, consider shorting the stock. Breakdown daily/weekly. Stop $42.57.
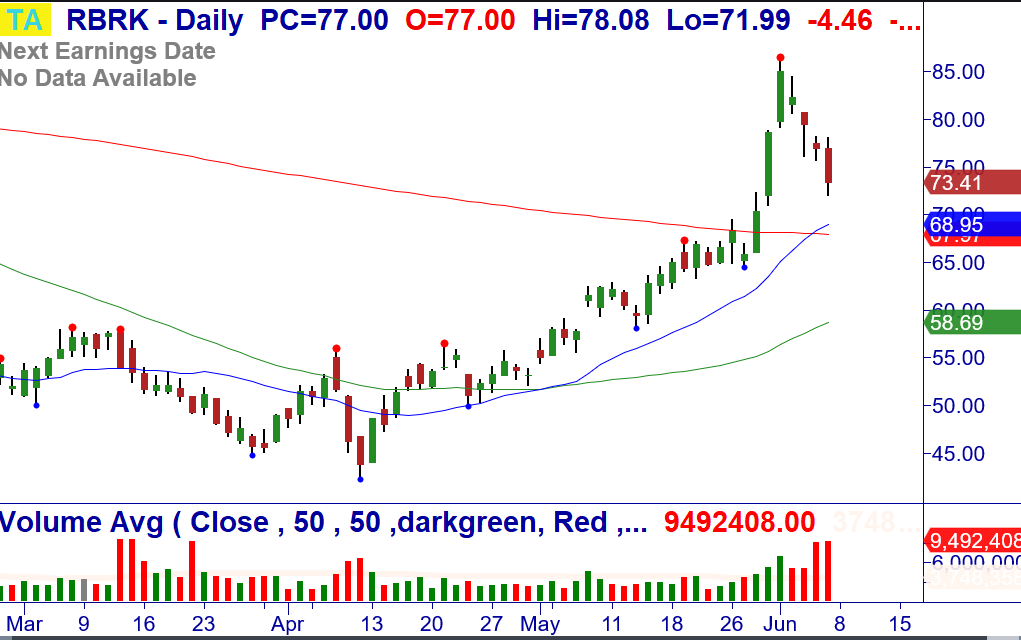
6/8: RBRK – Over $78.25, consider buying the stock. Buy Setup after +WRB Breakout. Stop $71.88.
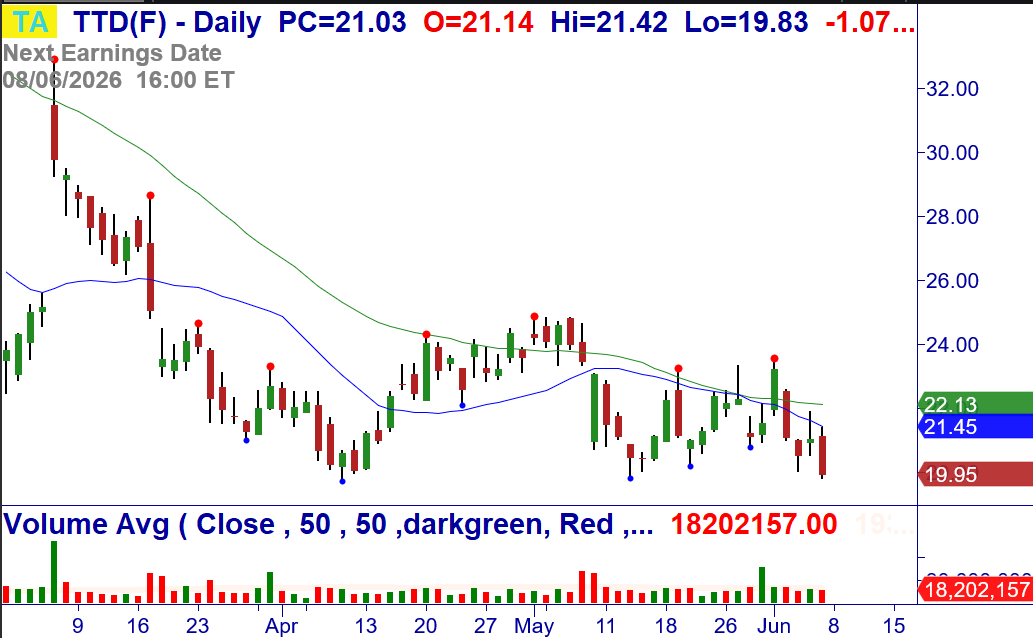
6/8: TTD – Under $19.84, consider shorting the stock. Breakdown at the 20-MA daily/weekly. Stop $21.92.
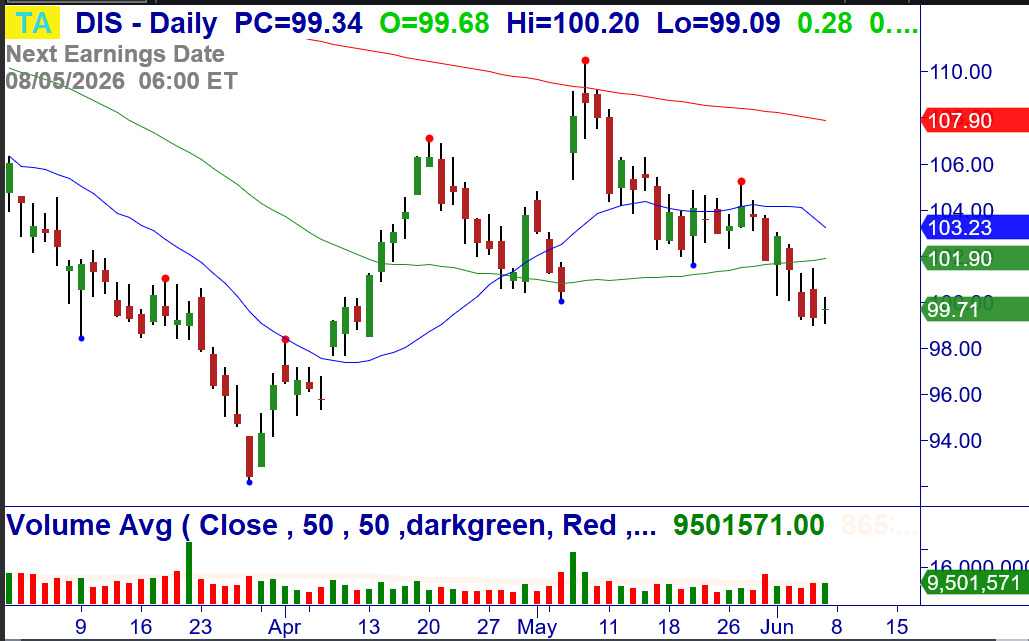
6/8: DIS – Under $99.00, consider shorting the stock. Continuation Breakdown daily/weekly. Stop $101.52.
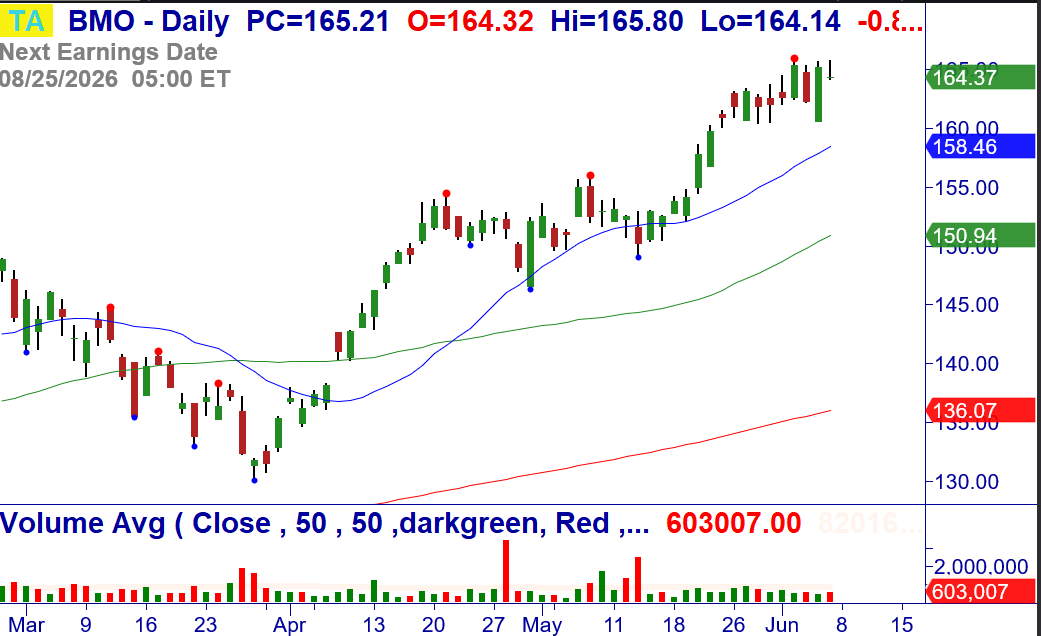
6/8: BMO – Over $165.80, consider buying the stock. +123 Breakout in a strong uptrend. Stop $160.58.
NEW OPTIONS TRADING IDEAS
Directional Options Strategies and Debit Spreads for Swing Trading (See the Weekly Options Trader letter, which sells options/spreads for weekly Income that primarily expire in 10 days or less, CLICK HERE)
6/8: We will be watching to buy puts on QQQ, XLK, SMH, TXN, AMD, MU, INTC, PYPL, etc.
Master Trader and You Building Your Financial Future Together!
Good trading! Letter Subscriptions Options - See Here
If you have any questions or comments, please e-mail Greg Capra at Greg@mastertrader.com or Dan Gibby at Dan@mastertrader.com
All the best,
Greg Capra Managing Director of Master Trader
Dan Gibby Chief Options Strategist
NOTE: Master Trader will show the opening and closing prices of all stock and options trades. We recommend that all traders and investors use proper share sizing for positions and money management. However, we cannot recommend what that is for your particular trading style, risk tolerance, or account balance. We urge you to calculate your own share/position size based on your individualized risk parameters, Trading Plan, and familiarity with the proposed trade strategy and risk. Advanced Management Strategies (AMS) covers in detail foundation and advanced position and money management.
NOTE: Master Trader and its representatives may have existing positions in actual or other trade recommendations before or after suggested herein. Additionally, we may manage them differently for internal purposes based on different risk parameters than noted herein. All trade ideas and content are for informational and educational purposes only. It is not, nor is it intended to be, trading or investment advice or a recommendation that any security, option, or investment strategy is suitable for any person. Trading securities can involve high risk and the loss of any funds. Significant gaps or volatility can increase these losses, particularly for short option strategies. Investment or trading information provided may not be appropriate for all investors, and is provided without respect to individual financial sophistication, financial situation, investing time horizon or risk tolerance. Supporting documentation for any claims (including claims made on behalf of options programs), comparison, statistics, or other technical data, if applicable, will be supplied upon request. Master Trader Consulting, Inc. is not a licensed financial advisor, registered investment advisor, or a registered broker-dealer. Options, futures, and futures options are not suitable for all investors.