

Some of last week’s comments included,
"If you step back and remove the noise, the answer is simple:
We’re still in a range.
The S&P 500 has been trading between approximately 6800 on the bottom and 7000 on the top, with 6900 acting as the midpoint magnet for months. Last week, prices moved from the lower end of that range back toward the middle."
If we strip away the headlines, geopolitics, inflation prints, and constant noise, the structural message remains the same:
The Market Is Still in a Range — But the Pressure Is Building
The S&P 500 has been oscillating between roughly 6,800 on the lower end and 7,000 on the upper end, with 6,900 acting as a magnet for months. Last week, prices moved from the lower portion of that range back toward the middle. That midpoint continues to act as a gravity center because supply and demand remain relatively balanced there.
But something important is happening beneath the surface.
The highs and lows are getting closer together.
The swings are tightening.
The 20- and 50-day moving averages are converging.
In Master Trader Technical Strategies (MTS), the contraction between moving averages reflects the contraction between demand and supply. Markets cannot stay compressed indefinitely. Contraction leads to expansion.
The real question is not whether the market will break.
The real question is whether the initial break will be real — or a whip-back fake-out.
Mixed Signals
Last week reinforced uncertainty:
• Hotter-than-expected PPI
• Treasury yields falling sharply
• Volatility lifting
• Escalating geopolitical tensions
• Continued AI disruption fears
The S&P 500 closed near 6,879. The Dow is near 48,978. The Nasdaq is around 22,668. These were modest weekly declines — not panic.
The bond market, however, told a more nuanced story. The 10-year yield dropped below 4% toward 3.95%. Falling yields typically signal expectations of slower economic growth, a higher probability of Fed easing, or capital rotating toward safety.
Lower yields tend to support Utilities, Real Estate, and other rate-sensitive sectors. They pressure Financials through margin compression. They also tend to create more selective leadership in growth stocks.
This is not a broad liquidation.
It is selective rotation.
The Real Story
The most important development last week was not the index's movement — it was the rotation.
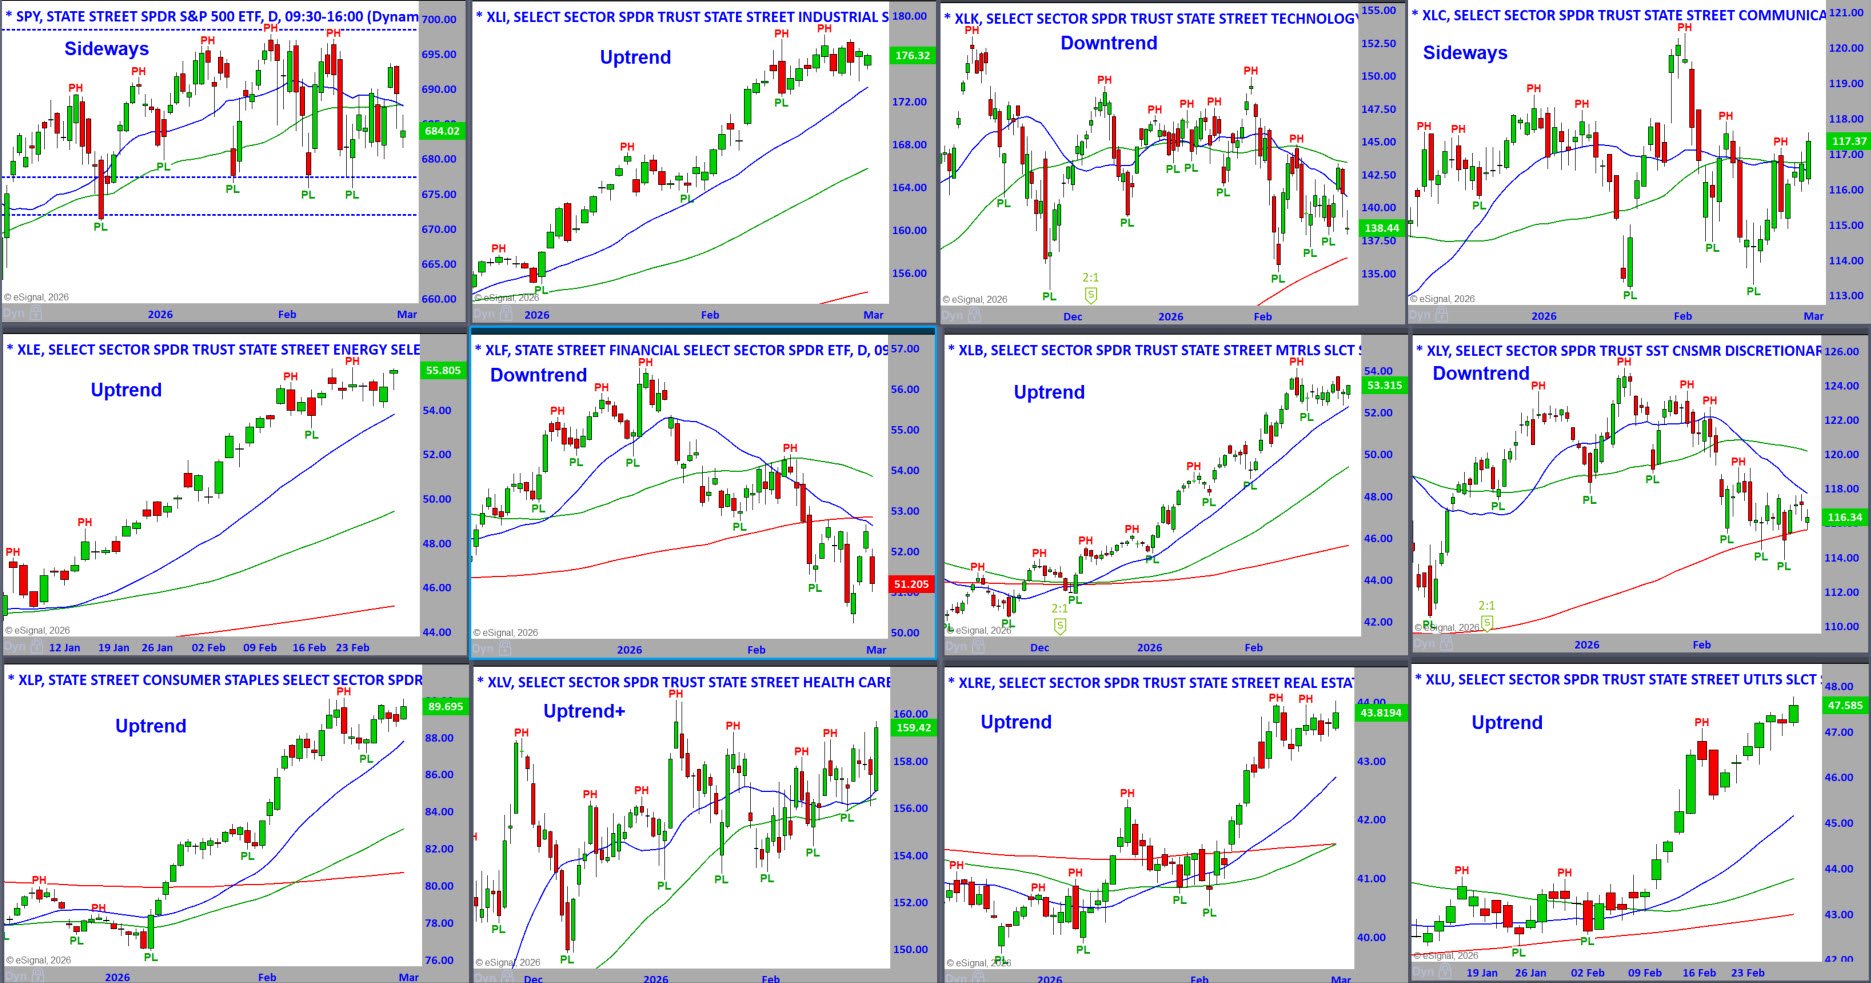
Strength was seen in Utilities, Consumer Staples, Healthcare, Energy, and Materials.
Weakness persisted in Financials, Software, parts of Technology, and select AI leaders.
When defensive sectors lead while Financials deteriorate, it is a cautionary message — not outright bearish, but clearly cautious.
At the same time, Materials and Transports are not collapsing. That argues against recession panic.
For ETF-focused traders, this is a textbook sector-rotation environment rather than a broad-index momentum phase.
Technology and AI: From Euphoria to Selectivity
The software ETF (IGV) has been under pressure for months. A viral AI “doomsday” narrative accelerated the recent drop, followed by a sharp rebound toward resistance.
Is it a bottom?
Is it short covering?
Is it institutional accumulation?
We do not guess.
We wait for structure.
The so-called Magnificent Seven are no longer uniformly leading. NVIDIA beat earnings and still fell nearly 10%. When strong earnings produce weak reactions, that often reflects institutional distribution — at least temporarily.
The 200-day moving average for NVDA has now become an important reference point. In MTS, the reaction at obvious technical levels is more important than the level itself. The bottom of its trading range is $170.
Constructive bar-by-bar stabilization suggests accumulation. Wide-range breakdowns suggest continued distribution.
The Broader Indices
The S&P 500 remains inside its multi-month range. The 20- and 50-day moving averages are converging near 6,900. Major Support has not been violated. This is compression — a coiled spring.
The Nasdaq 100 shows a narrower range with declining short-term moving averages overhead. The recent gap lower has partially recovered, but the action remains erratic.
The Russell 2000 and Transports rallied earlier in the week, improving breadth, but stalled into expiration. Continued improvement in small caps would broaden leadership and support a bullish case. Failure would reinforce defensive rotation.
Economic Catalysts
This week brings ISM Manufacturing, ISM Services, Jobless Claims, Nonfarm Payrolls, Retail Sales, and the unemployment rate.
Expiration weeks often pin markets near high-open-interest strikes before resolution. We just had a two-week advance into expiration, which modestly increases the probability of consolidation or pullback — but not necessarily a trend change.
The Critical Techno-Fundamental Divergence
Now we come to the most important intermarket development.
Commodities are rising:
Oil.
Gasoline.
Copper.
Gold.
Wheat.
Corn.
Agribusiness (MOO).
At the same time, interest rates are falling sharply.
The 10-year Treasury has dropped toward the 3.95–4.00% area. Bond prices are rising.
Under normal conditions, rising commodity prices would push yields higher, not lower. Higher oil and copper imply input cost pressure. Rising agricultural prices imply food inflation. Gold strength often reflects currency hedging or uncertainty.
Historically, sustained commodity strength has aligned with inflationary pressure or strong demand.
Yet rates are not rising.
They are falling.
That is the divergence.
Interest rates fall when investors anticipate slower economic growth, a higher probability of Fed cuts, or when capital moves into bonds as perceived risk increases. When money flows aggressively into Treasuries, bond prices rise, and yields fall.
In other words, falling rates are not just about inflation expectations — they also reflect capital seeking safety.
If investors perceive rising geopolitical risk, financial instability, or earnings deterioration, they reduce equity exposure and rotate into bonds. That demand pushes yields lower.
So we currently have multiple messages:
Commodities suggest inflation or supply pressure.
Defensive sectors suggest caution.
Bond yields suggest growth concern or risk aversion.
This is not synchronized alignment.
It is tension.
What This Means for Equity Structure
When intermarket relationships are aligned, trends are clean.
Right now, alignment is missing.
Commodities are rising.
Rates are falling.
Defensives are leading.
Financials are lagging.
Technology leadership is fragmenting.
This explains why the S&P 500 remains compressed. It is not breaking down, nor is it expanding.
Indecision creates contraction.
Contraction precedes expansion.
What Would Resolve the Divergence?
For a bullish expansion:
Financials would regain strength.
Technology leadership would broaden.
Breadth would expand.
Rates would stabilize.
Defensive outperformance would cool.
For a bearish resolution:
Commodities would continue surging aggressively.
Financials would break Major Support.
Defensive leadership would accelerate.
Indices would violate pivot lows on a closing basis.
Breadth would deteriorate.
We do not forecast which outcome will occur.
We monitor which side gives way first.
S&P Sector ETFs – Daily Charts - To See a Larger Image,
Right-Click and Press Open in a New Tab
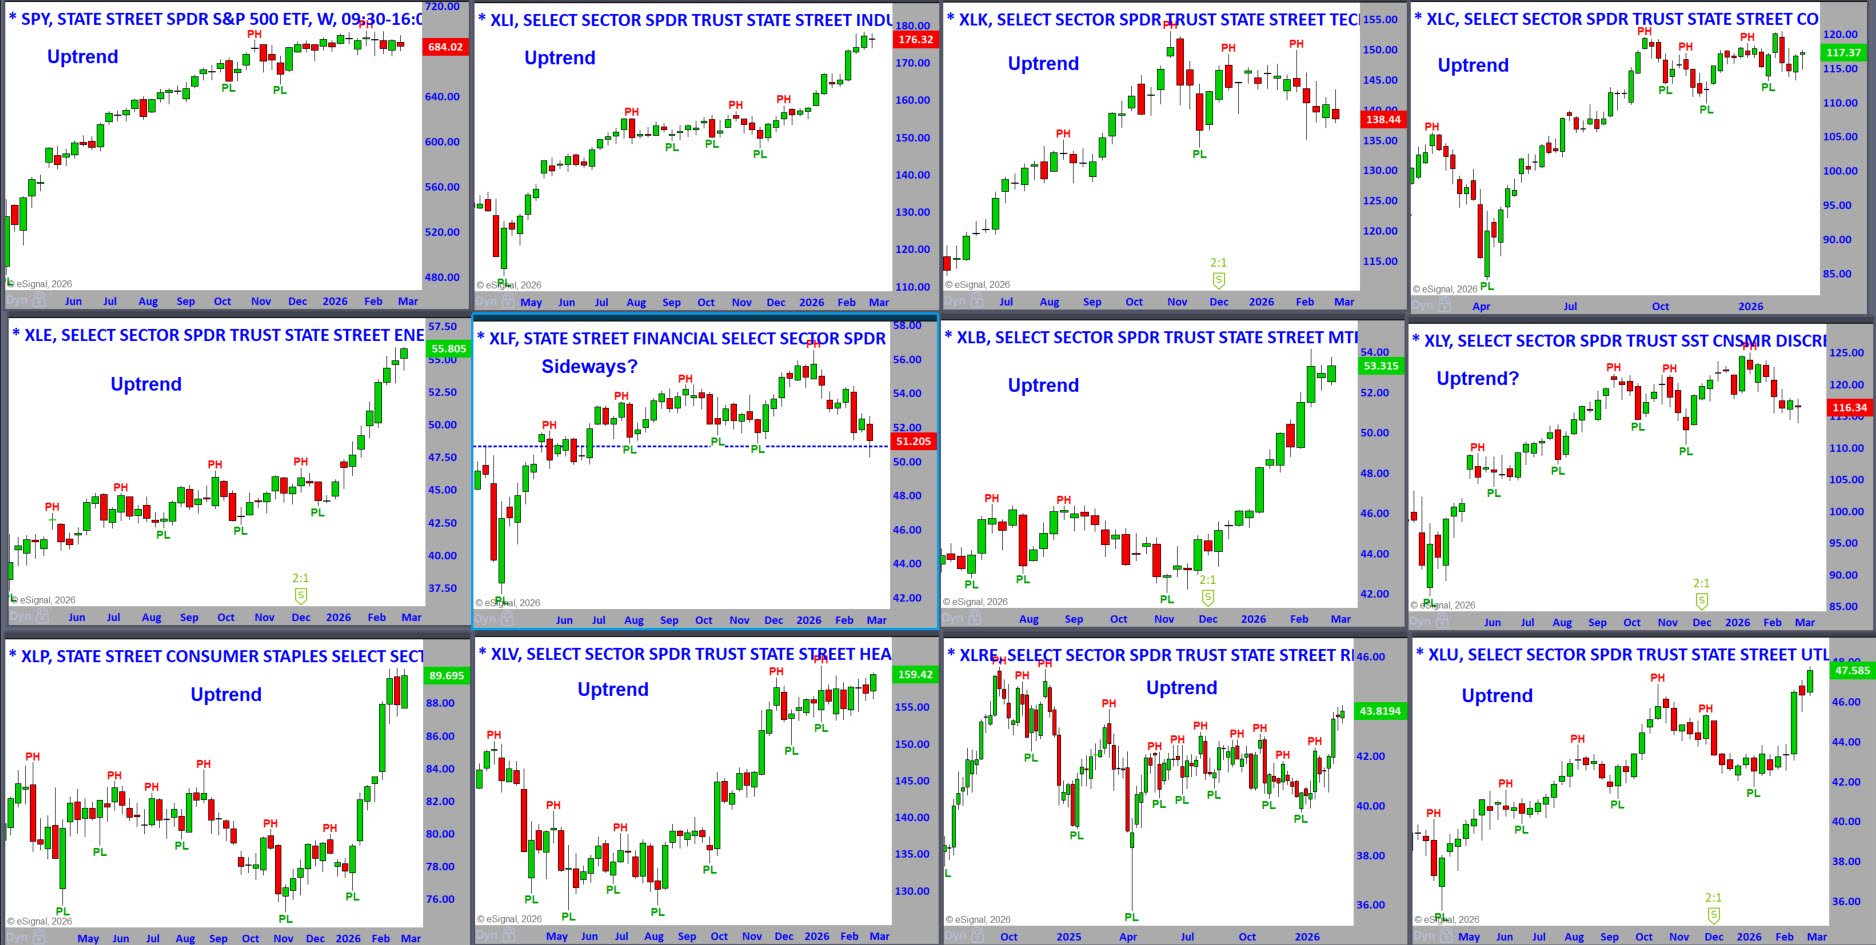
S&P Sector ETFs – Weekly Charts - To See a Larger Image,
Right-Click and Press Open in a New Tab
S&P Sector ETFs – Sorted by Weekly Percent Change This Week
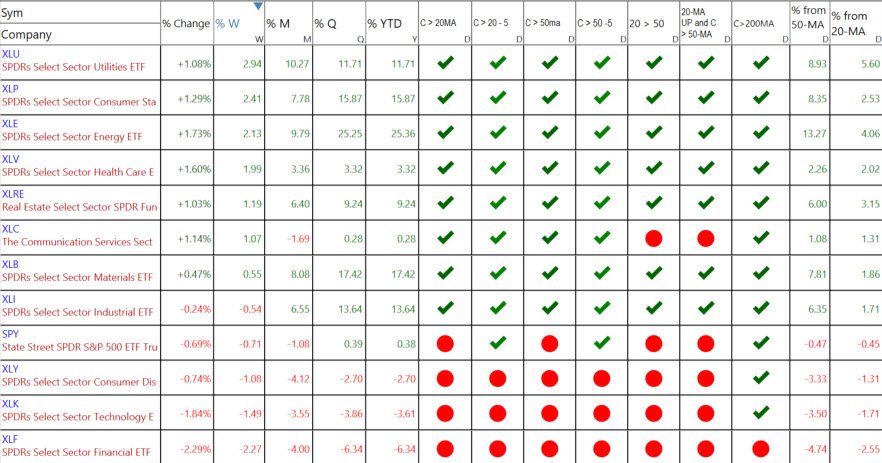
Last week’s percentage changes.
The percentage changes tell you which sectors were the strongest or weakest on Friday and for the week, month, quarter, and year.
There are seven columns after the percent changes in the sector listed above.
You can see the ETFs that are the strongest getting stronger or weakening.
- Close above or below the 20-MA.
- Close above or below the 20-MA 5 Days Ago. C>20 -5
- Close above or below the 50-MA.
- Close above or below the 50-MA 5 Days Ago. C>50 -5
- 20-MA above or below the 50-MA.
- 20-MA is pointed up, and the close is above the 50-MA
Where are the Markets Headed this Week?
Geopolitical developments make early-week positioning difficult. Gaps are possible. Oil volatility is possible, particularly with the strikes on Iran. News-driven spikes are possible.
But once the initial reaction settles, structure will matter.
The market is coiled.
Multiple sectors are forming wedges.
Moving averages are tightening.
Leadership is rotating.
This is a Techno-Fundamental tension environment.
The commodity complex signals inflation risk.
The bond market signals growth risk and risk aversion.
The equity market reflects uncertainty.
When markets are unsure, they compress.
Our job is not to predict.
Our job is to define Major Support and Resistance, monitor alignment, wait for expansion, apply bar-by-bar confirmation, and manage risk precisely.
The divergence is not a reason to panic.
It is a reason to stay sharp.
Because when opposing forces resolve, the move is rarely subtle.
What the Matrix Is Saying
Several sectors that were below their 20- and 50-day moving averages have reclaimed them. Some previously extended leaders have pulled back toward their 50-MAs. The strongest sectors now sit closer to rising 20-MAs — areas where buyers may defend.
Internal gauges are neutral — no edge.
Breadth is neutral — no edge.
Sentiment is no longer extreme — no edge.
This is a selective, tactical environment.
The Bigger Picture
This is not a trending environment.
It is not a collapsing environment.
It is not a euphoric environment.
It is a rotational, selective, coiling market.
Defensives are attracting capital.
Financials are weakening.
Technology is fragmenting.
Transports are holding.
Rates are falling.
Geopolitics adds uncertainty.
There will be opportunities — but they will not be broad-based.
Astute sector selection and nimble execution will matter more than ever.
And sometimes, the highest-probability trade remains:
SOH — Sit On Hands — until price expands with authority.
A few earnings reports this week that could give us additional insight into software bottoming and/or rotation are CrowdStrike (CRWD), Target (TGT), and Ross Stores (ROST) on Tuesday. Broadcom (AVGO) on Wednesday, and Marvel Technology (MRVL), Ciena (CIEN), and Costco (COST) on Thursday.
DOW JONES
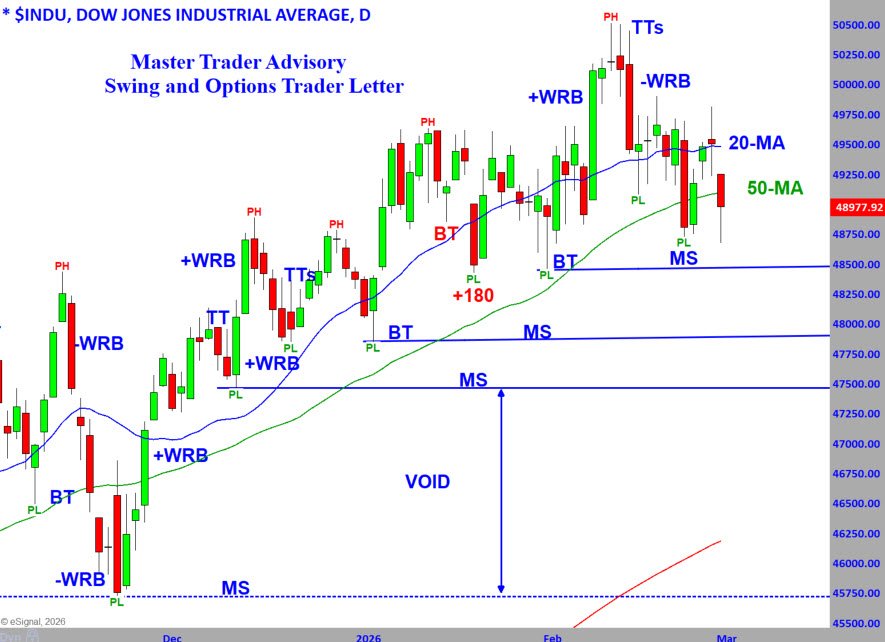
The chart above shows the Dow Jones Industrial Average through the lens of Master Trader Technical Strategies (MTS).
The Dow provides a textbook illustration of contraction.
- 20- and 50-day MAs narrowing.
- Overlapping bars.
- Multiple tails.
- Failed breakouts.
- Deep retracements to Major Support.
This is indecision.
Last week, the Dow fell sharply on Monday – another bearish wide range bar.
However:
- The bearish reversal was negated.
- Major Support held without testing it – a signal of demand (buyers) anticipating the entry.
- The 50-MA is rising and aligned with current prices.
If buyers can push above Thursday’s high and hold, new all-time highs are close.
If Major Support (MS) fails on a closing basis, the next MS area is just below 48,000.
This is what contraction looks like before expansion.
VIDEO REVIEW OF MARKETS, SECTORS, AND INTERNALS - Click lower right to open Full Screen.
NEW STOCK TRADING IDEAS Below
NOTE: Please see the document in RESOURCES entitled Master Trader Guidelines for Trading the Open and Gaps.
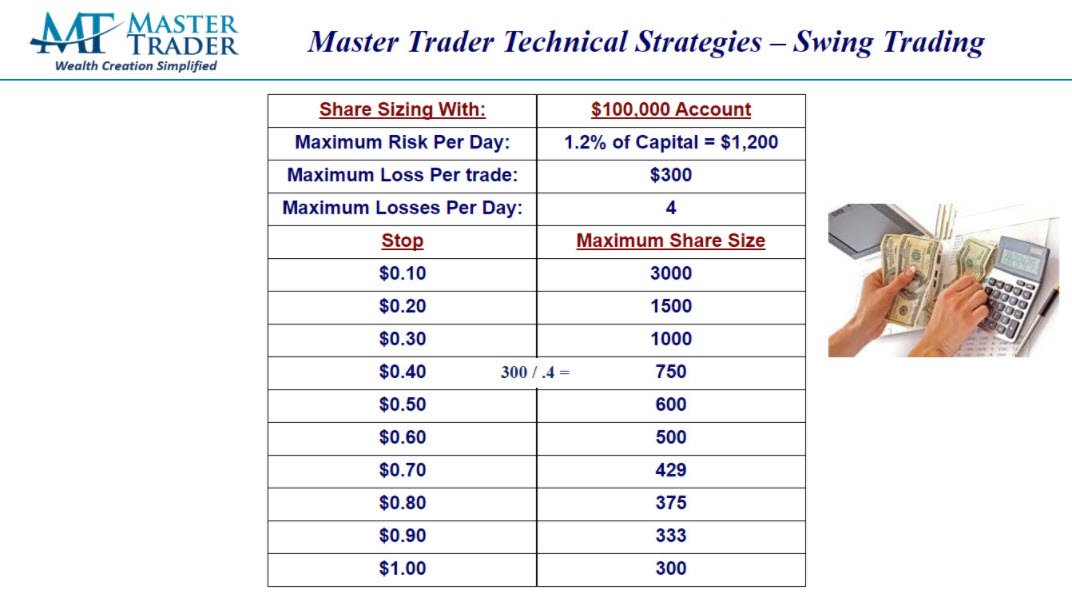
Note on Position Size Calculation in the Open Trades Sheet:
All trades are based on a hypothetical Max Loss of $300/trade. For Stocks, that is $300 / (Entry - Stop). Directional option trades use the same formula, then divided by 100, rounded down to the nearest whole number, with a minimum of one (1).
The “Master Trader Blended Method” for shorting options/spreads size starts with the stock position size, multiplying by 1.5, then divide by 100 because 1 contract represents 100 shares.
Please calculate position size according to your Max Loss per your Trading Plan.
Here's an example:
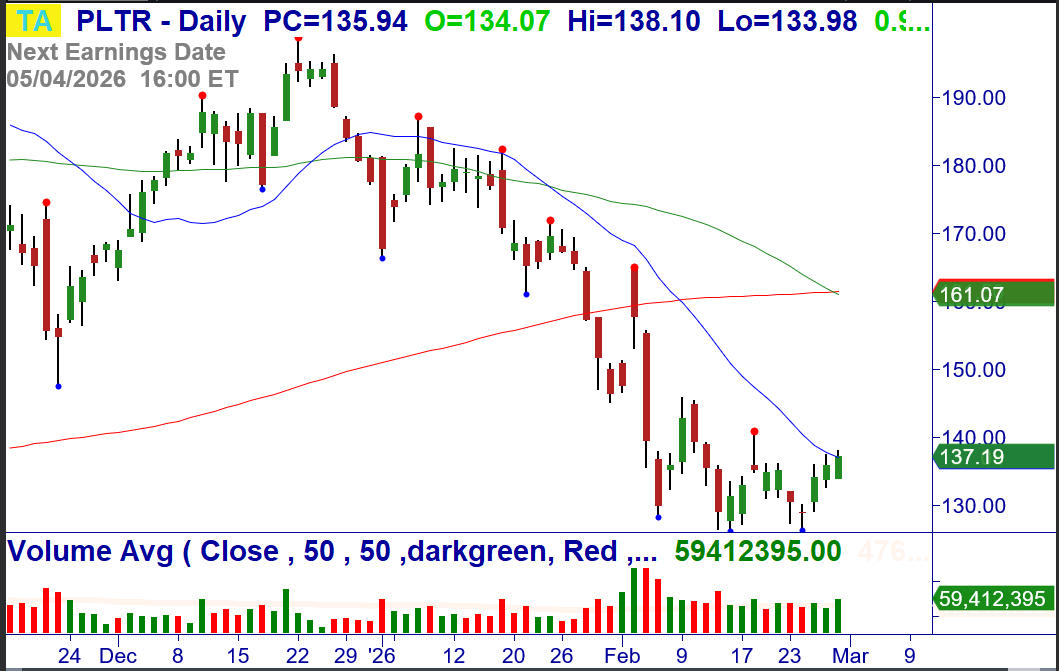
AMS Teaches You How to Maximize Profits on Every Trade. Click Here to Read More
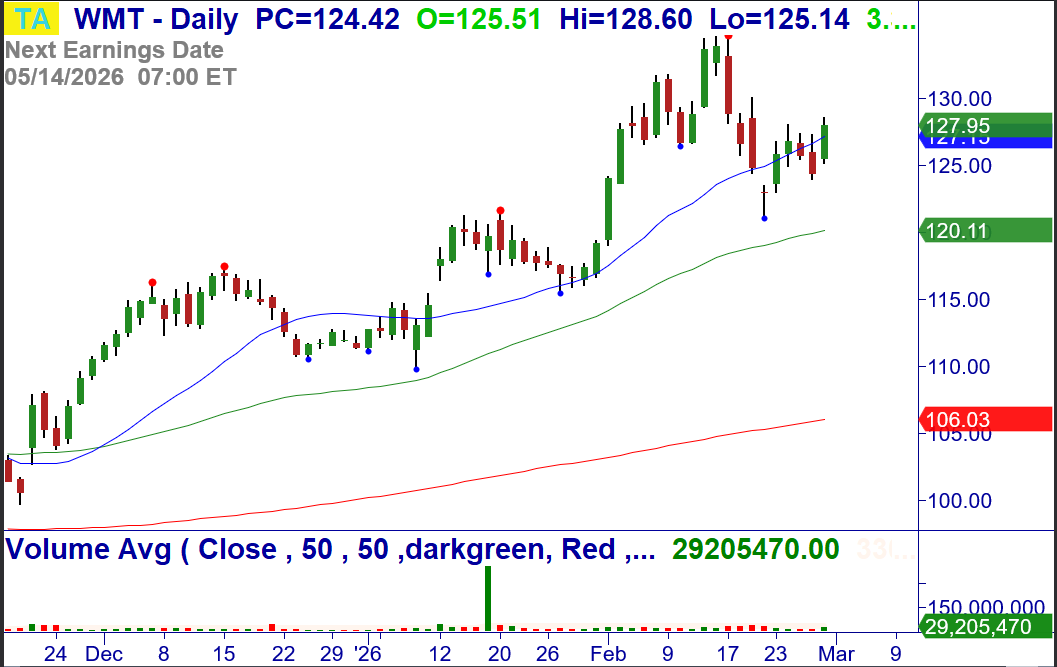
3/2: WMT – Over $128.60, consider buying the stock. Breakout at the 20-MA. Stop $123.68.
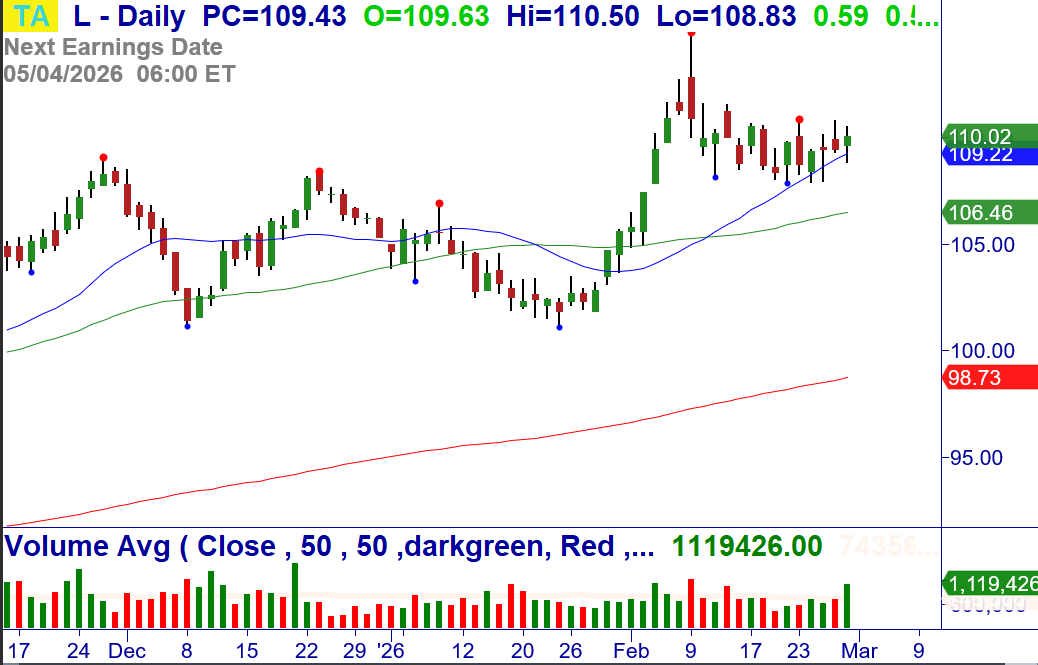
3/2: L – Over $110.43, consider buying the stock. Breakout at the 20-MA. Stop $107.87.
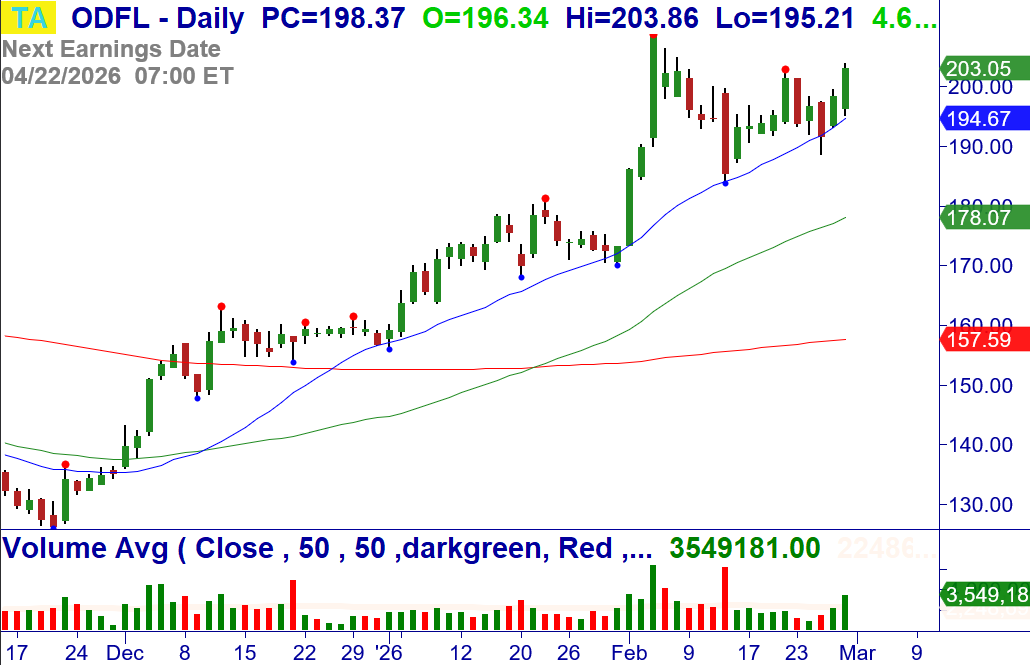
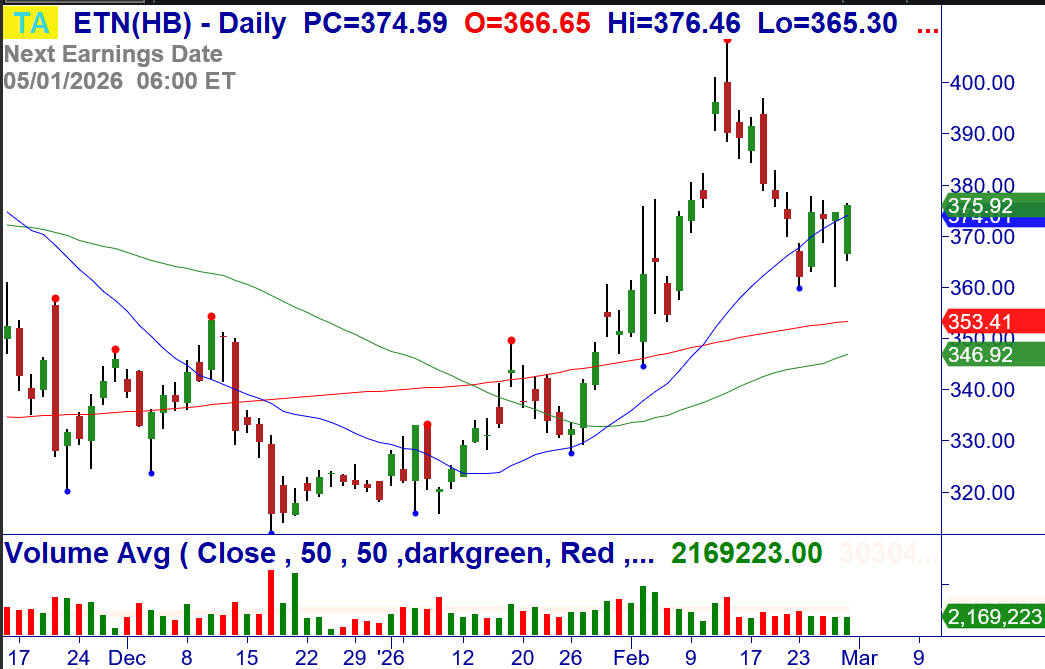
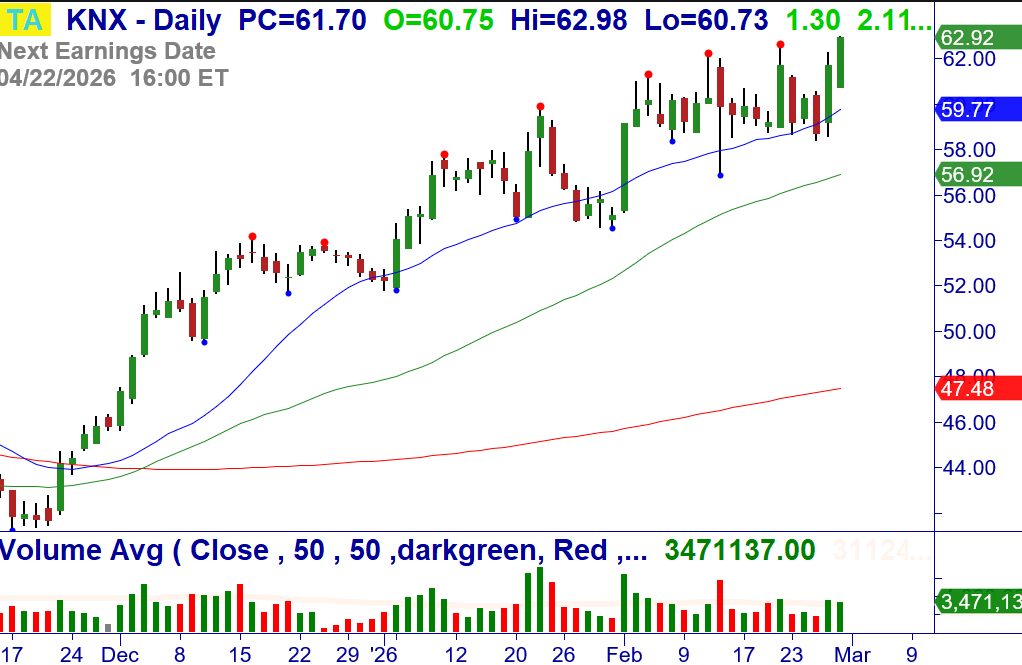
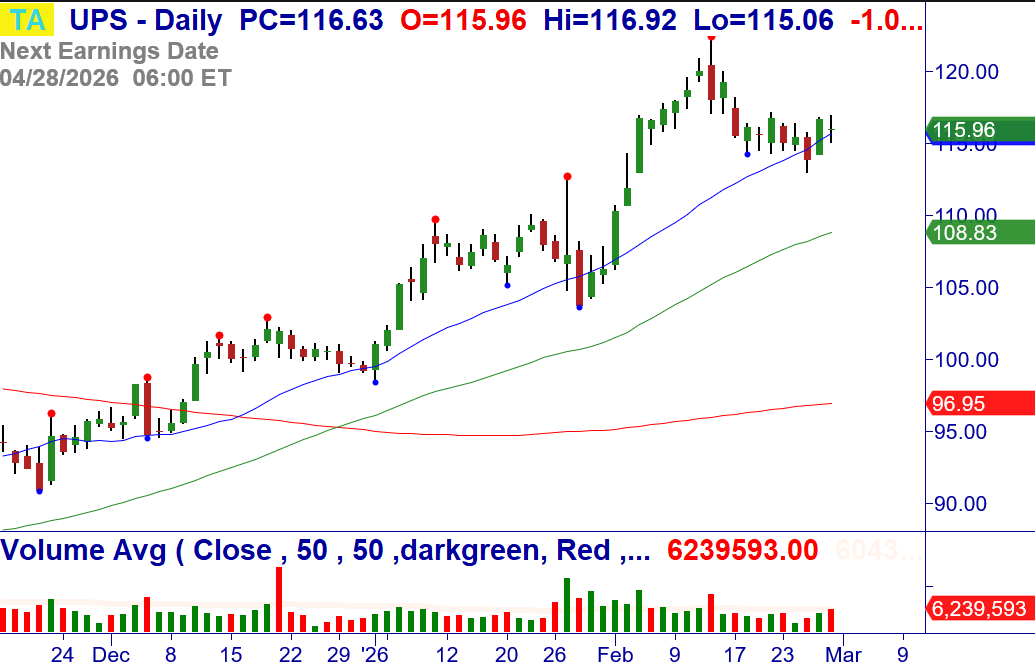
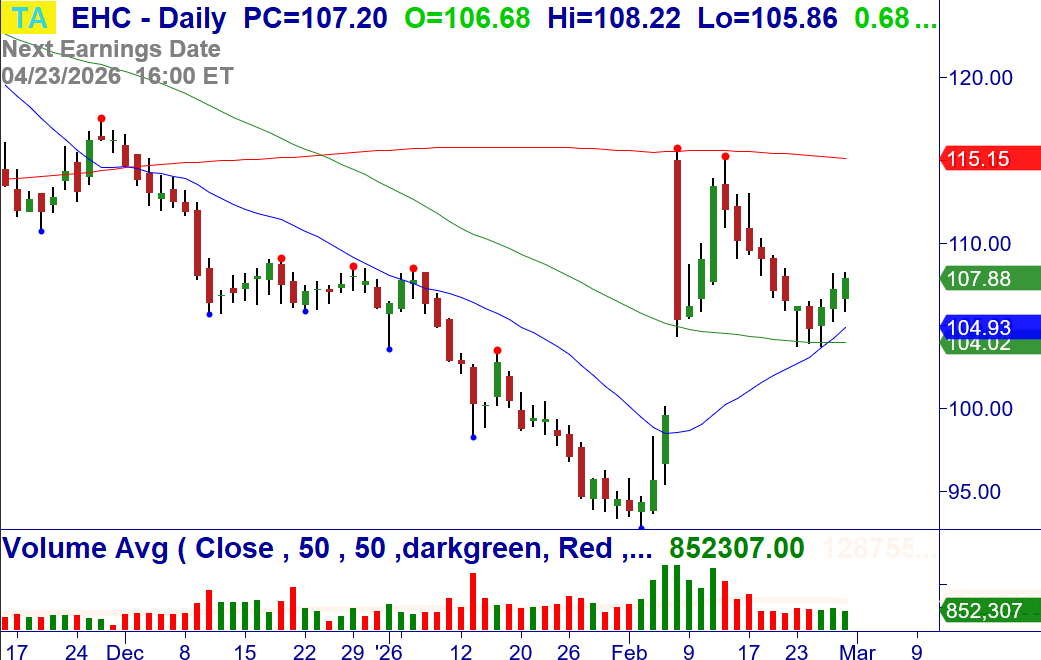
3/2: EHC – Over $108.22, consider buying the stock. Buy Setup and reversal at the 20/50-MA. Stop $103.73.
Money Management for Trading and Investing
Proper money management for investing and Trading starts with position-sizing based on the amount of money you are willing to risk on a signal trade.
CLICK HERE to review these Master Trader Guidelines and Basic Money Management and Position Sizing Table.
NEW OPTIONS TRADING IDEAS
Directional Options Strategies and Debit Spreads for Swing Trading (See the Weekly Options Trader letter, which sells options/spreads for weekly Income that primarily expire in 10 days or less, CLICK HERE)
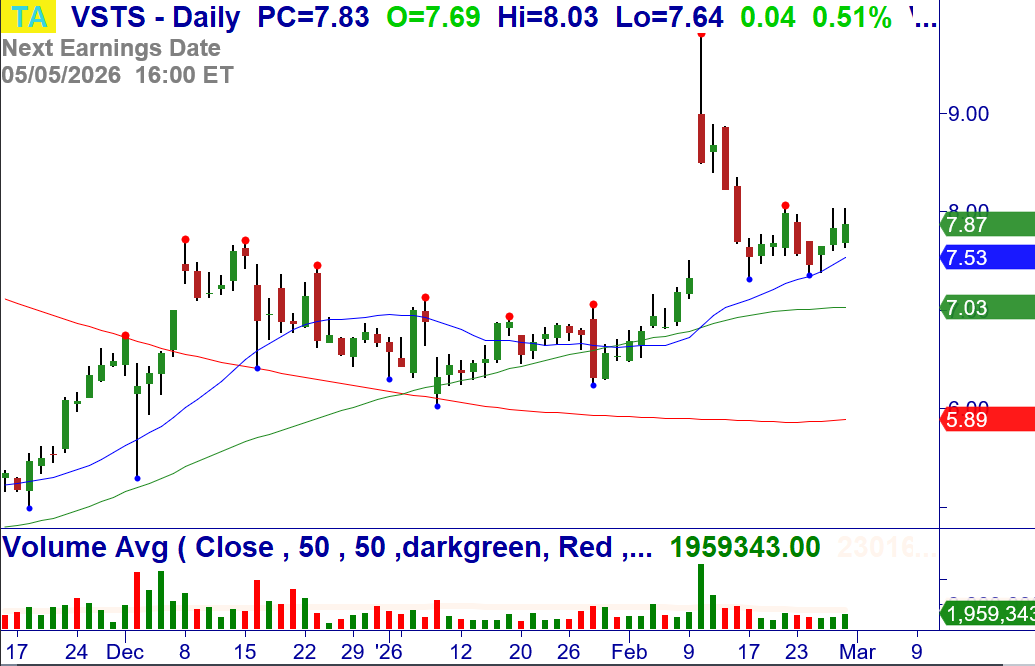
3/2: VSTS – Over $8.03, consider buying Mar (3/20) $7.5 calls for a limit of $.75/share (closed at $.65/share). Breakout after Buy Setup and reversal at the 20-MA. Stop $7.37.
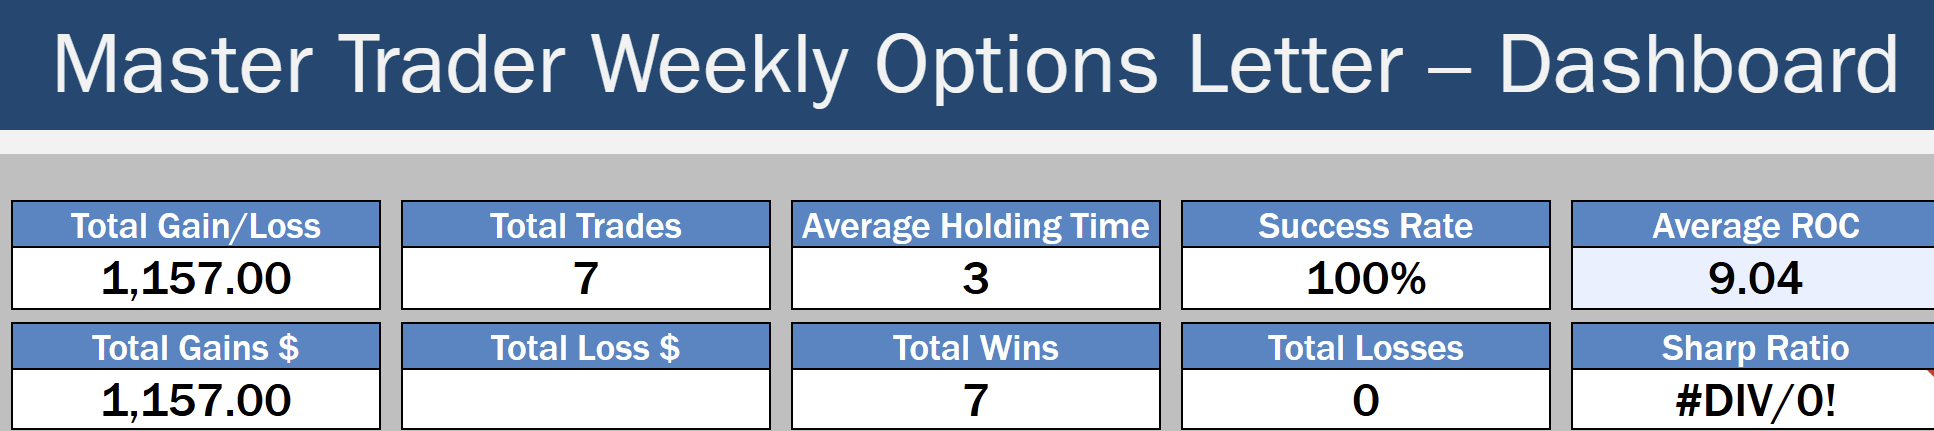
The Master Trader approach to selling credit spreads around technical turning points.
Read about the Weekly Options Trader letter, which sells options/spreads for weekly Income that primarily expire in 10 days or less, around Master Trader technical turning points, CLICK HERE
By selling spreads on stocks and ETFs where MTS indicates the price is unlikely to go, we become the “smart money,” getting paid to take calculated, well-defined risk.
Check out the blog article with more information and monthly results, CLICK HERE
Professional consistency, short-duration trades, and risk-controlled income — that’s what defines the Master Trader approach.
Because your success is vital to you – and us.
Before selling options or credit spreads, we urge you to review the valuable and detailed information that we have provided for you in your Member’s Area Resources.
A quick simplified approach to calculating contract size is to simply base your contract size based on the number of shares permitted in your Trading Plan as if you were trading the stock or ETF. Simple Share Sizing = $ Risk / Stop Loss
The amount of money that you are willing to risk – divided by – the stop loss amount. For example, $100 / .20 = 500 shares. Credit Spread example, if your Trading Plan allowed you to trade 543 shares of AAPL based on the stop loss, then simply round down to the nearest hundred and short an equivalent number of contracts of the option. Since 1 contract represents 100 shares of the underlying, this would be five (5) contracts.
Master Trader and You Building Your Financial Future Together!
Good trading!
If you have any questions or comments, please e-mail Greg Capra at Greg@mastertrader.com or Dan Gibby at Dan@mastertrader.com
All the best,
Greg Capra Managing Director of Master Trader
Dan Gibby Chief Options Strategist
NOTE: Master Trader will show the opening and closing prices of all stock and options trades. We recommend that all traders and investors use proper share sizing for positions and money management. However, we cannot recommend what that is for your particular trading style, risk tolerance, or account balance. We urge you to calculate your own share/position size based on your individualized risk parameters, Trading Plan, and familiarity with the proposed trade strategy and risk. Advanced Management Strategies (AMS) covers in detail foundation and advanced position and money management.
NOTE: Master Trader and its representatives may have existing positions in actual or other trade recommendations before or after suggested herein. Additionally, we may manage them differently for internal purposes based on different risk parameters than noted herein. All trade ideas and content are for informational and educational purposes only. It is not, nor is it intended to be, trading or investment advice or a recommendation that any security, option, or investment strategy is suitable for any person. Trading securities can involve high risk and the loss of any funds. Significant gaps or volatility can increase these losses, particularly for short option strategies. Investment or trading information provided may not be appropriate for all investors, and is provided without respect to individual financial sophistication, financial situation, investing time horizon or risk tolerance. Supporting documentation for any claims (including claims made on behalf of options programs), comparison, statistics, or other technical data, if applicable, will be supplied upon request. Master Trader Consulting, Inc. is not a licensed financial advisor, registered investment advisor, or a registered broker-dealer. Options, futures, and futures options are not suitable for all investors.

