

There was a lot of big news of the week: Trump threatening 100% tariffs on Canadian goods; gold, silver and many metals tanking after setting new highs; the US dollar continuing its selloff Monday and Tuesday; the Federal Reserve holding rates unchanged at Wednesday’s policy announcement; President Trump’s nomination of former Federal Reserve governor Kevin Warsh to succeed Jerome Powell as chair of the central bank (and helped fuel a nasty intra-day selloff on the markets on Thursday followed by a bullish retracement); consumer confidence declining to 84.5 in January, the weakest since 2014; MSFT and the software sector continuing its selloff; and the UNH/HUM sector getting punished on news of lower reimbursement rates; increasing military presence near Iran (and increased threat of possible bombing and a regional war); rising oil prices; many earnings announcement from FAANG companies; and a partial government shutdown started over funding of DHS/ICE.
After all of that news and volatility, the SPY, DIA, QQQ finished little changed although the IWM was weaker, closing down 1.5%.
Over the last two weeks, most indices and sectors have displayed persistently choppy, uneven price action. This is not a market rewarding broad exposure or passive participation. Instead, it is demanding selectivity, timing, and risk control.
Leadership has narrowed, rotations have been abrupt, and reactions to news have been exaggerated in both directions.
That environment persisted last week.
Wednesday was one of the calmer reactions to the FOMC meeting in many years. The Fed kept rates unchanged as expected. Powell said the data no longer justified additional near-term rate cuts. Officials pointed to accelerating growth, moderating inflation pressures, and a more solid labor market, and removed prior language about downside employment risks.
The next rate cut is not expected until the June meeting, which would be under the next Fed chair (Powell’s term ends in May), with a total of two cuts for the year.
Gold and silver gapped to all-time highs on Thursday before tanking. The metals have rocked since 2025 as capital rotated out of fiat currencies and sovereign bonds and into hard assets with the dollar weakness, geopolitical stress, unconscionable U.S. debt from no fiscal discipline, and uncertain U.S. policy.
However, the bubble popped in the short term right from Thursday’s gap higher. A violent selloff sent prices crashing to their biggest one-day dollar decline on record. Silver prices fell 31%, their sharpest drop since March 1980, when the Hunt brothers tried to corner the market.
Regardless of the narrative attached to the move—whether it was Fed speculation or political commentary—the price action itself was textbook: an overextended trend meeting panic liquidation. When markets reach that point, the bullish reasoning is over. It becomes a “sell at any price” event.
Microsoft’s earnings and guidance triggered a sharp drop. The stock gapped lower by nearly 10%, and the damage didn’t stay contained! Software ETFs such as IGV and XSW were dragged into bear-market territory (IGV is more than 20% below its October high), with no meaningful bottoming action evident. That type of price behavior implies further downside risk rather than immediate stabilization.
Bitcoin and Ethereum both broke below two-month support levels. Sideways consolidation since mid-October resolved lower last week, signaling buyer exhaustion. Unless these moves prove to be breakdown failures—and quickly—the path of least resistance points to lower prices, potentially through a waterfall-type decline. As we finalize this report, /BTC is trading at 77,500, a big drop from Friday's price at 4 ET.
Looking ahead, economic data next week—particularly inflation-related reports—could easily act as a catalyst for another short-term swing. If the S&P 500 decisively breaches 6,900, the odds increase for a move toward 6,800.
Internal market gauges remain neutral, which is important. They are not signaling risk-off, but they are not providing a strong tailwind either. Breadth remains below the zero line, confirming that most stocks are underperforming, even as indices hold up.
That divergence is both a warning and an opportunity. If money rotates into laggards, breadth can improve without indices collapsing. If it doesn’t, leadership deterioration becomes more dangerous.
Nothing changes in how we operate. We will continue to trade the same price patterns, manage risk the same way, and let the market—not opinions—tell us when opportunity is present.
If you're not in the Green Room with us, log in to YouTube, Facebook, or Twitter to get our pre-market review at 9 AM ET. If you can't make it, you can view the recording.
Good trading!
Be sure to log into your Member's Area to get connected to text messaging through Telegram -- it's critical to receive timely updates to new trades and trade adjustments! NOTE: New trade ideas included in these emails are not sent in Telegram when they trigger -- only subsequent needed adjustments. Alerts for Targets and Stops triggered are also not sent; it is your responsibility to set alerts and manage them following posted instructions if desired.
NOTE: Please see the document in RESOURCES entitled Master Trader Guidelines for Trading the Open and Gaps.
Because your success is vital to you – and us. Before selling options or credit spreads, we urge you to review the valuable and detailed information that we have provided for you in your Member’s Area.
Basic Money Management A quick simplified approach to calculating contract size is to simply base your contract size based on the number of shares permitted in your Trading Plan as if you were trading the stock or ETF. Simple Share Sizing = $ Risk / Stop Loss The amount of money that you are willing to risk – divided by – the stop loss amount.
For Example, $100 / .20 = 500 shares. Credit Spread example, if your Trading Plan allowed you to trade 543 shares of AAPL based on the stop loss, then simply round down to the nearest hundred and short an equivalent number of contracts of the option. Since 1 contract represents 100 shares of the underlying, this would be five (5) contracts.
Money Management for Trading and Investing
Proper money management for investing and Trading starts with position-sizing based on the amount of money you are willing to risk on a signal trade.
CLICK HERE to review these Master Trader Guidelines and Basic Money Management and Position Sizing Table.
NEW OPTIONS TRADING IDEAS
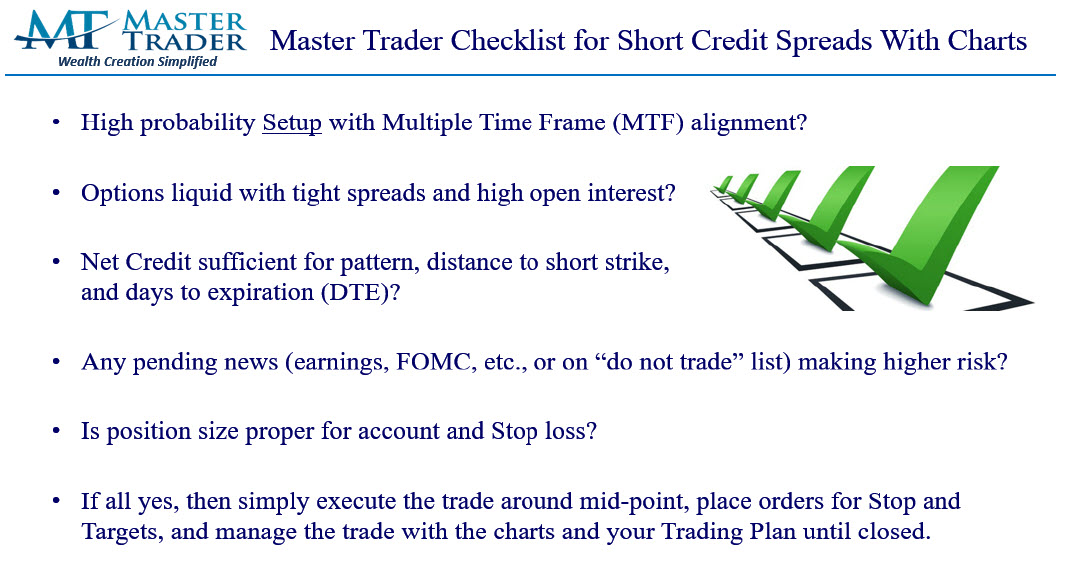
Here's our Checklist for shorting options/spreads using MTS. Spreads have unfortunately been wider than normal recently which is why the number of trades recommended in this letter has been fewer than normal. Additionally, when the VIX is low, the premium received has not been attractive. Most of you also subscribe to our Advisory Swing and Options Letter and, as you can see, we have many Directional ideas.
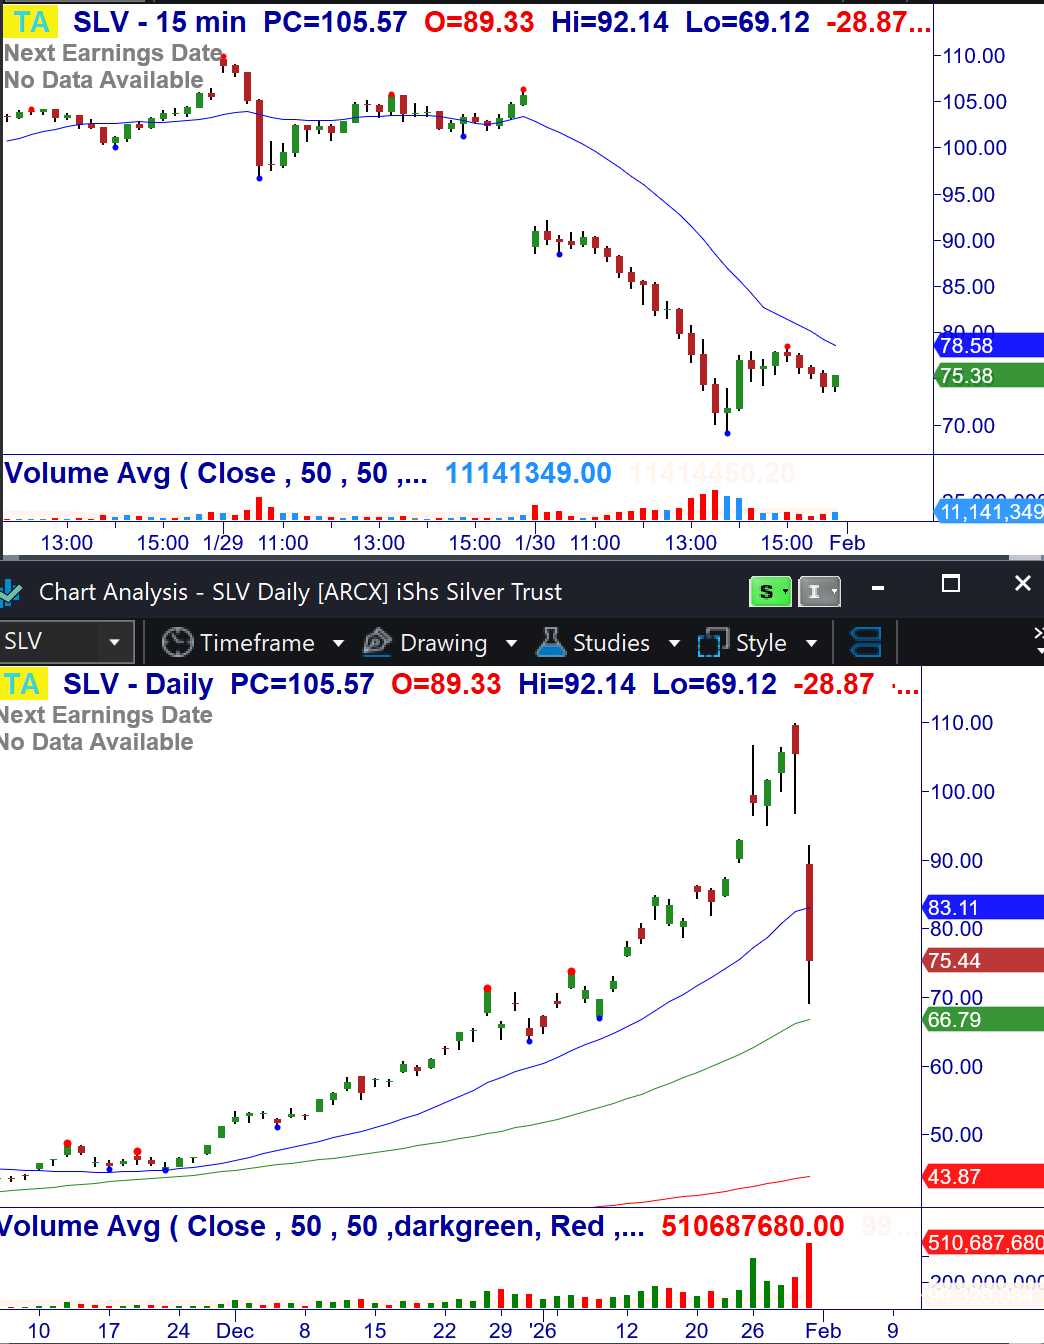
2/2: SLV – Over $78.50 (intra-day resistance), consider shorting Feb (2/2) $69/59 bull put credit spread for a limit of $1.00/share (closed at $1.27/share). Major Selloff to 50-MA, Climactic Buy Setup and reversal on the 15-Min. Stop $68.98 (however, stop out of position if the “debit/cost to close” the spread reaches 2x premium received, which would be $2.00/share in this case, which means that you are not risking more than 1:1).
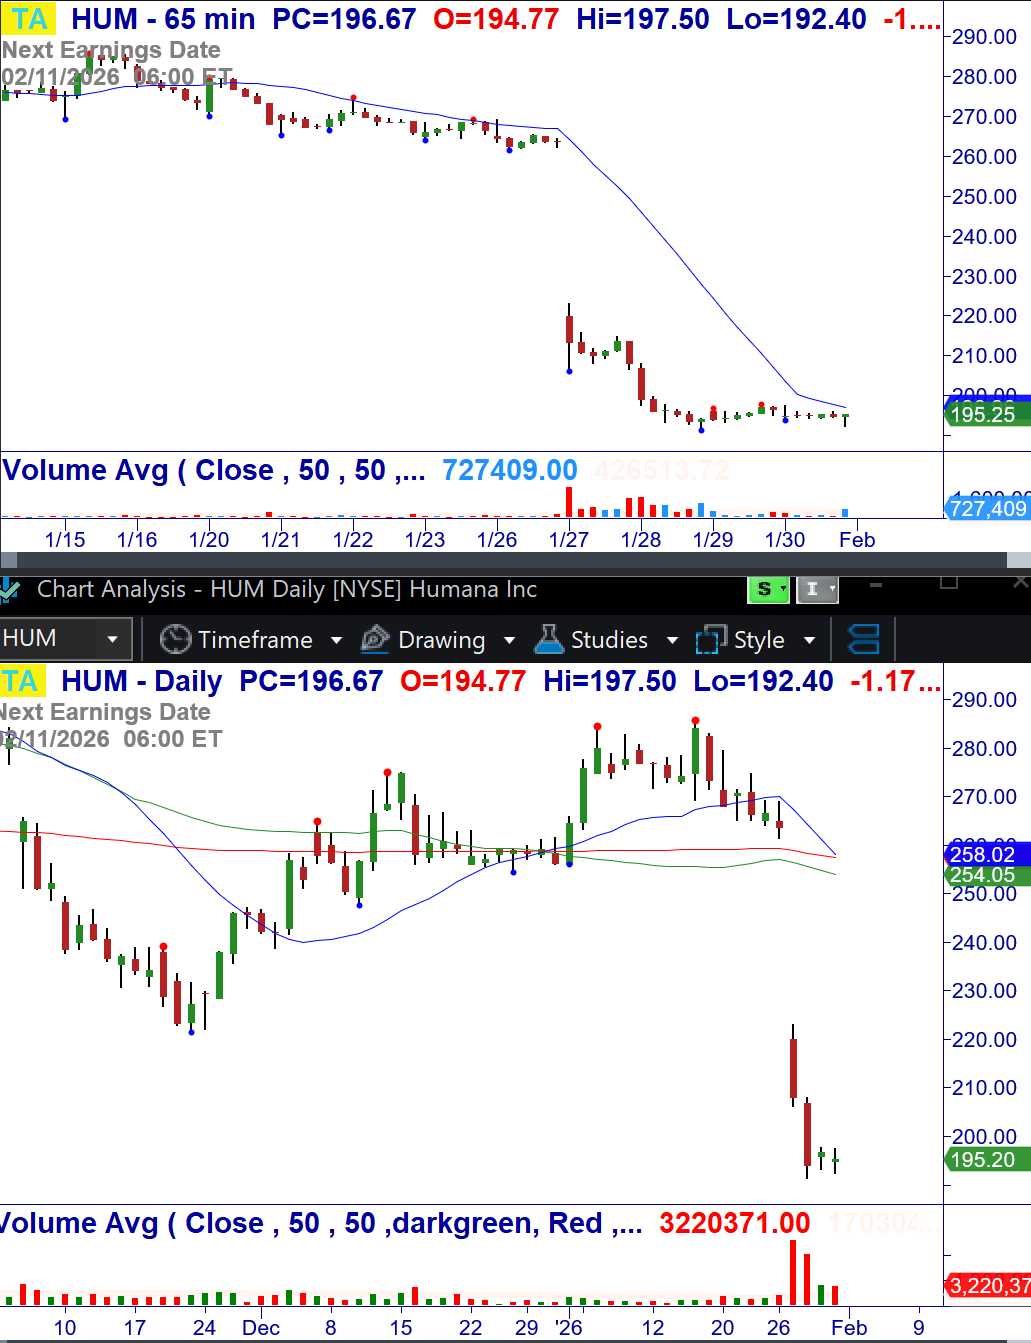
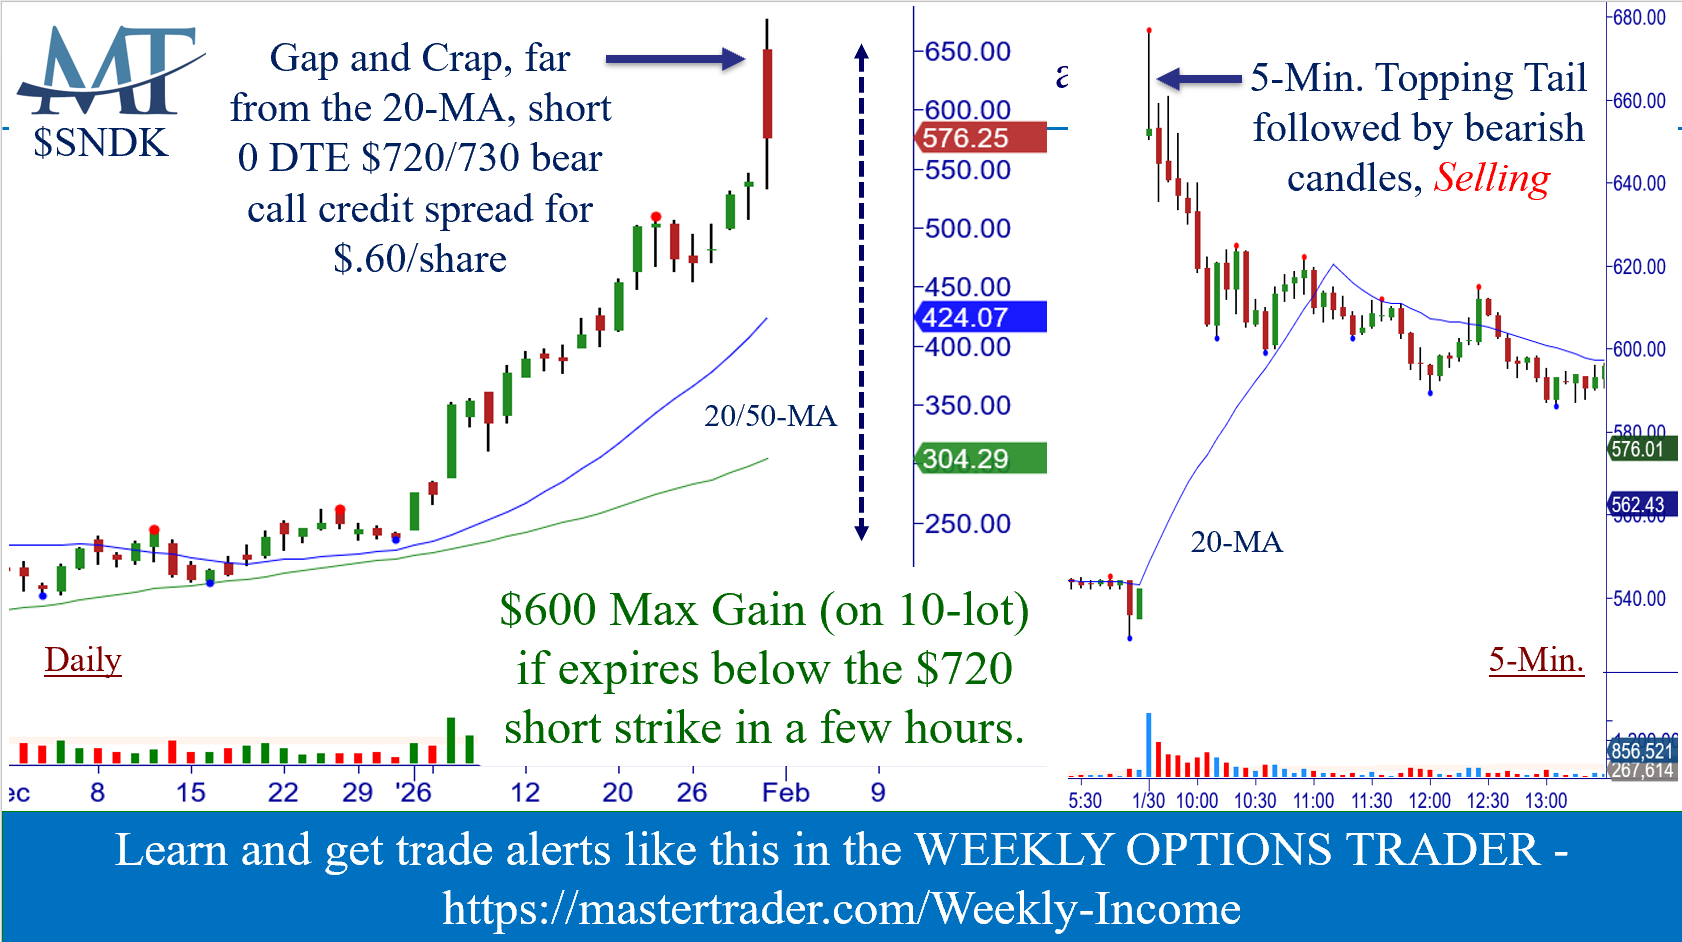
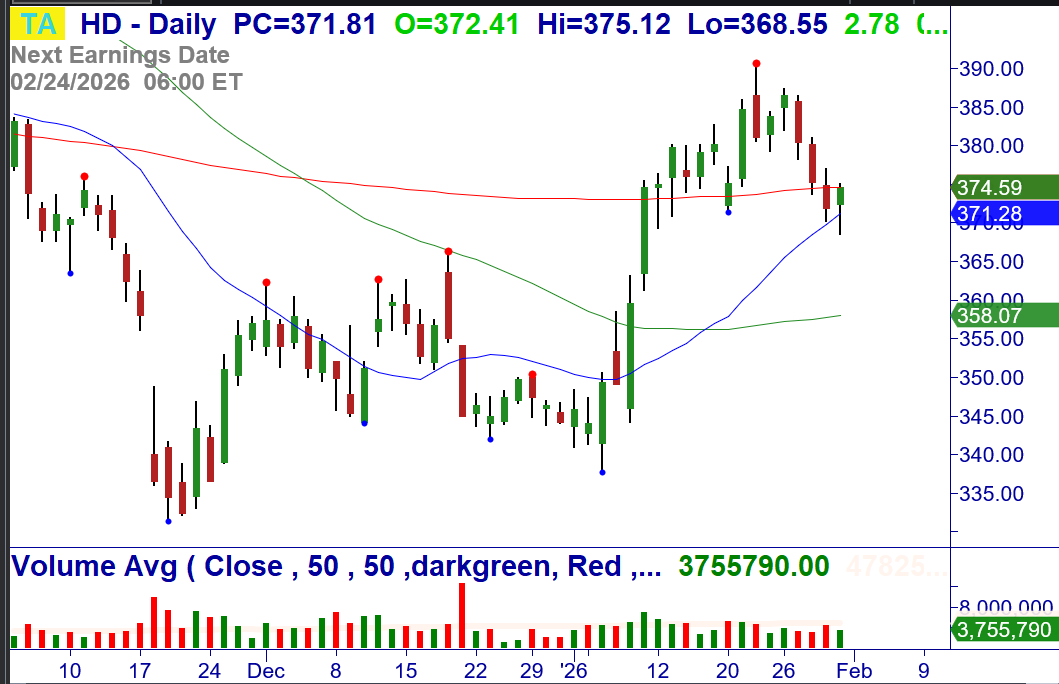
NOTE: We found many compelling patterns for directional trades which are contained in our Advisory Swing and Options Trader, see below. All directional patterns are credit spread CANDIDATES provided they are liquid and have attractive net credit for the DTE. In this case, every one of these unfortunately have illiquid options, preventing us from presenting credit spread ideas.
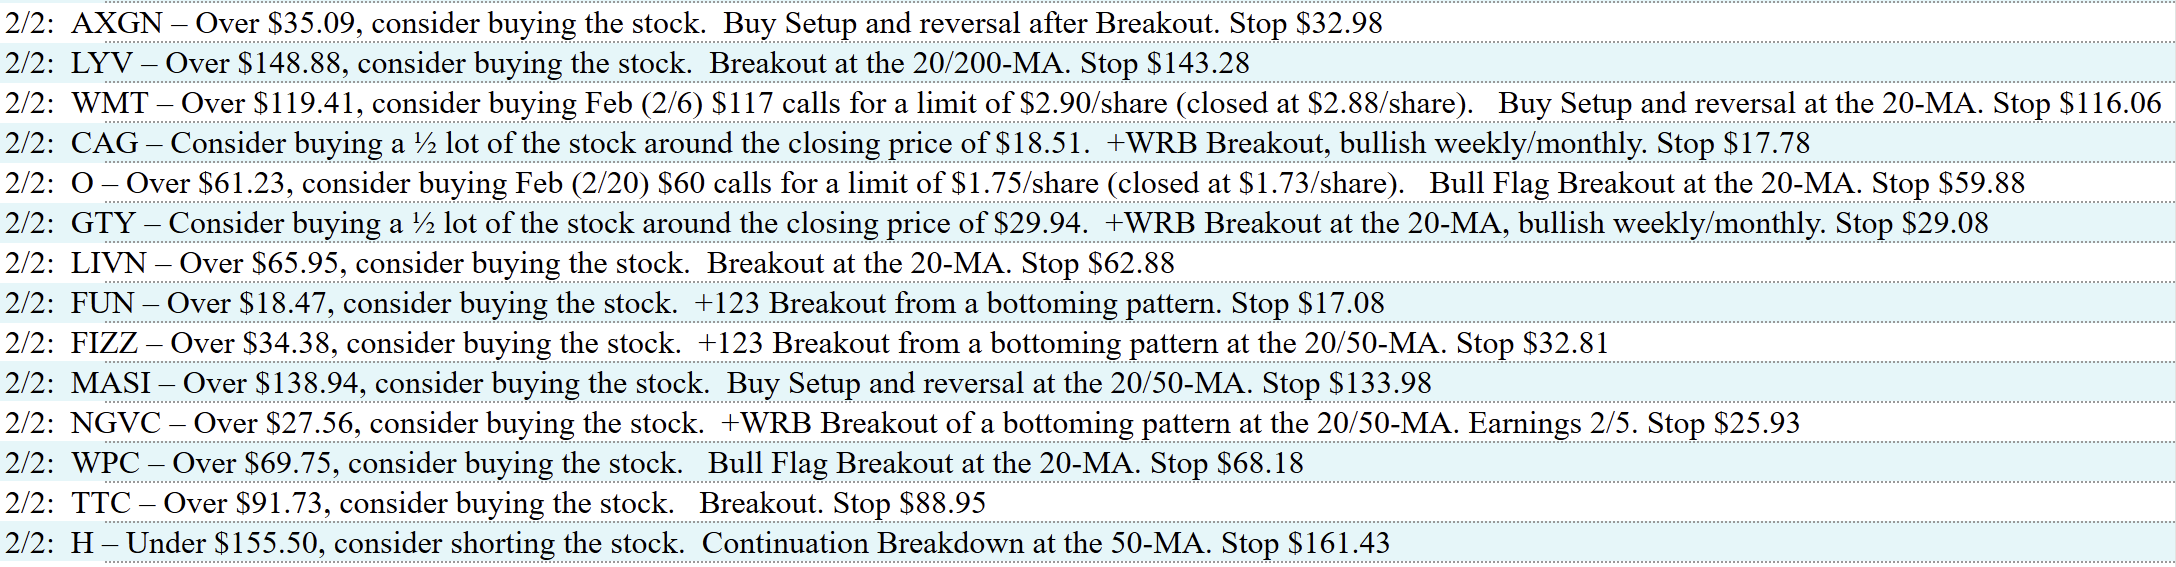
As you know, by selling spreads on stocks and ETFs where MTS indicates price is unlikely to go, we become the “smart money,” getting paid to take calculated, well-defined risk.
Check out the blog article with more information and monthly results, CLICK HERE
Professional consistency, short-duration trades, and risk-controlled income — that’s what defines the Master Trader approach.
Master Trader and You Building Your Financial Future Together!
Happy trading! If you have any questions or comments, please e-mail Greg Capra at Greg@mastertrader.com or Dan Gibby at Dan@mastertrader.com
All the best,
Greg Capra Managing Director of Master Trader
Dan Gibby Chief Options Strategist
NOTE: Master Trader will show the opening and closing prices of all stock and options trades. We recommend that all traders and investors use proper share sizing for positions and money management. However, we cannot recommend what that is for your particular trading style, risk tolerance, or account balance. We urge you to calculate your own share/position size based on your individualized risk parameters, Trading Plan, and familiarity with the proposed trade strategy and risk. Advanced Management Strategies (AMS) covers in detail foundation and advanced position and money management.
NOTE: Master Trader and its representatives may have existing positions in actual or other trade recommendations before or after suggested herein. Additionally, we may manage them differently for internal purposes based on different risk parameters than noted herein. All trade ideas and content are for informational and educational purposes only. It is not, nor is it intended to be, trading or investment advice or a recommendation that any security, option, or investment strategy is suitable for any person. Trading securities can involve high risk and the loss of any funds. Significant gaps or volatility can increase these losses, particularly for short option strategies. Investment or trading information provided may not be appropriate for all investors, and is provided without respect to individual financial sophistication, financial situation, investing time horizon or risk tolerance. Supporting documentation for any claims (including claims made on behalf of options programs), comparison, statistics, or other technical data, if applicable, will be supplied upon request. Master Trader Consulting, Inc. is not a licensed financial advisor, registered investment advisor, or a registered broker-dealer. Options, futures, and futures options are not suitable for all investors.
