

Some of last week’s comments included:
Rotation may continue to shuffle money out of winners and into laggards, keeping the broader indices contained within a range, perhaps a wider one. That type of environment favors selectivity, patience, and disciplined risk management, not prediction. It can be perfect for Credit Spreads.
There will be no shortage of headlines capable of moving markets this week. As always, our focus will remain on price structure, and risk, not opinions.
Rotation continues to define this market environment. Money is being shuffled out of recent winners and into laggards, keeping the broader indices contained within a range, likely a wider one. This is not a “throw-a-dart” market. It favors selectivity, patience, discipline, and, always, risk management.
Environments like this can be ideal for credit spreads, provided risk is respected, but some money is rotated into collapsing, climactic drops like with select software stocks.
There is no shortage of headlines capable of moving markets this week. Our focus remains on price structure and risk, not opinions about the news.
Volatility, Rotation, and Options Expiration Effects
Last week delivered sharp volatility, with significant moves lower that were retraced almost immediately. That behavior aligned well with the previously shared options-expiration chart, which showed that expirations often act as short-term turning points. While the chart does not suggest news caused the volatility, it correctly anticipated a period where a turning point was likely.
A sharp gap lower on Tuesday (January 19) was attributed to escalating geopolitical tensions and renewed trade concerns. President Trump’s initial rhetoric about tariffs on European goods over disputes over Greenland sparked investor anxiety. The Dow dropped over 1% intraday, and the S&P 500 followed suit as markets priced in potential disruptions to global supply chains and earnings.
That selling pressure was compounded by rising Japanese government bond yields, which revived concerns around the yen carry trade and contributed to a broader risk-off tone. However, those fears eased quickly, and markets rebounded sharply over the following days.
It was a classic see-saw—and rotation continued.
Climactic Moves and Trader Psychology
In this environment, beaten-down stocks often become short-term targets as money rotates aggressively. Names such as INTU, META, TTD, TEAM, CRM, WDAY, and DDOG all experienced sharp rebounds from climactic declines. These setups are not for passive traders. They require experience, fast decision-making, and strict adherence to stops.
GoDaddy (GDDY) was a good reminder of the risk. It exhibited a similar pattern but failed to follow through. When it didn’t, disciplined traders exited. That’s how capital is protected.
Many of these climactic drops—particularly in software—are tied to AI-driven disruption across the industry. Automation is reshaping business models, and markets are repricing expectations quickly and violently.
This reinforces an important point that I often mention:
Price patterns are pictures created by traders’ beliefs and expectations about the future.
When a pattern fails to follow through, doubt increases, exits accelerate, and moves often become exaggerated—even before stops are hit.
It is impossible to know in advance which patterns will fail. However, when trading countertrend setups (such as climactic bottoms), exiting early and reassessing can make sense. This is a balance between discipline and awareness. Strong trends get the benefit of the doubt; countertrend trades do not.
USD/JPY Currency Pair
Intermarket Signals: Yen, Dollar, and Commodities
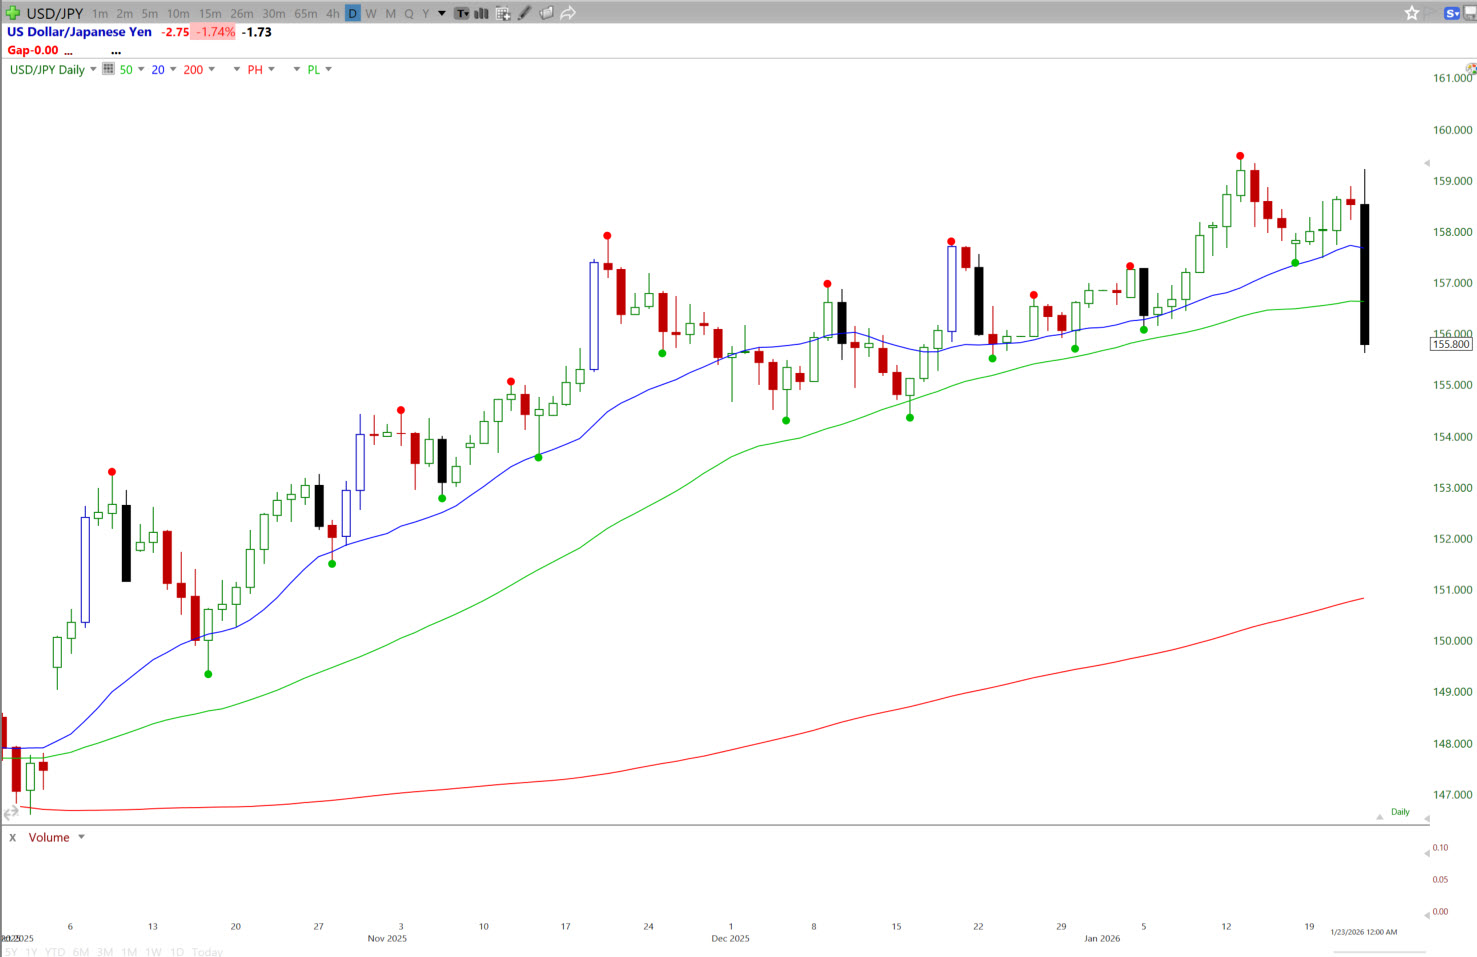
The chart above shows the price action of the US dollar versus the Japanese yen.
Recent attention has focused on the USD/JPY relationship. The yen carry trade—borrowing cheaply in yen to invest in higher-yielding assets—works until interest rates shift. Rising Japanese yields increase borrowing costs, and when leverage is involved, unwinds can be swift and disorderly.
Despite a sharp drop in USD/JPY late last week, U.S. equities largely brushed it off. That doesn’t mean it’s irrelevant—it means it’s something to monitor, not predict. Time will tell whether it becomes a meaningful driver.
Daily Chart of the US Dollar
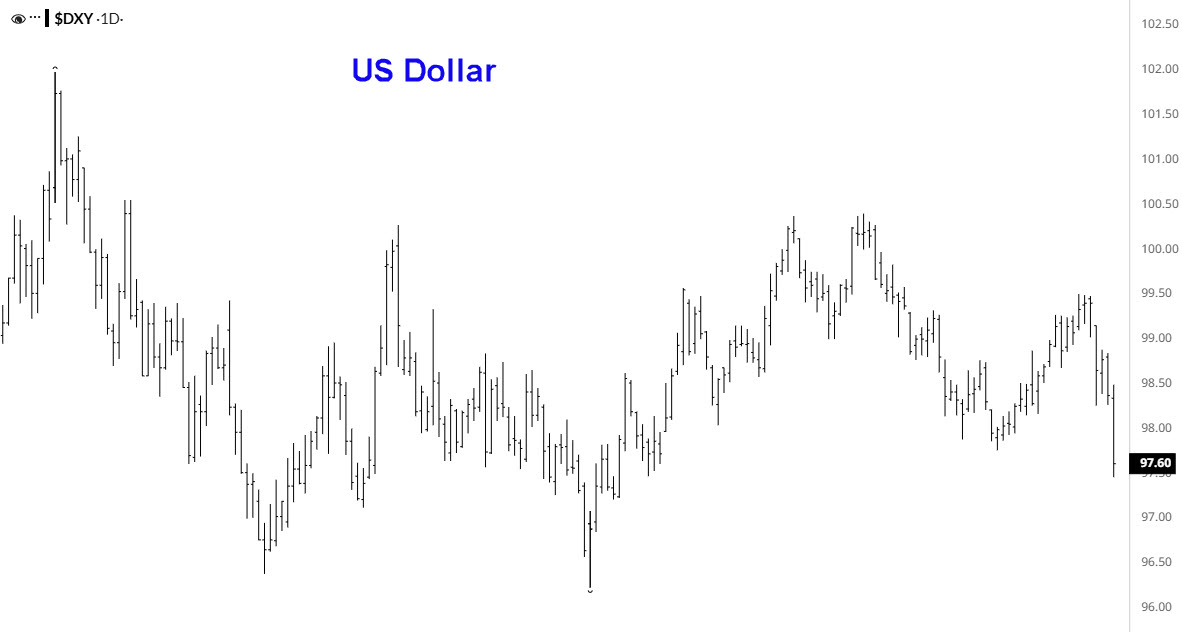
The U.S. dollar also fell sharply against other currencies. A weaker dollar can support U.S. multinationals by making exports more competitive and foreign capital more powerful when converted into dollars. However, it also raises inflation risks by making imported goods more expensive.
Gold and silver have already been rising, responding positively, with the weaker dollar accelerating their intermediate-term advances. Bitcoin and U.S. equities did not react meaningfully—yet.
Inflation, Oil, and Defensive Rotation
Crude oil has been advancing amid geopolitical developments in Venezuela, a falling dollar, and rising intermediate-term interest rates. Together, these raise inflation concerns and reduce the likelihood of near-term Fed action.
In addition, the Materials sector ETF (XLB) began rising strongly last month, and this week, agriculture stocks (MOS, CF, and CTVA) in the sector saw money rotate into them.
That backdrop helps explain the explosive move into Consumer Staples, a sector that had been dead money for a long time. The sharp, nearly vertical advance over the last two weeks looks less like growth chasing and more like defensive rotation.
At the same time, several positives remain firmly in place.
The Russell 2000 and Transportation Index—both long-time laggards—recently pushed to new all-time highs. That improvement in breadth has supported many of our bottoming pattern candidates. Bottoming patterns become particularly relevant when leaders are extended, and capital rotates from strength into weakness.
What This Means Going Forward
Technically, the evidence supports a view that volatility is not going to subside in the near term. The divergence between positives and negatives argues for caution, selectivity, and active management.
This is a market where:
- Rotation dominates
- Leaders pause while laggards play catch-up
- Volatility remains elevated
- Discipline matters more than ever – never about prediction
As always, our focus remains on high-probability patterns, proper position sizing, and respecting stops.
There will be times when the best trade is to sit on our hands.
That, too, is a position.
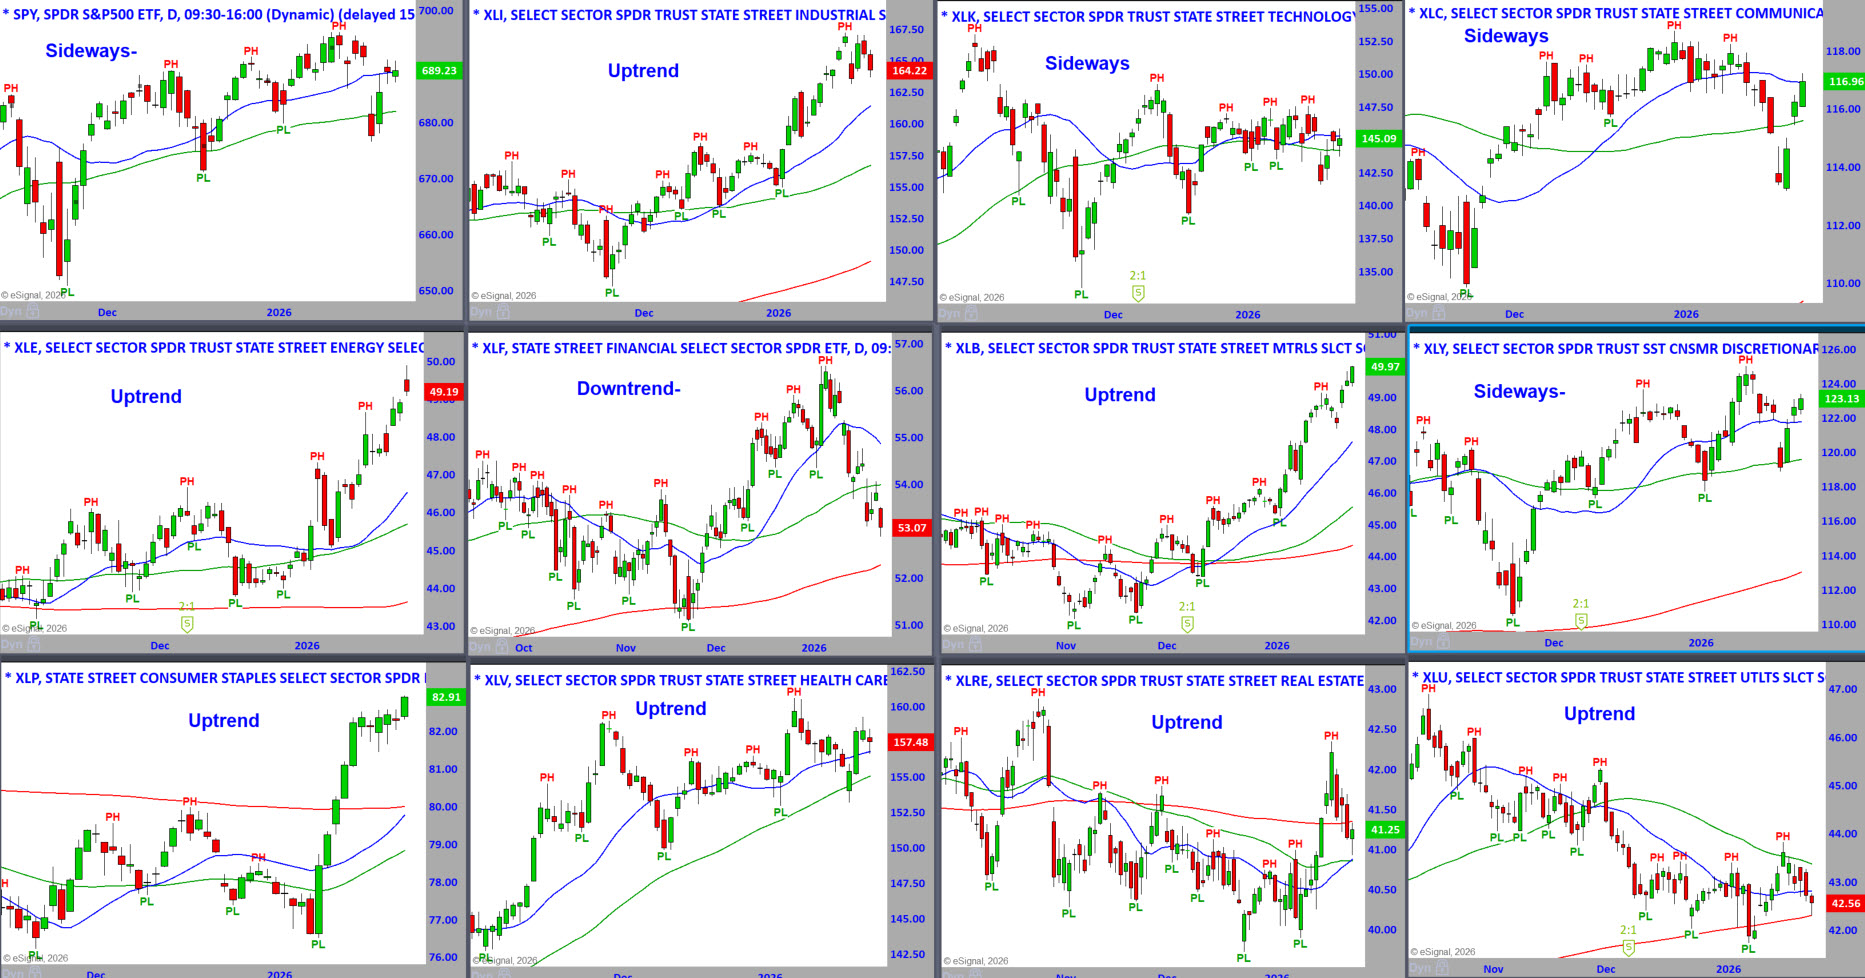
S&P Sector ETFs – Daily Charts - To See a Larger Image,
Right-Click and Press Open in a New Tab
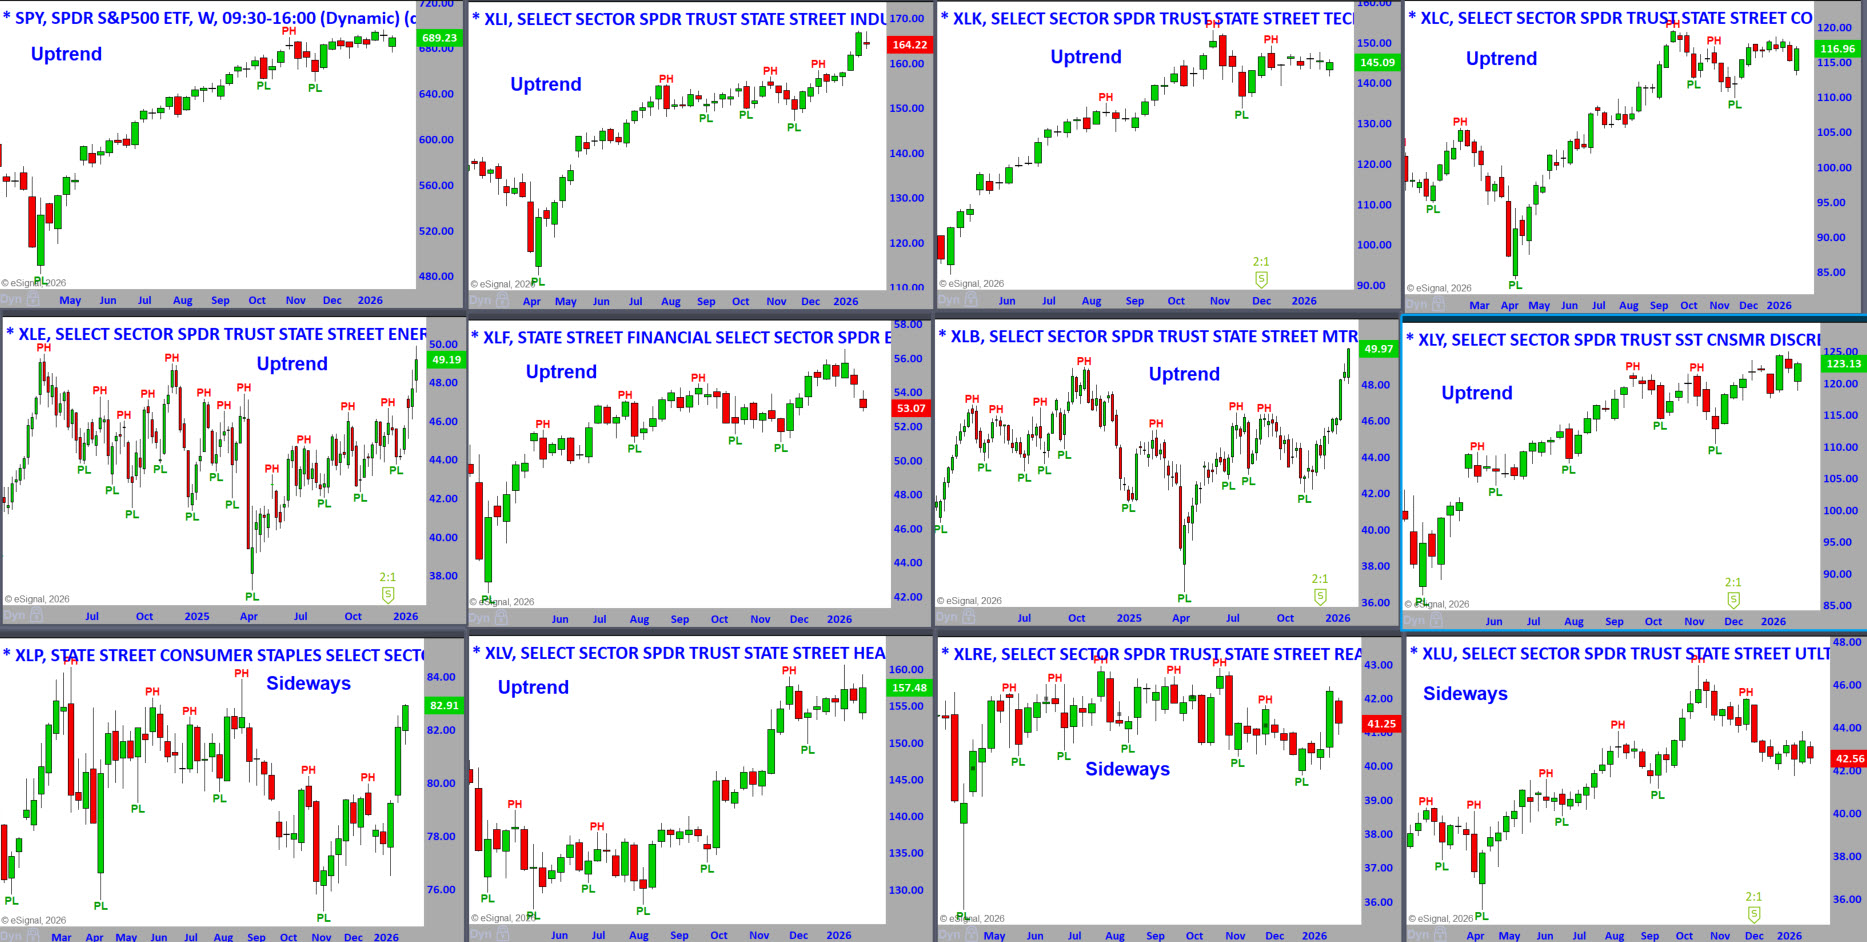
S&P Sector ETFs – Weekly Charts - To See a Larger Image,
Right-Click and Press Open in a New Tab
S&P Sector ETFs – Sorted by Weekly Percent Change This Week
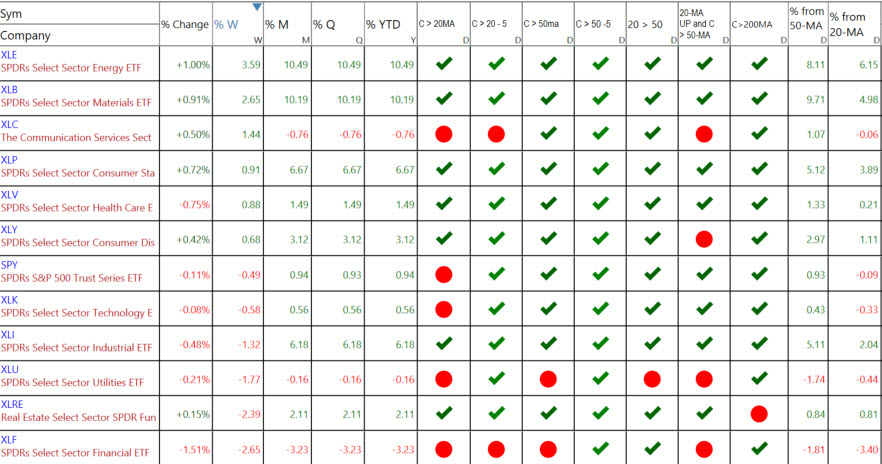
Last week’s percentage changes.
The percentage changes tell you which sectors were the strongest or weakest on Friday and for the week, month, quarter, and year.
There are seven columns after the percent changes in the sector listed above.
You can see the ETFs that are the strongest getting stronger or weakening.
- Close above or below the 20-MA.
- Close above or below the 20-MA 5 Days Ago. C>20 -5
- Close above or below the 50-MA.
- Close above or below the 50-MA 5 Days Ago. C>50 -5
- 20-MA above or below the 50-MA.
- 20-MA is pointed up, and the close is above the 50-MA
Where are the Markets Headed this Week?
The expectation is for continued erratic price movement.
On the positive side, the broader market indexes—the NYSE Composite, Transports, and the Russell 2000—remain in confirmed uptrends. The equally weighted S&P 500 (RSP) is also trending higher, which is encouraging from a participation standpoint.
However, for most indices and sectors, the last two weeks have been persistently choppy and uneven, creating an extremely selective trading environment. This is not a market rewarding broad exposure.
The concerns and headlines already discussed are driving this behavior. These periods always pass, but while uncertainty is elevated, traders are forced to choose between SOH (Sitting on Hands) and the fear of missing an opportunity. That’s simply part of professional risk management.
As I write this, Donald Trump has escalated rhetoric in a brewing trade dispute, warning of potential 100% tariffs on Canadian goods should Canada pursue a trade deal with China.
By the time you read this, that headline—or its market impact—may already be obsolete. That’s the point: news is moving faster than price can be rationalized.
Our internal market gauges remain neutral, but sentiment is drifting toward a bearish extreme. That does not mean it must get there, nor do we try to anticipate it. When sentiment and breadth align at an extreme, we act. Until then, there is no gray area—only patience.
This week also brings a policy decision from the Federal Reserve. Based on data and technicals, the expectation is that rates will remain unchanged. The market’s attention will be squarely on the Chairman’s comments and any nuance around future policy.
Earnings will be another major driver, particularly in technology. Key reports on deck include Microsoft, Apple, Meta, IBM, Lam Research, KLA, and Western Digital.
Outside of tech, Caterpillar also reports—now a meaningful market mover due to its exposure to infrastructure and data-center buildouts.
Nothing changes in how we operate. We will continue to trade the same price patterns, manage risk the same way, and let the market—not opinions—tell us when opportunity is present.
Sometimes that means trading; sometimes it means standing aside. Both are valid positions.
DOW JONES
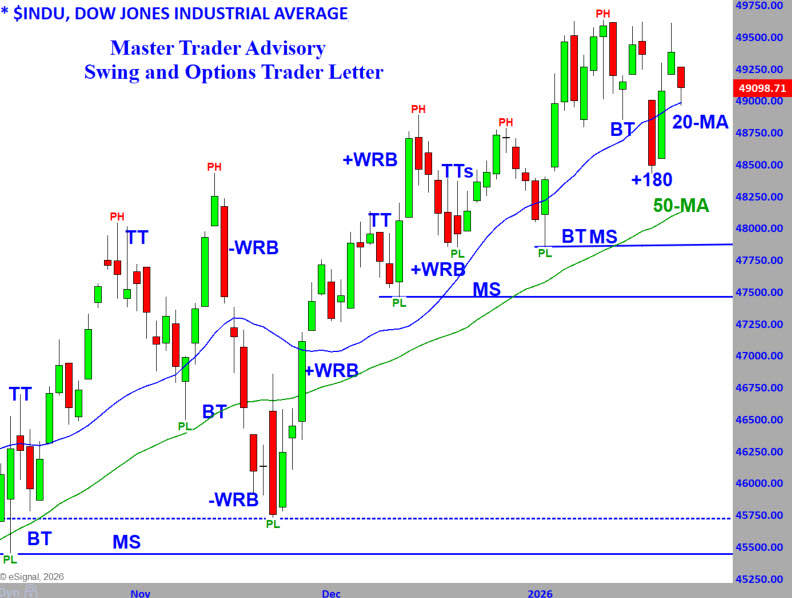
The chart above shows the Dow Jones Industrial Average through the lens of Master Trader Technical Strategies.
The Dow Industrials continue to consolidate within an uptrend, also gapped lower on the President's comments and recovered as he backed away.
There is always news that can move a market in the short term, and that could be a whipsaw or the start of a trend change. We give the trend the benefit of the doubt.
Applying what we know, based on our method and trading plan, keeps us out of harm's way and sane.
Whippy price action, which is defined by overlapping bars, many with tails and gaps between bars, is avoided – don’t trade those charts.
The gap lower last week was caused by the news and a reversal up on new news, a +180 reversal. Yep, it’s nuts!
Prices are at the top of the range (resistance), and we’ll see the reaction to it this week.
Applying Bar-by-Bar, we saw an initial reaction on Thursday (a minor Topping Tail (TT)) and, on Friday, a down bar.
Overall, an uptrend with sloppy price action over the last two weeks.
We’re waiting for price action to tighten.
VIDEO REVIEW OF MARKETS, SECTORS AND INTERNALS - Click lower right to open Full Screen.
NEW STOCK TRADING IDEAS Below
NOTE: Please see the document in RESOURCES entitled Master Trader Guidelines for Trading the Open and Gaps.
Note on Position Size Calculation in the Open Trades Sheet:
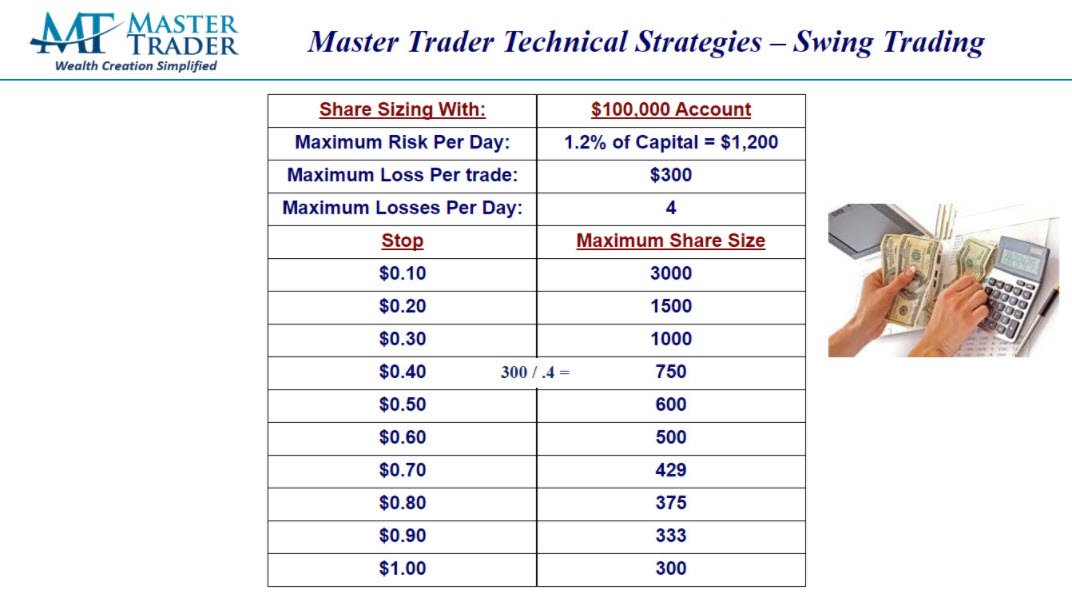
All trades are based on a hypothetical Max Loss of $300/trade. For Stocks, that is $300 / (Entry - Stop). Directional option trades use the same formula, then divided by 100, rounded down to the nearest whole number, with a minimum of one (1).
The “Master Trader Blended Method” for shorting options/spreads size starts with the stock position size, multiplying by 1.5, then divide by 100 because 1 contract represents 100 shares.
A number of our suggested trades have larger stops because of Friday's expanded volatility. Please calculate position size according using your Max Loss per your Trading Plan.
Here's an example:
AMS Teaches You How to Maximize Profits on Every Trade. Click Here to Read More
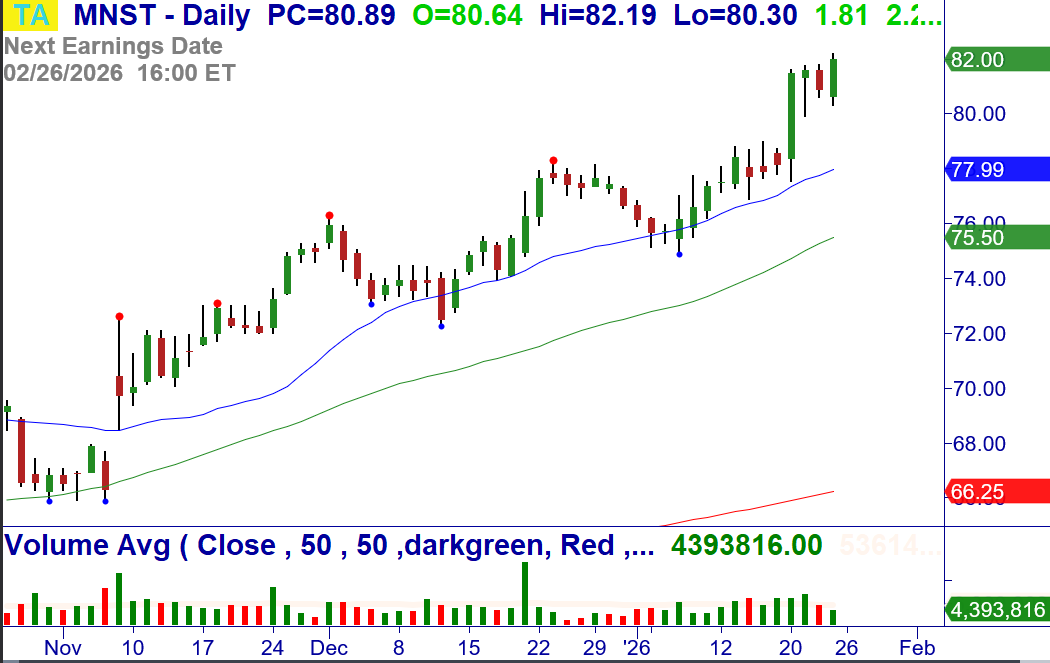
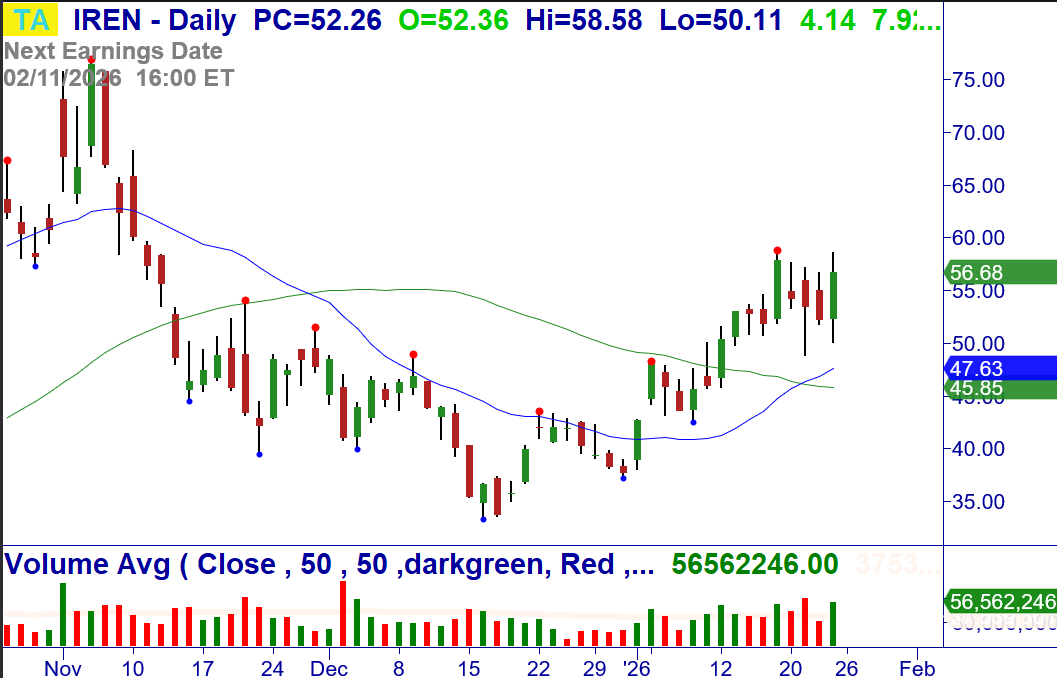
1/26: IREN – Over $58.58, consider buying the stock. Breakout, bullish weekly/monthly. Stop $49.98.
Money Management for Trading and Investing
Proper money management for investing and Trading starts with position-sizing based on the amount of money you are willing to risk on a signal trade.
CLICK HERE to review these Master Trader Guidelines and Basic Money Management and Position Sizing Table.
NEW OPTIONS TRADING IDEAS
Directional Options Strategies and Debit Spreads for Swing Trading (See the Weekly Options Trader letter, which sells options/spreads for weekly Income that primarily expire in 10 days or less, CLICK HERE)
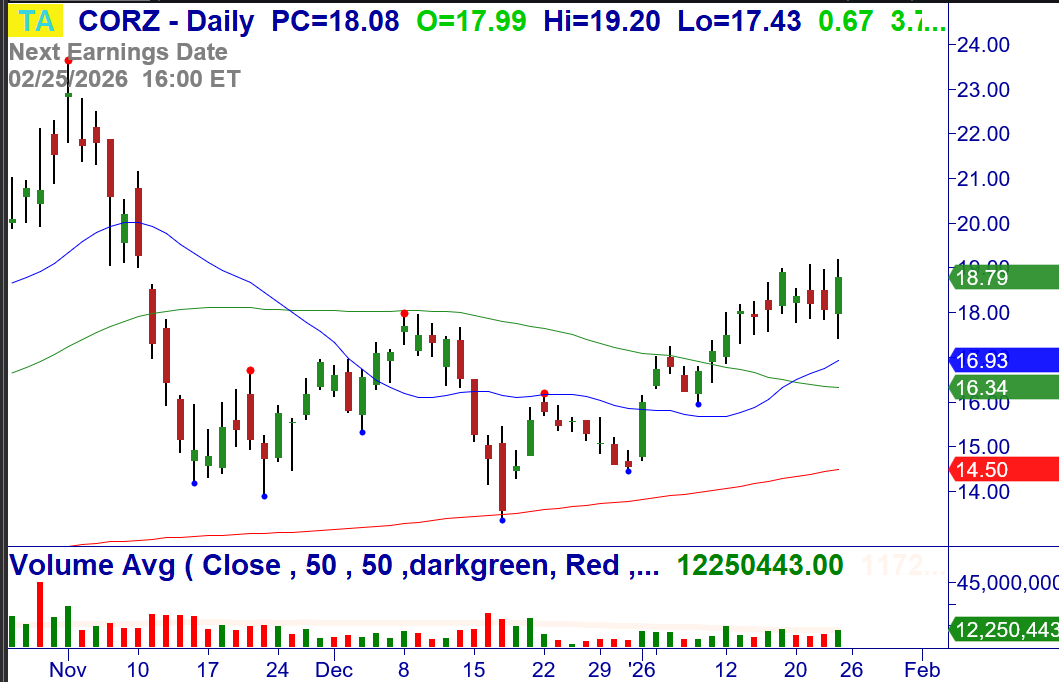
1/26: CORZ – Over $19.20, consider buying Jan (1/30) $17.5 calls for a limit of $1.95/share (closed at $1.71/share). Breakout, bullish weekly/monthly. Stop $17.38.
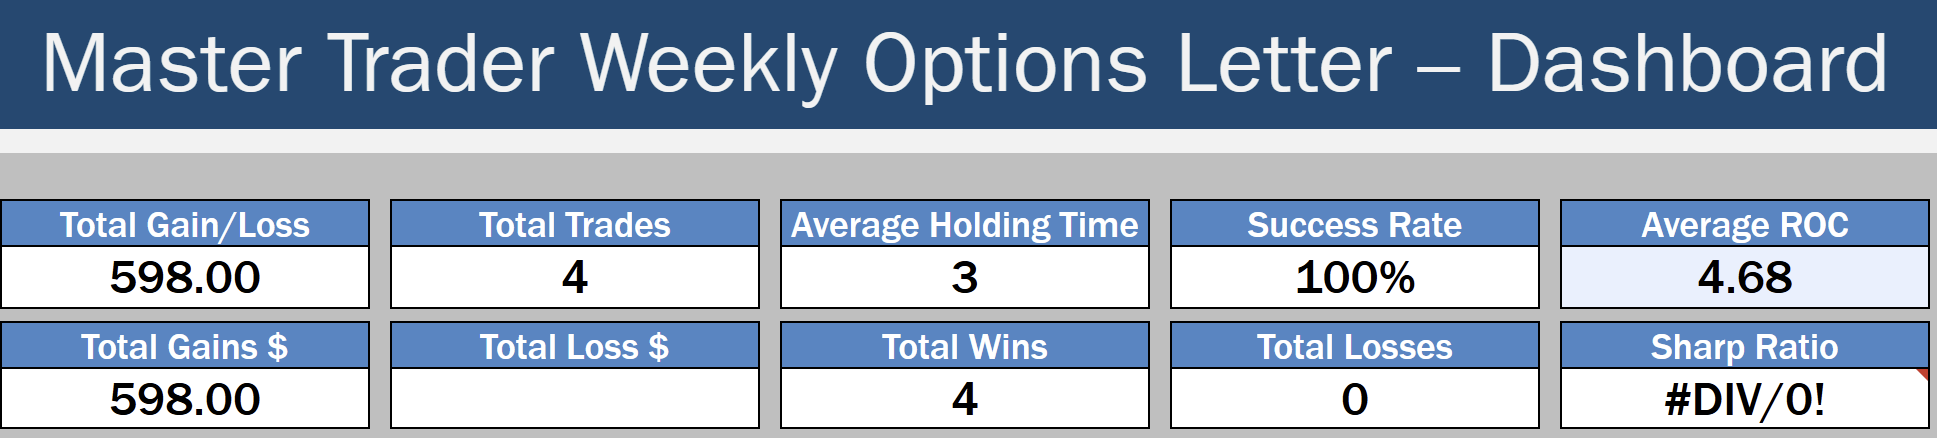
The Master Trader approach to selling credit spreads around technical turning points.
Read about the Weekly Options Trader letter, which sells options/spreads for weekly Income that primarily expire in 10 days or less, around Master Trader technical turning points, CLICK HERE
By selling spreads on stocks and ETFs where MTS indicates price is unlikely to go, we become the “smart money,” getting paid to take calculated, well-defined risk.
Check out the blog article with more information and monthly results, CLICK HERE
Professional consistency, short-duration trades, and risk-controlled income — that’s what defines the Master Trader approach.
Because your success is vital to you – and us.
Before selling options or credit spreads, we urge you to review the valuable and detailed information that we have provided for you in your Member’s Area Resources.
A quick simplified approach to calculating contract size is to simply base your contract size based on the number of shares permitted in your Trading Plan as if you were trading the stock or ETF. Simple Share Sizing = $ Risk / Stop Loss
The amount of money that you are willing to risk – divided by – the stop loss amount. For example, $100 / .20 = 500 shares. Credit Spread example, if your Trading Plan allowed you to trade 543 shares of AAPL based on the stop loss, then simply round down to the nearest hundred and short an equivalent number of contracts of the option. Since 1 contract represents 100 shares of the underlying, this would be five (5) contracts.
Master Trader and You Building Your Financial Future Together!
Good trading!
If you have any questions or comments, please e-mail Greg Capra at Greg@mastertrader.com or Dan Gibby at Dan@mastertrader.com
All the best,
Greg Capra Managing Director of Master Trader
Dan Gibby Chief Options Strategist
NOTE: Master Trader will show the opening and closing prices of all stock and options trades. We recommend that all traders and investors use proper share sizing for positions and money management. However, we cannot recommend what that is for your particular trading style, risk tolerance, or account balance. We urge you to calculate your own share/position size based on your individualized risk parameters, Trading Plan, and familiarity with the proposed trade strategy and risk. Advanced Management Strategies (AMS) covers in detail foundation and advanced position and money management.
NOTE: Master Trader and its representatives may have existing positions in actual or other trade recommendations before or after suggested herein. Additionally, we may manage them differently for internal purposes based on different risk parameters than noted herein. All trade ideas and content are for informational and educational purposes only. It is not, nor is it intended to be, trading or investment advice or a recommendation that any security, option, or investment strategy is suitable for any person. Trading securities can involve high risk and the loss of any funds. Significant gaps or volatility can increase these losses, particularly for short option strategies. Investment or trading information provided may not be appropriate for all investors, and is provided without respect to individual financial sophistication, financial situation, investing time horizon or risk tolerance. Supporting documentation for any claims (including claims made on behalf of options programs), comparison, statistics, or other technical data, if applicable, will be supplied upon request. Master Trader Consulting, Inc. is not a licensed financial advisor, registered investment advisor, or a registered broker-dealer. Options, futures, and futures options are not suitable for all investors.

