

The S&P 500, Dow and Nasdaq were down fractionally on the week (less than 1%), while the Russell 2000 made new highs, signaling a broadening of participation beyond mega-cap technology.
Banks started off earnings season with mixed results, although GS and MS, rocked to all-time highs.
One of the more important observations this week was that the Magnificent Seven ETF (MAGS) continues to be one of the weakest-looking charts and looks lower. Many software stocks got killed so we will be monitoring for climactic setups.
With many stocks extended in the short term, the risk of consolidation or a pullback is rising. At the same time, stocks that have already been weak may not be finished moving lower if broader markets soften.
Those trapped in sideways ranges that were unable to participate during recent strength are particularly vulnerable during any short-term market weakness. Sideways markets tend to resolve with force, and laggards rarely get a free pass when pressure appears.
Quality patterns, along with MTS Position and Money Management, will always put us in the best position.
Importantly, our internal market gauges have not shifted to risk-off. Sentiment remains neutral, which leaves room for additional intermediate-term upside. That said, short-term corrections are inevitable. They always are.
Adding to the possibility of near-term adjustment was the decisive move higher in interest rates last week. On Friday, the 3-month, 2-year, 5-year, and 10-year Treasury yields all pushed higher together. The message from the bond market was clear: the Fed is not in a hurry to cut.
Fed cuts are liquidity, and liquidity is what markets thrive on. When the belief that another cut is imminent fades, the “party mode” can change quickly, and markets begin to adjust rather than accelerate.
Whether the move in yields—driven by bond selling—is a function of higher inflation expectations, stronger economic growth, or a mix of both, will be clarified over time. What matters right now is that the bond market, which had been indecisive and choppy for weeks, is finally resolving its indecision.
Rotation may continue to shuffle money out of winners and into laggards, keeping the broader indices contained within a range, perhaps a wider one. That type of environment favors selectivity, patience, and disciplined risk management, not prediction. It can be very good for Credit Spreads.
There will be no shortage of headlines capable of moving markets this week. As always, our focus will remain on price, structure, and risk, not opinions.
Earnings continue, shifting focus from banks to Netflix, Intel, Johnson & Johnson, GE, and United Airlines. The heavyweight tech names—Apple, Microsoft, Meta, Tesla—come later in the month.
On the macro side, PCE inflation (Thursday) is the key report, along with GDP growth and jobless claims. Markets are currently pricing roughly 50 basis points of rate cuts in 2026, so surprises here matter.
The World Economic Forum runs all week, and yes—AI will dominate the conversation.
There’s also the lingering possibility of a Supreme Court ruling on tariffs, which has been delayed twice already. The administration sounds confident. Markets will decide whether that confidence is justified.
If you're not in the Green Room with us, log in to YouTube, Facebook, or Twitter to get our pre-market review at 9 AM ET. If you can't make it, you can view the recording.
Good trading.
TREND MATRIX
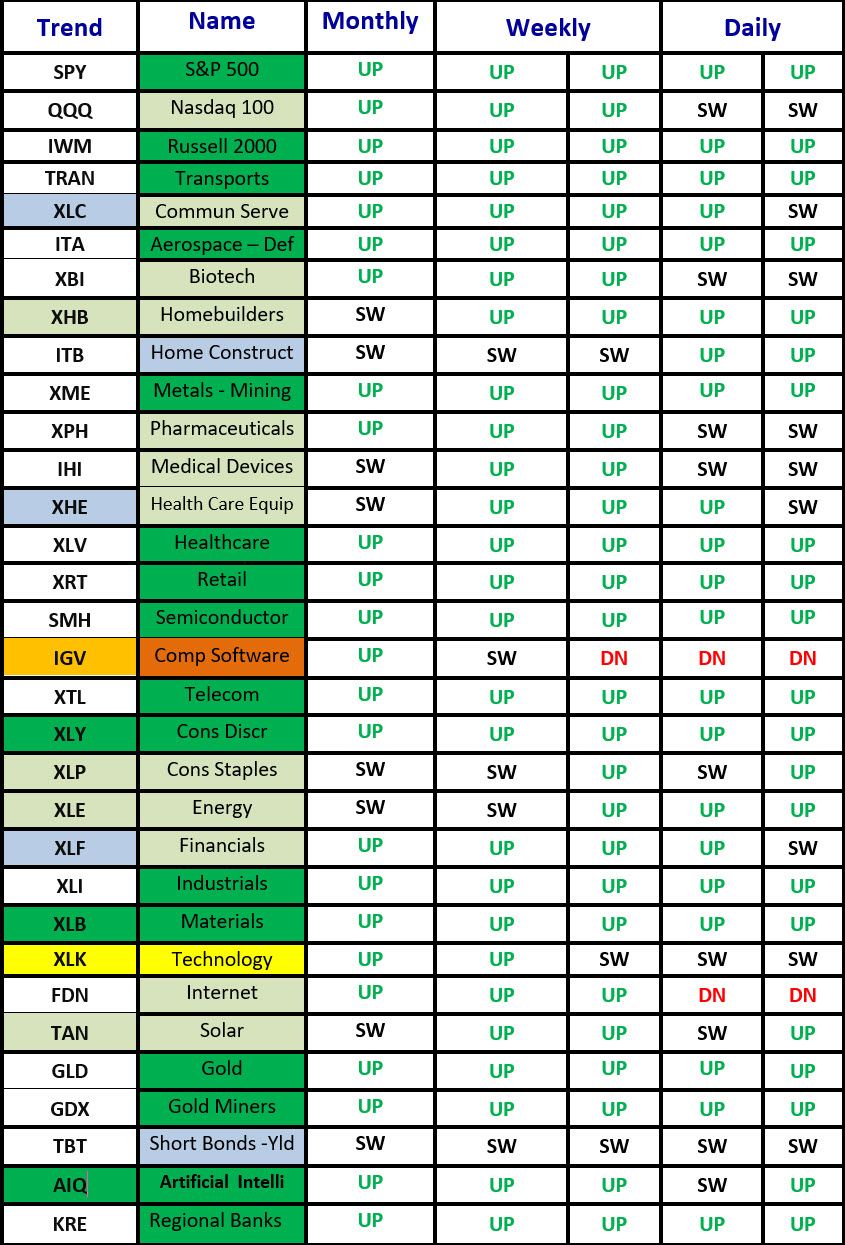
I reviewed the Trend Matrix in the video below
S&P Sector ETFs – Sorted by Weekly Percent Change
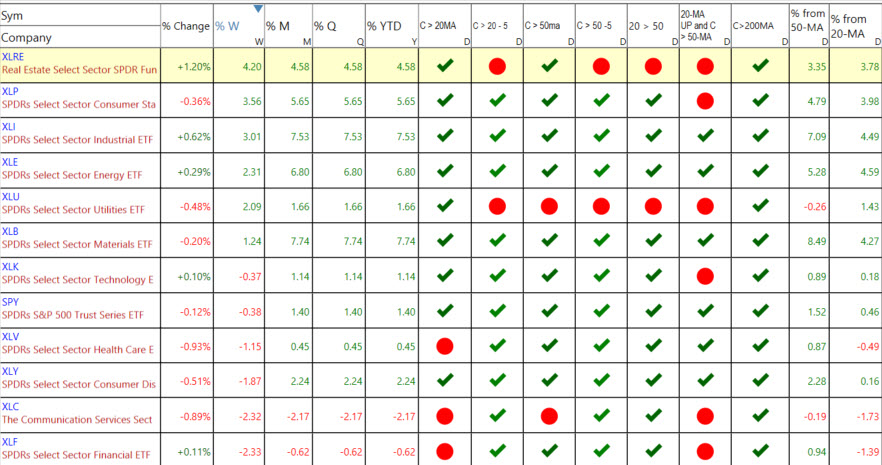
Last week’s percentage changes.
The percentage changes tell you which sectors were the strongest or weakest on Friday and for the week, month, quarter, and year.
There are seven columns after the percent changes in the sector listed above.
You can see the ETFs that are the strongest getting stronger or weakening.
- Close above or below the 20-MA.
- Close above or below the 20-MA 5 Days Ago. C>20 -5
- Close above or below the 50-MA.
- Close above or below the 50-MA 5 Days Ago. C>50 -5
- 20-MA above or below the 50-MA.
- 20-MA is pointed up, and the close is above the 50-MA
Other ETF Sectors – Sorted by Weekly Percent Change
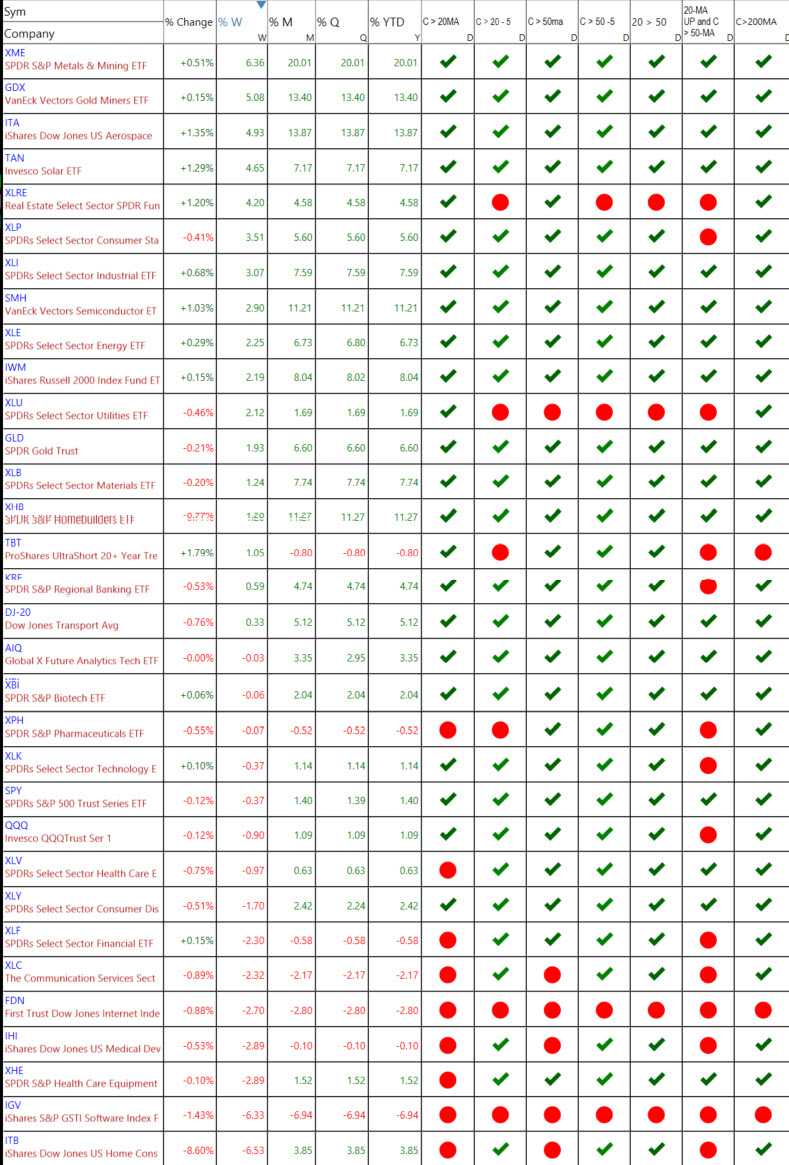
See the Video Below
VIDEO REVIEW OF ETF SECTORS - Click lower right to open Full Screen.
NEW ETF TRADE IDEAS
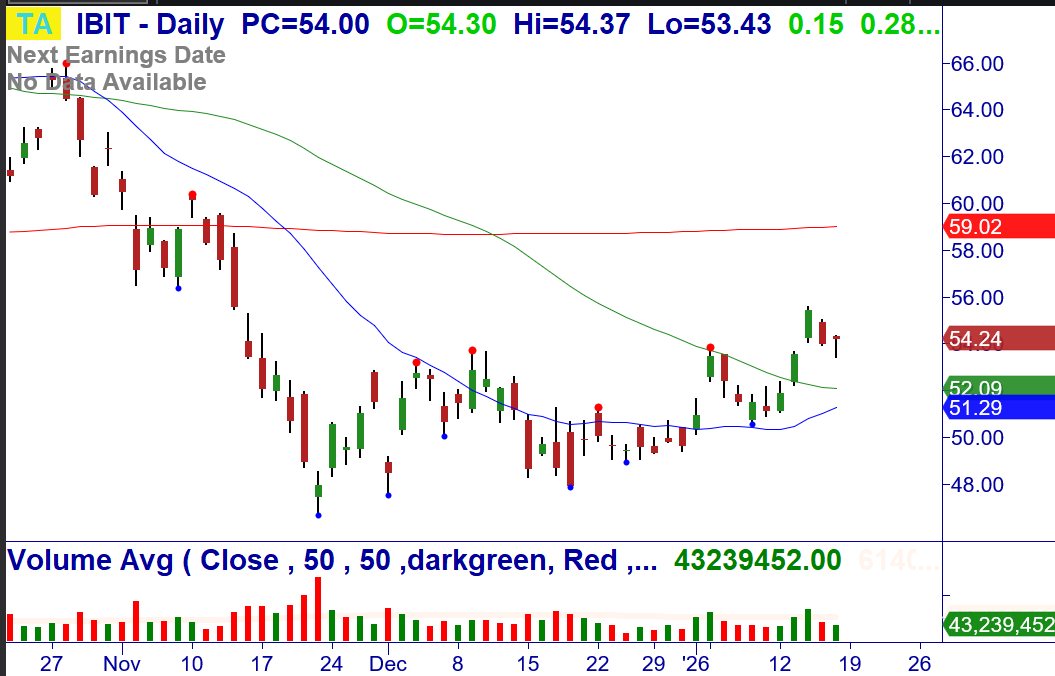
1/20: iShares Bitcoin Trust ETF (IBIT) – Over $54.37, consider buying a ½ lot of the ETF. Pullback and reversal after Breakout at the 50-MA, Breakout weekly. Stop $50.55.
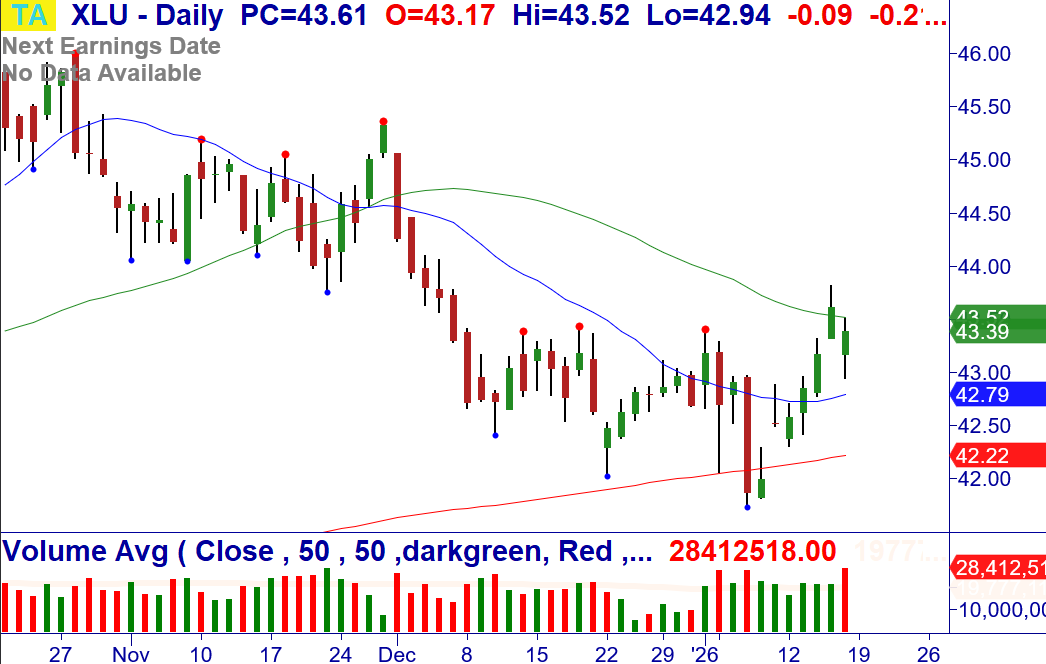
1/20: State Street Utilities Select Sector SPDR ETF (XLU) - Long watch.
OPEN AND CLOSED ETF POSITIONS WITH TRADE UPDATES (NOTE: Also in Member's Area in Open/Closed Trade Sheet)
12/23: ARK Innovation ETF (ARKK) - Bought a 1/2 lot of the ETF at $82.58. +WRB from consolidation at the 20/50-MA, bullish weekly/monthly. 1/15: Buy 1/2 over $83.75. Stop $76.91.
12/22: Grayscale Ethereum Trust ETF (ETHE) – Bought a ½ lot of the ETF at $25.09. Breakout from bullish reversal at the 20-MA, bullish retest weekly, Buy Setup monthly. 1/2: Bought ½ at $25.23. 1/16: Move Stop $25.16 (breakeven).
1/16: Federal Realty Investment Trust (FRT) - Bought a ½ lot of the ETF at $103.67. +WRB Breakout from a bullish inverse Head and Shoulders at the 20-MA, bullish weekly/monthly. 1/17: Buy ½ over $103.86. Stop $100.84.
11/25: SPDR Gold Shares (GLD) - Bought the at $380.59. Breakout at the 20/50-MA, bullish weekly. 1/16: Sold 1/3 at $420.06. Move Stop $411.79.
1/19: iShares Bitcoin Trust ETF (IBIT) – Over $54.37, consider buying a ½ lot of the ETF. Pullback and reversal after Breakout at the 50-MA, Breakout weekly. Stop $50.55.
1/5: VanEck Uranium and Nuclear ETF (NLR) - Over $133.93, consider buying the ETF. +WRB Breakout of a bottoming pattern at the 20-MA, bullish retest and reversal weekly. 1/15: Bought 1/2 at $145.70. Move Stop $134.50.
12/3: abrdn Physical Palladium Shares ETF (PALL) - Bought the ETF at $134.03. Breakout, Bull Flag consolidation weekly. 12/17: Sold 1/3 at $149.27. 12/23: Sold 1/3 at $169.80. 1/10: Move Stop $154.53.
1/12: State Street SPDR Portfolio S&P 500 Value ETF (SPYV) – Bought the ETF at $58.23. Bear Sandwich +180 Breakout at the 20-MA to all-time highs. 1/17: Move Stop $57.20.
1/13: CoinShares Bitcoin Mining ETF (WGMI) - Bought a 1/2 lot of the ETF at $48.90. Breakout from a bottoming pattern at the 50-MA, bullish weekly/monthly. 1/16: Bought 1/2 $49.53. Stop $44.33.
11/17: State Street SPDR S&P Health Care Equipment ETF (XHE) – Bought the ETF at $82.71. Buy Setup at the 20/200-MA, Breakout weekly/monthly. 1/16: Move Stop $87.45.
12/23: State Street Com Svc Sel Sec SPDR ETF (XLC) - Bought a 1/2 lot of the ETF at $117.54. Breakout at the 20-MA, bullish weekly/monthly. 12/24: Bought 1/2 at $117.56. Stopped.
1/15: State Street PDR S&P Retail ETF (XRT) - Bought a 1/2 lot of the ETF at $91.01. Bull Rectangle Breakout, bullish weekly/monthly. 1/17: Buy ½ over $91.25. Stop $87.76.
Master Trader and You Building Your Financial Future Together!
Happy trading! If you have any questions or comments, please e-mail Greg Capra at Greg@mastertrader.com or Dan Gibby at Dan@mastertrader.com
All the best,
Greg Capra Managing Director of Master Trader
Dan Gibby Chief Options Strategist
NOTE: Master Trader will show the opening and closing prices of all stock and options trades. We recommend that all traders and investors use proper share sizing for positions and money management. However, we cannot recommend what that is for your particular trading style, risk tolerance, or account balance. We urge you to calculate your own share/position size based on your individualized risk parameters, Trading Plan, and familiarity with the proposed trade strategy and risk. Advanced Management Strategies (AMS) covers in detail foundation and advanced position and money management.
NOTE: Master Trader and its representatives may have existing positions in actual or other trade recommendations before or after suggested herein. Additionally, we may manage them differently for internal purposes based on different risk parameters than noted herein. All trade ideas and content are for informational and educational purposes only. It is not, nor is it intended to be, trading or investment advice or a recommendation that any security, option, or investment strategy is suitable for any person. Trading securities can involve high risk and the loss of any funds. Significant gaps or volatility can increase these losses, particularly for short option strategies. Investment or trading information provided may not be appropriate for all investors, and is provided without respect to individual financial sophistication, financial situation, investing time horizon or risk tolerance. Supporting documentation for any claims (including claims made on behalf of options programs), comparison, statistics, or other technical data, if applicable, will be supplied upon request. Master Trader Consulting, Inc. is not a licensed financial advisor, registered investment advisor, or a registered broker-dealer. Options, futures, and futures options are not suitable for all investors.
