

The first full trading week of 2026 kicked off on a strong note, aligning with January’s historical tendency to lean bullish. The major indices advanced amid a mix of geopolitical headlines, softer economic data, and policy developments out of Washington.
The Dow Jones Industrial Average and the Dow Jones Transportation Average both pushed to new all-time highs, confirming the bullish message of Dow Theory. At the same time, the S&P 500 and the Russell 2000 also registered new record highs—telling us that large caps and small caps are advancing together, not diverging.
The S&P 500 gained roughly 1–2% on the week, closing Friday decisively above 6,900 and within striking distance of the psychologically important 7,000 level. The Dow pushed to record territory, while the NASDAQ posted modest gains. The real standout was small caps, with the Russell 2000 surging 4–5%, signaling a broadening of participation beyond mega-cap technology.
One of the more important observations this week was that the Magnificent Seven ETF (MAGS) has one of the weakest-looking charts. It remains neutral to negative, despite catching a bid on Friday as the broader market lifted. Within that group, only Amazon and Alphabet maintain clean bullish trends. The rest are lagging.
That kind of alignment doesn’t happen often, and when it does, it usually reflects broad institutional participation rather than speculative excess.
The December jobs report, released Friday, showed payroll growth of just 50,000—well below expectations and capping the weakest year of job growth since 2020. While the unemployment rate ticked slightly lower, the broader takeaway is clear: the labor market is cooling.
Markets interpreted the data as increasing the odds of a dovish Federal Reserve later this year rather than signaling imminent recession. Wage growth remained contained, inflation fears stayed muted, and rate-cut expectations quietly firmed.
That combination helped explain why the market shrugged off “bad” news and continued higher.
Another source of volatility last week was the anticipated Supreme Court ruling on challenges to Trump’s tariff policies. Traders positioned for the decision, volatility picked up… and then nothing happened.
The Court delayed its ruling, removing a near-term uncertainty and helping fuel the rally. If the tariffs are ultimately ruled illegal, the implications could be enormous—but markets prefer delayed clarity to immediate disruption, and that’s exactly what they got.
Hot inflation numbers could pressure small caps and rate-cut expectations. Softer prints could be the excuse for a push through 7,000.
From a technical perspective, the S&P 500 struggled for weeks between roughly 6,860 and 6,900. Friday’s decisive close above 6,900 increases the probability of at least testing 7,000 and possibly overshooting it—something markets often do around widely watched levels.
Options expiration, unresolved tariff policy, and headline risk from Washington all increase the odds of sharp intraday reversals.
This is exactly the kind of market where patience, selectivity, and discipline matter most.
The market started 2026 strong—but it’s doing so through rotation, not blind accumulation.
Leadership is narrowing, laggards are catching bids, and institutions are clearly active. At the same time, failed setups, headline risk, and event-driven volatility mean this is not a market to chase.
Add to that the anticipated tariff decisions, economic data releases, and options expiration dynamics, and the setup clearly points to elevated short-term volatility.
As always, our focus remains on high-probability setups, clean patterns, and knowing when the best trade is to "Sit on Our Hands" (SOH).
Our internal market gauges remain neutral, which means there is still fuel in the tank for movement in either direction. For now, however, we are giving the benefit of the doubt to the prevailing uptrends, not fighting them.
Quality patterns, along with MTS Position and Money Management, will always put us in the best position.
If you're not in the Green Room with us, log in to YouTube, Facebook, or Twitter to get our pre-market review at 9 AM ET. If you can't make it, you can view the recording.
Good trading.
TREND MATRIX
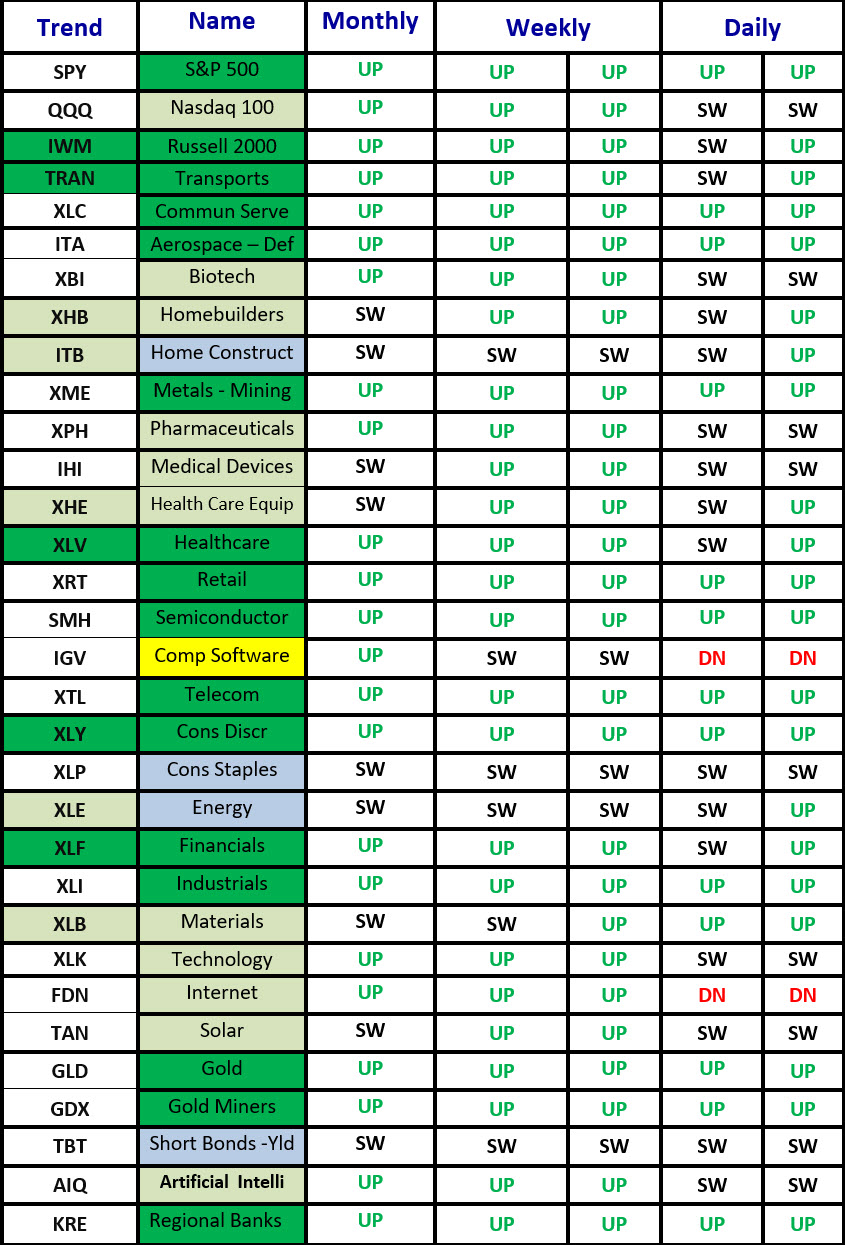
I reviewed the Trend Matrix in the video below
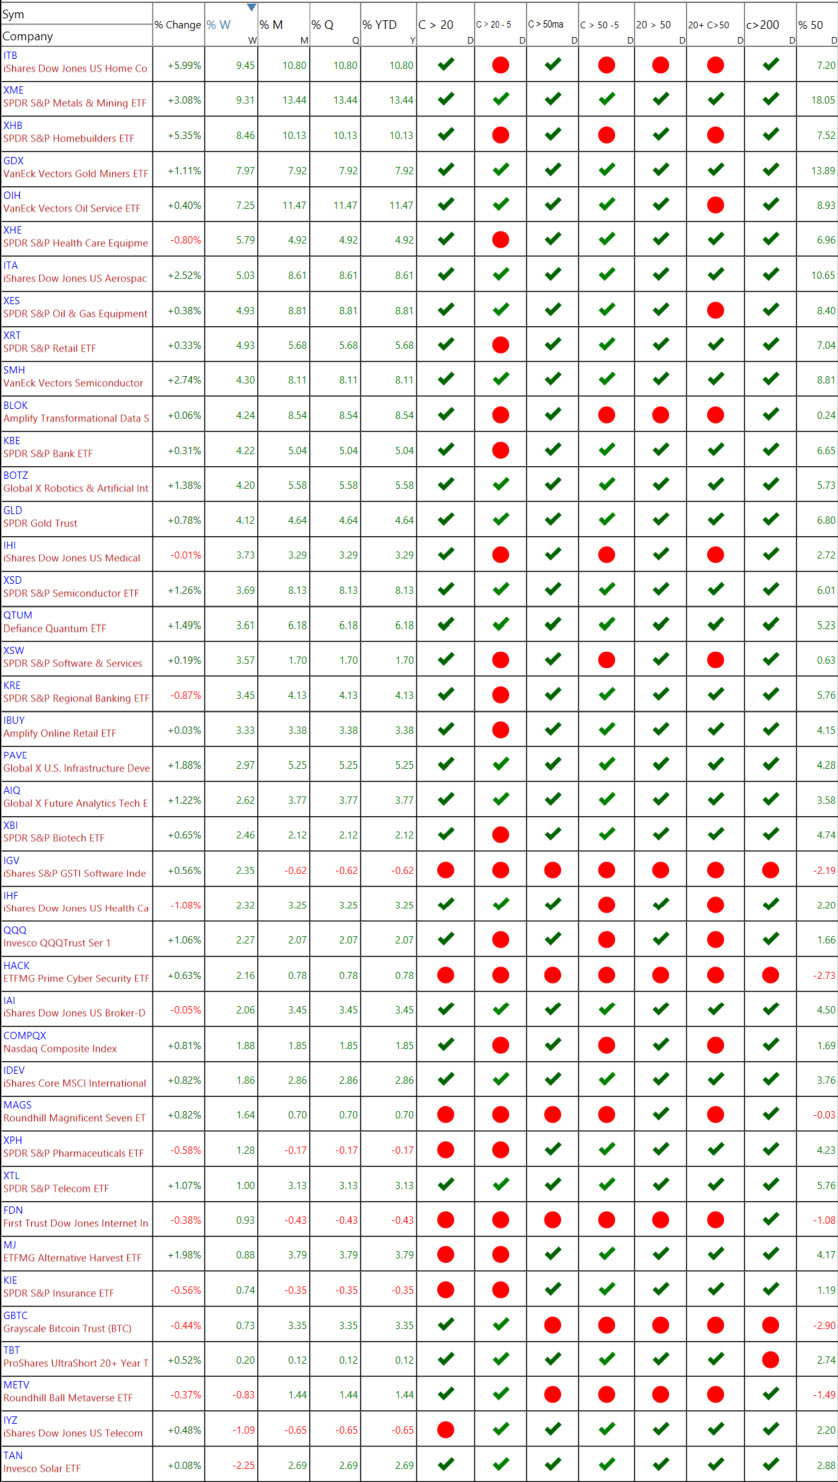
S&P Sector ETFs – Sorted by Weekly Percent Change

Last week’s percentage changes.
The percentage changes tell you which sectors were the strongest or weakest on Friday and for the week, month, quarter, and year.
There are seven columns after the percent changes in the sector listed above.
You can see the ETFs that are the strongest getting stronger or weakening.
- Close above or below the 20-MA.
- Close above or below the 20-MA 5 Days Ago. C>20 -5
- Close above or below the 50-MA.
- Close above or below the 50-MA 5 Days Ago. C>50 -5
- 20-MA above or below the 50-MA.
- 20-MA is pointed up, and the close is above the 50-MA
Other ETF Sectors – Sorted by Weekly Percent Change
See the Video Below
VIDEO REVIEW OF ETF SECTORS - Click lower right to open Full Screen.
NEW ETF TRADE IDEAS
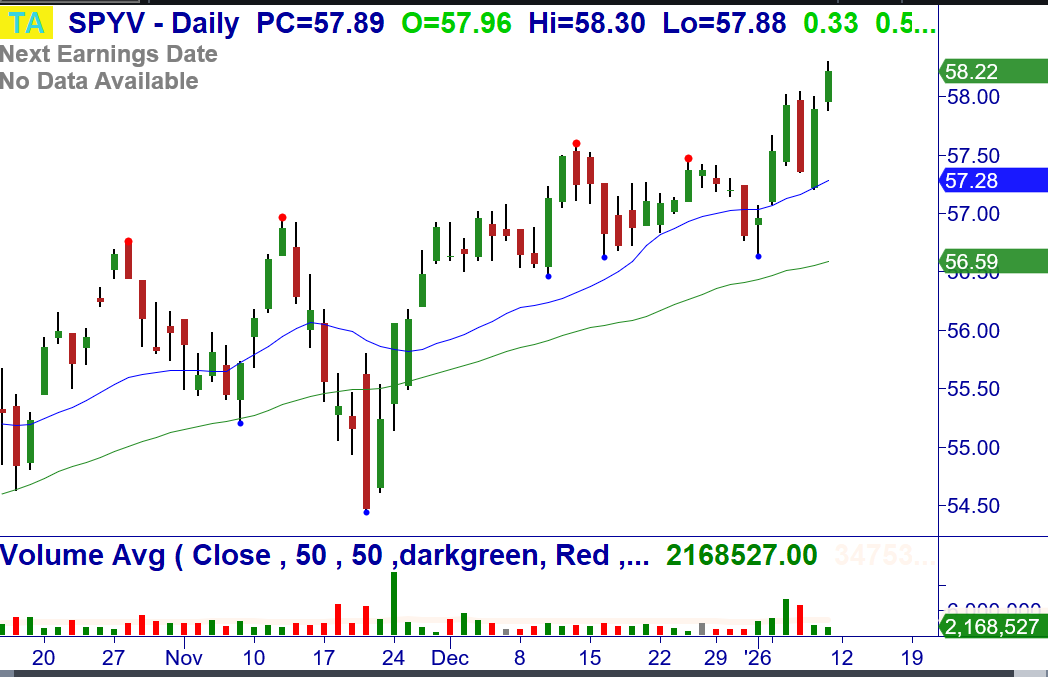
1/12: State Street SPDR Portfolio S&P 500 Value ETF (SPYV) – Over $58.22 (closing price), consider buying the ETF. Bear Sandwich +180 Breakout at the 20-MA to all-time highs. Stop $57.07.
1/12: Direxion NASDAQ-100 Equal Weighted Index Shares (QQQE) – Over $105.36, consider buying a ½ lot of the ETF. Pullback and reversal after +WRB Breakout at the 20-MA to all-time highs. Stop $103.08.

OPEN AND CLOSED ETF POSITIONS WITH TRADE UPDATES (NOTE: Also in Member's Area in Open/Closed Trade Sheet)
12/22: Grayscale Ethereum Trust ETF (ETHE) – Bought a ½ lot of the ETF at $25.09. Breakout from bullish reversal at the 20-MA, bullish retest weekly, Buy Setup monthly. 1/2: Bought ½ at $25.23. 1/3: Move Stop $23.67.
11/25: SPDR Gold Shares (GLD) - Bought the at $380.59. Breakout at the 20/50-MA, bullish weekly. 1/10: Move Stop $395.58.
1/5: VanEck Uranium and Nuclear ETF (NLR) - Over $133.93, consider buying the ETF. +WRB Breakout of a bottoming pattern at the 20-MA, bullish retest and reversal weekly. 1/9: Move Stop $134.50.
12/3: abrdn Physical Palladium Shares ETF (PALL) - Bought the ETF at $134.03. Breakout, Bull Flag consolidation weekly. 12/17: Sold 1/3 at $149.27. 12/23: Sold 1/3 at $169.80. 1/10: Move Stop $154.53.
12/29: Vanguard Health Care ETF (VHT) – Over $290.79, consider buying the ETF. Breakout at the 20-MA, bullish weekly. Stopped.
11/17: State Street SPDR S&P Health Care Equipment ETF (XHE) – Bought the ETF at $82.71. Buy Setup at the 20/200-MA, Breakout weekly/monthly. 1/10: Move Stop $87.28.
12/23: State Street Com Svc Sel Sec SPDR ETF (XLC) - Bought a 1/2 lot of the ETF at $117.54. Breakout at the 20-MA, bullish weekly/monthly. 12/24: Bought 1/2 at $117.56. 1/10: Move Stop $116.26.
Master Trader and You Building Your Financial Future Together!
Happy trading! If you have any questions or comments, please e-mail Greg Capra at Greg@mastertrader.com or Dan Gibby at Dan@mastertrader.com
All the best,
Greg Capra Managing Director of Master Trader
Dan Gibby Chief Options Strategist
NOTE: Master Trader will show the opening and closing prices of all stock and options trades. We recommend that all traders and investors use proper share sizing for positions and money management. However, we cannot recommend what that is for your particular trading style, risk tolerance, or account balance. We urge you to calculate your own share/position size based on your individualized risk parameters, Trading Plan, and familiarity with the proposed trade strategy and risk. Advanced Management Strategies (AMS) covers in detail foundation and advanced position and money management.
NOTE: Master Trader and its representatives may have existing positions in actual or other trade recommendations before or after suggested herein. Additionally, we may manage them differently for internal purposes based on different risk parameters than noted herein. All trade ideas and content are for informational and educational purposes only. It is not, nor is it intended to be, trading or investment advice or a recommendation that any security, option, or investment strategy is suitable for any person. Trading securities can involve high risk and the loss of any funds. Significant gaps or volatility can increase these losses, particularly for short option strategies. Investment or trading information provided may not be appropriate for all investors, and is provided without respect to individual financial sophistication, financial situation, investing time horizon or risk tolerance. Supporting documentation for any claims (including claims made on behalf of options programs), comparison, statistics, or other technical data, if applicable, will be supplied upon request. Master Trader Consulting, Inc. is not a licensed financial advisor, registered investment advisor, or a registered broker-dealer. Options, futures, and futures options are not suitable for all investors.
