Some of last week’s comments included:
"Indices moved up last week, in a slow grind, and many are near resistance.
Internals are neutral.
There are many relatively tight ranges within broader ranges, which don't suggest significant moves."
Santa Rally? Maybe — But Not the One Most Are Expecting
As we headed into the final stretch of the year, the question I often got was simple:
Are we going to get a Santa Rally or not?
The short answer is not the traditional, broad-based version most investors are conditioned to expect.
This market is not behaving like a “throw a dart, and everything goes up” environment. Instead, the price action over the past two weeks points to something far more nuanced—and notably inconsistent with traditional year-end institutional behavior.
In a typical window-dressing environment, institutions add to their winners and buy names they don’t already own so they can “show” them on year-end statements. That is not what happened this year. Many of the biggest 2025 winners—particularly in mega-cap technology and AI-related stocks—were sold aggressively rather than accumulated.
That selling tells us institutions were not concerned with appearances. They were concerned with risk, concentration, and capital preservation. Rather than chasing performance into year-end, funds chose to lock in gains, reduce exposure to crowded trades, and rotate capital elsewhere.
That behavior is far more tactical—and far more revealing—than traditional window dressing, and it helps explain the selective, uneven price action we are seeing across sectors.
Options Unloading Since 12/18: Structure Matters
The price action since December 18th aligns closely with post–options expiration forces at work, following the largest options expiration in history, with over $7 trillion in notional value rolling off the board. Expirations of that magnitude often act as inflection points, temporarily removing dealer positioning and exposing the market to real supply-and-demand forces.
In the days that followed, volatility increased, and institutions began rebalancing aggressively. Rather than adding to winners in a classic year-end window-dressing fashion, funds used the removal of options-related support to reduce exposure in crowded trades and rotate capital into underperformers.
That shift helps explain why selling pressure persisted in mega-cap technology while selective buying emerged elsewhere late in the week.
This is not panic-driven behavior—it is post-expiration repositioning, and it frequently produces touch-and-go markets like the one we are navigating now.
This is rotation, not liquidation.
However, rotation does not mean “everything is fine.” It simply means the selling pressure has a source
The AI Trade: Bubble, Reset, or Evolution?
There is no question that the AI trade became crowded in 2025.
The mistake many traders make is assuming crowded means “dead.” More often, it means selective survival.
We’ve seen heavy selling across the AI complex:
- Microsoft was sold.
- NVIDIA formed topping tails (TTs).
- Apple produced a TT.
- Amazon reversed lower.
- Meta rolled over.
- The MAG 7 ETF, as a group, moved lower.
This is not random.
This is what happens when concentrated positioning meets calendar pressure.
The Software ETF (IGV) continued its decline, breaking decisively below its 200-day moving average on Friday. That is not a retail signal—it’s an institutional one.
Aggressive selling in Adobe, Intuit, Paychex, Palo Alto Networks, Autodesk, Workday, and Microsoft confirms that funds are reducing exposure to the assets with gains and liquidity.
Does this mean AI is over?
No.
It means the easy money phase is over.
From here forward, AI will likely be selective, technically driven, and volatile.
Institutions Are Repositioning — And It’s Obvious Where
This past week highlighted exactly how institutions behave at year-end.
They are unwinding concentrated positions in 2025 winners and pivoting capital into underperformers—even when the headlines argue against it.
Energy is a perfect example.
Crude oil is down roughly 22.5% year over year, yet money flowed into energy-related names late in the week. That divergence is not emotional—it’s forward-looking.
On Friday, despite selling pressure throughout the week, capital rotated into:
- Defense stocks
- Oil-related stocks
- Select underperformers across multiple sectors
This is not what markets do when they are about to unravel.
It is what markets do when institutions are reshuffling risk for the next cycle.
Early Saturday morning the U.S. commenced airstrikes around Caracas, raided Maduro’s compound, and captured and delivered he and his wife to New York for a criminal trial.
Perhaps this partially explains the institutional reshuffling as well the expiration of quarterly options cycle.
Short-Term Risk Has Increased — Respect It
While we continue to trade long patterns where they exist, we also need to be honest about what price is telling us.
Aggressive selling in big-cap technology, combined with deep or relatively deep retracements across several key areas, raises legitimate concern that the short-term correction that began in December may deepen.
Areas of concern include:
- Financials
- Mid-caps
- Small-caps
- Transports
- Regional banks
- Consumer Discretionary
These are economically sensitive areas. When they retrace together, it suggests risk appetite is cooling, not expanding.
The Nasdaq 100 closing below its 50-day moving average is significant. That level acts as a reference point for institutions. A close below it signals distribution.
Add to that the Software ETF breaking below its 200-day moving average, and it becomes clear that technology leadership is being challenged—for now.
That does not mean bearish trends are confirmed. It means conditions are fragile.
Internal Market Gauges: Weakening, Not Extreme
Our internal market gauges have deteriorated but remain neutral.
This distinction is critical.
We require both breadth and sentiment to reach historical extremes together to generate higher-confidence signals. That has not happened.
Breadth is weaker, yes—but not washed out.
Sentiment is cautious—but not panicked.
This is the danger zone for emotional traders. It’s where people feel like something big is about to happen, but the data hasn’t confirmed it yet.
That’s why patience matters here.
There Are Still Excellent Patterns — Look Beyond the Obvious
Despite the noise, excellent patterns and trends are still developing beneath the surface.
This is why broad conclusions often fail traders.
Strong or constructive setups exist in areas such as:
- Select semiconductors
- Select consumer names
- Select international and ADR-based opportunities
The key is selectivity.
This is not a market where buying “the theme” works. It’s a market where structure, trend, and risk management do.
This is precisely the environment where Master Trader Technical Strategies shine—because we are not dependent on market direction. We are dependent on probability and execution.
Interest Rates: The Quiet Driver No One Can Ignore
As we advance, one of the most critical variables is the direction of the 10- and 30-year interest rates.
Both have moved higher recently, which is not ideal for equities, especially growth and leveraged sectors.
Expectations remain that the Fed will cut rates two to four times this year, with the job market remaining its primary focus.
More importantly, Chair Powell signaled the possibility of resuming bond purchases. If that occurs, it would likely push long-term rates lower and inject additional liquidity into the system.
Liquidity changes behavior.
Markets respond.
This is a factor we will continue to monitor closely.
Energy, AI, and the Next Opportunity Cycle
One long-term theme remains intact: energy demand tied to AI is not going away.
Many of the stocks associated with power generation, infrastructure, and energy delivery have corrected meaningfully. Corrections are how leadership resets—not how it dies.
If interest rates stabilize or fall, and liquidity improves, these areas could quietly become leaders in the next phase.
But again—price will tell us, not opinions.
Touch-and-Go, Not All-In or All-Out
Short-term signals are mixed.
This is not an “all bullish” market.
It’s also not an “all bearish” one.
It is touch-and-go.
More data—specifically, price action—is needed.
Corrections are normal. Rotation is healthy. Volatility is part of the process.
Our job is not to predict Santa rallies or fear year-end headlines.
Our job is to manage risk, wait for confirmation, and act only when probabilities align.
That discipline has served us well through many cycles—and it will continue to do so now.
As always, we will focus on the highest-probability setups, respect risk when conditions deteriorate, and sit on our hands when patience is the trade.
That is how professionals survive—and thrive—through environments like this.
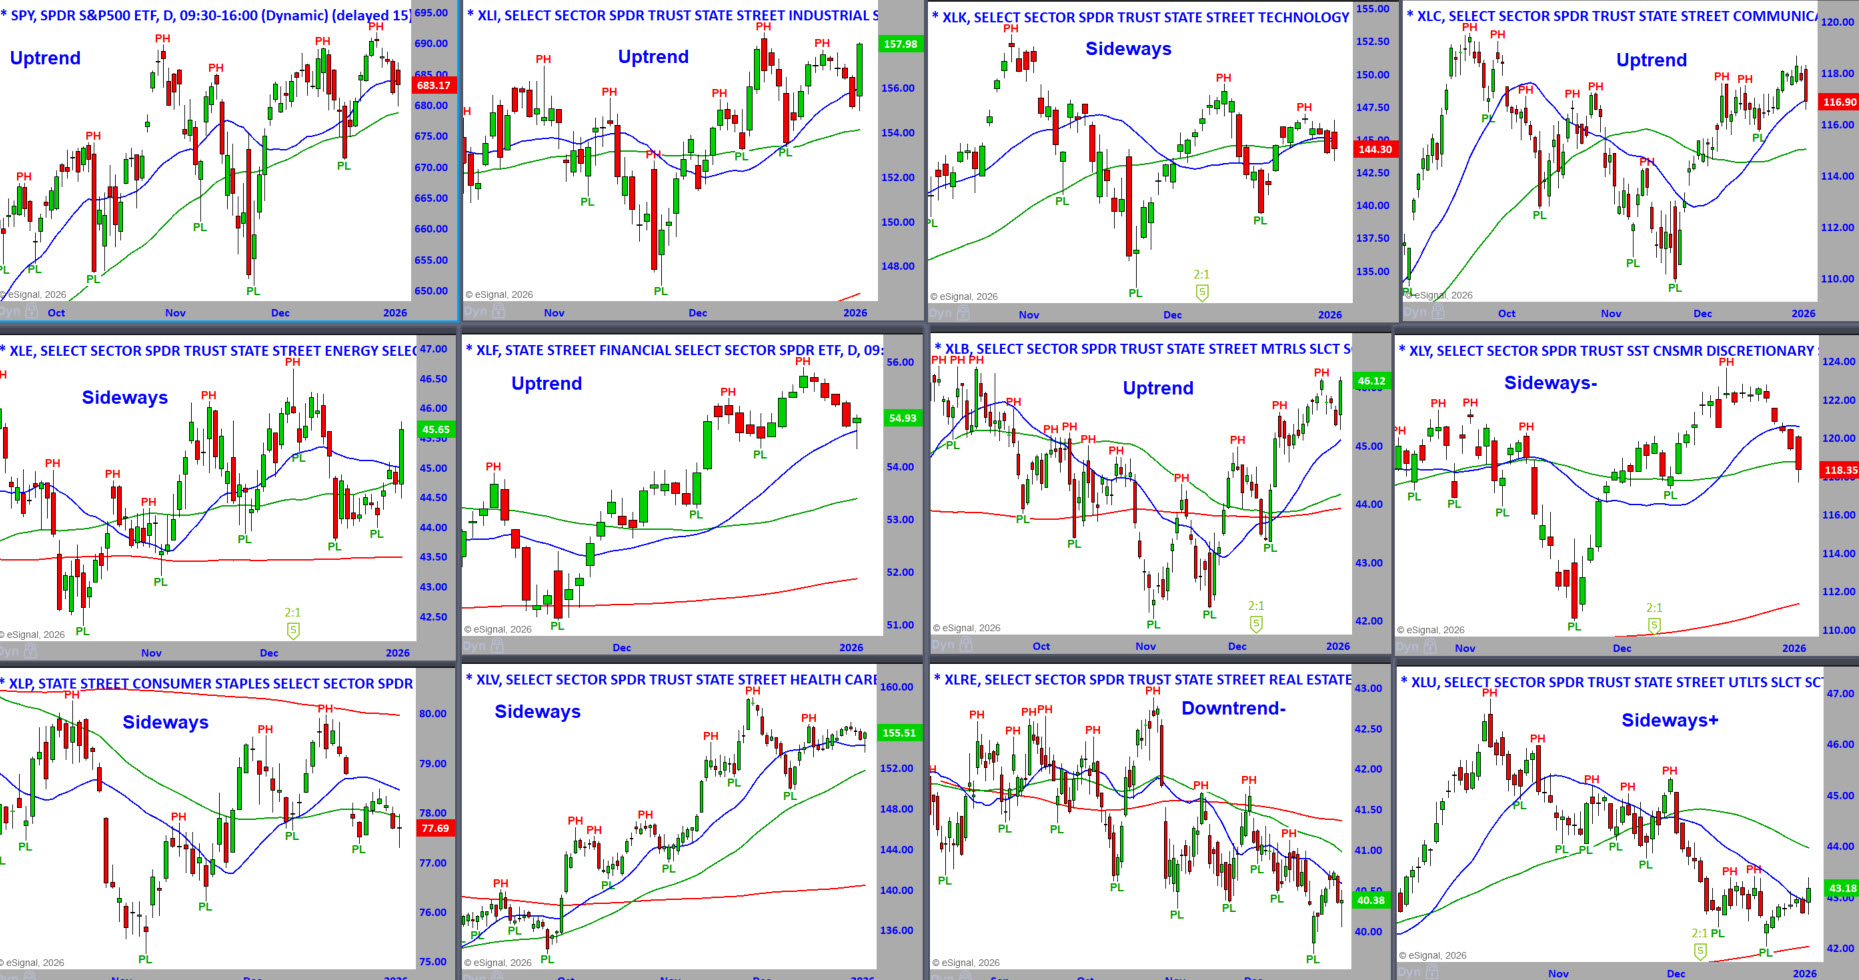
S&P Sector ETFs – Daily Charts - To See a Larger Image,
Right-Click and Press Open in a New Tab
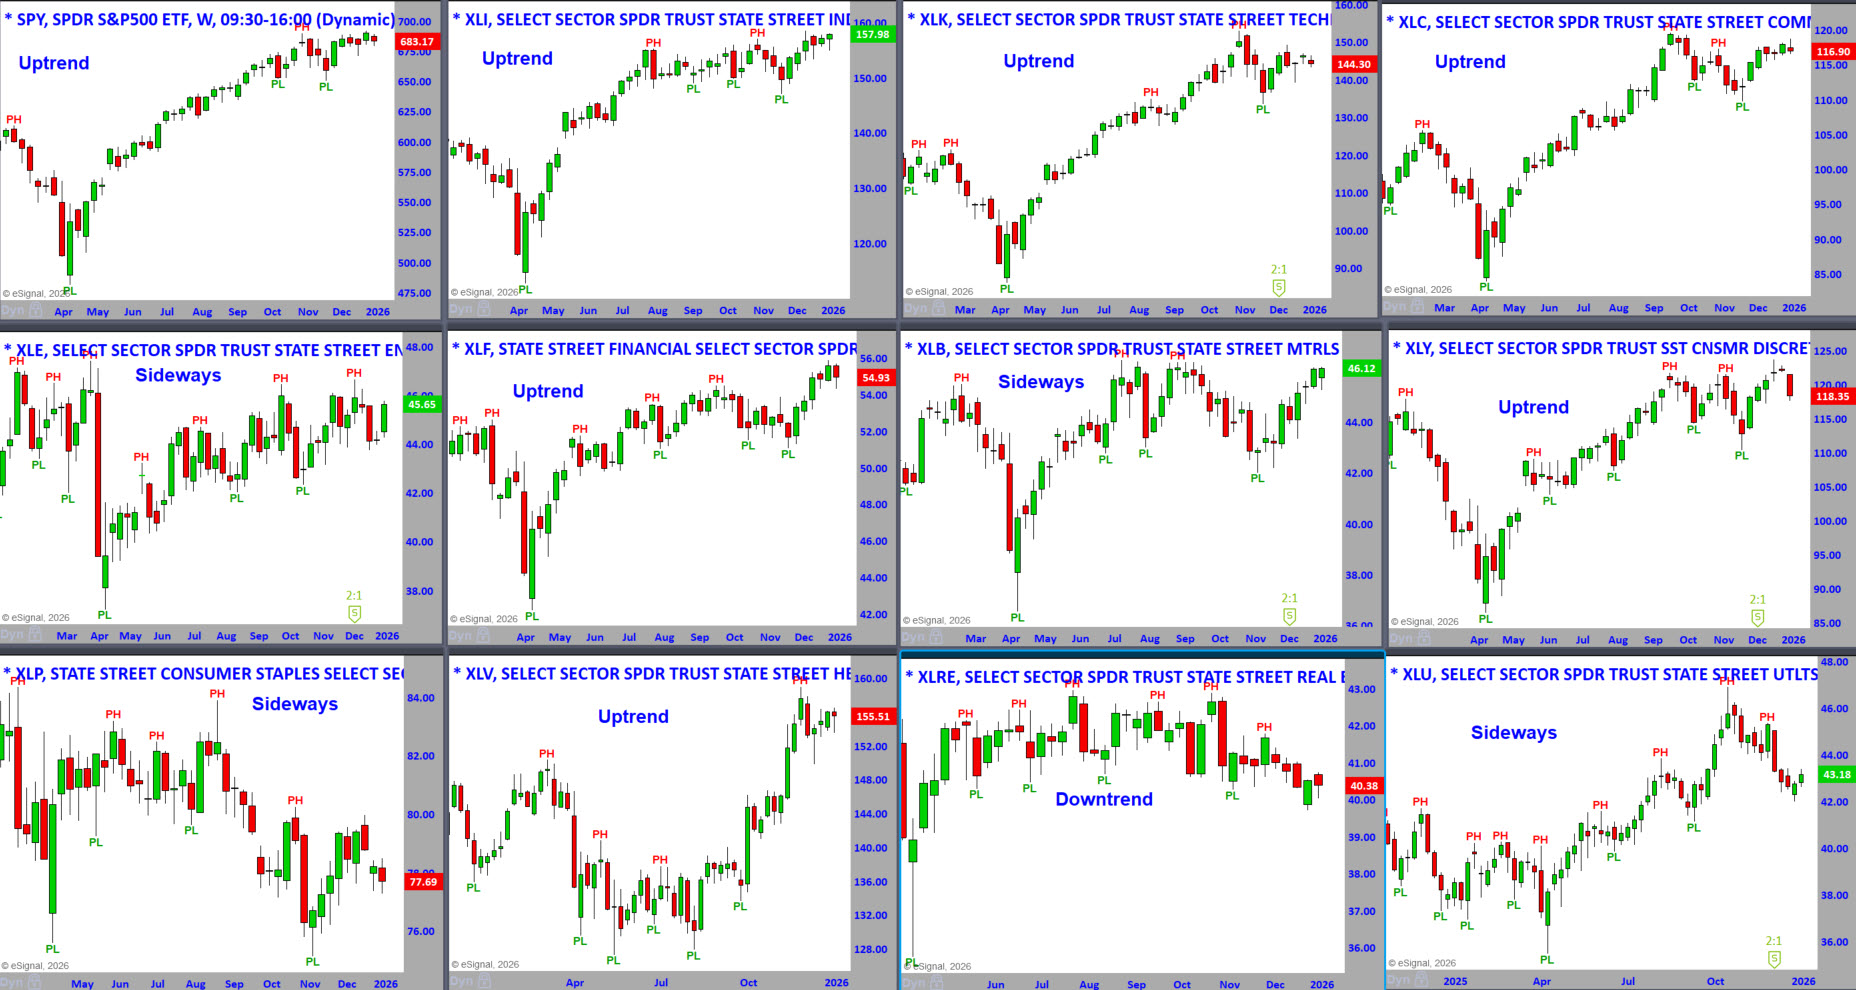
S&P Sector ETFs – Weekly Charts - To See a Larger Image,
Right-Click and Press Open in a New Tab
S&P Sector ETFs – Sorted by Weekly Percent Change This Week
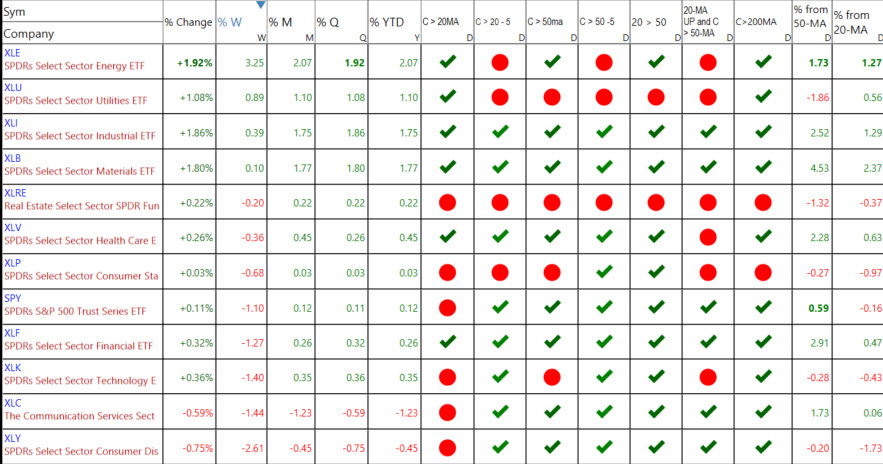
Last week’s percentage changes.
The percentage changes tell you which sectors were the strongest or weakest on Friday and for the week, month, quarter, and year.
There are seven columns after the percent changes in the sector listed above.
You can see the ETFs that are the strongest getting stronger or weakening.
- Close above or below the 20-MA.
- Close above or below the 20-MA 5 Days Ago. C>20 -5
- Close above or below the 50-MA.
- Close above or below the 50-MA 5 Days Ago. C>50 -5
- 20-MA above or below the 50-MA.
- 20-MA is pointed up, and the close is above the 50-MA


Master Trader Holiday Sale: Courses, Memberships & More
End the Week
Special deals for traders and investors of every level — enjoy savings that pay off all year long, CLICK HERE
Where are the Markets Headed this Week?
I addressed this bias in the comments above: neutral internals, mixed messages.
The start of a month and a year is typically up, but I see it as a touch-and-go with limited upside.
Buy Setup failure patterns will support moving toward a more bearish bias.
DOW JONES
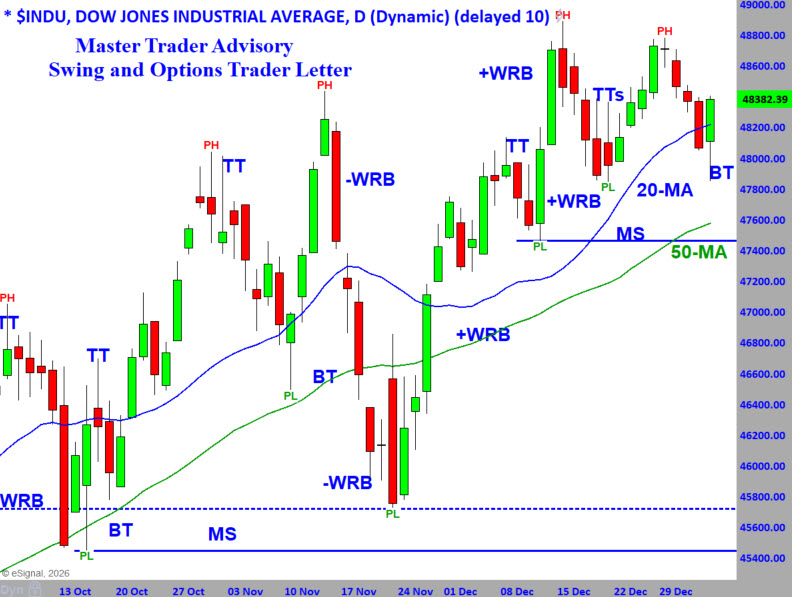
The Dow has been highly erratic, with wide down-and-up swings, but it remains in an uptrend and set new all-time highs last week.
There are two pivot highs above, creating a larger resistance area.
The retracement to the recent Pivot Low (PL) was deep, casting doubt on the uptrend.
However, the bullish reversal day on Friday at the rising was significant and formed a Bottoming Tail (BT).
I give the benefit of the doubt to moving up with limited upside potential.
Major Support (MS) is aligned with the rising 50-MA, and a close below that low would be bearish.
VIDEO REVIEW OF MARKETS, SECTORS AND INTERNALS - Click lower right to open Full Screen.
NEW STOCK TRADING IDEAS and Video Update Below
NOTE: Please see the document in RESOURCES entitled Master Trader Guidelines for Trading the Open and Gaps.
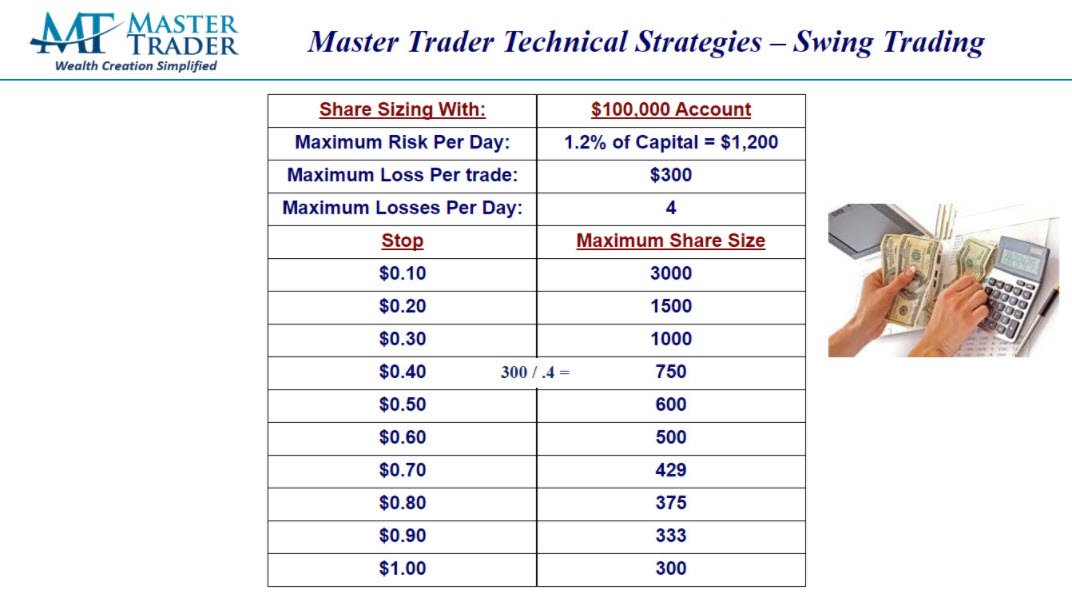
Note on Position Size Calculation in the Open Trades Sheet:
All trades are based on a hypothetical Max Loss of $300/trade. For Stocks, that is $300 / (Entry - Stop). Directional option trades use the same formula, then divided by 100, rounded down to the nearest whole number, with a minimum of one (1).
The “Master Trader Blended Method” for shorting options/spreads size starts with the stock position size, multiplying by 1.5, then divide by 100 because 1 contract represents 100 shares.
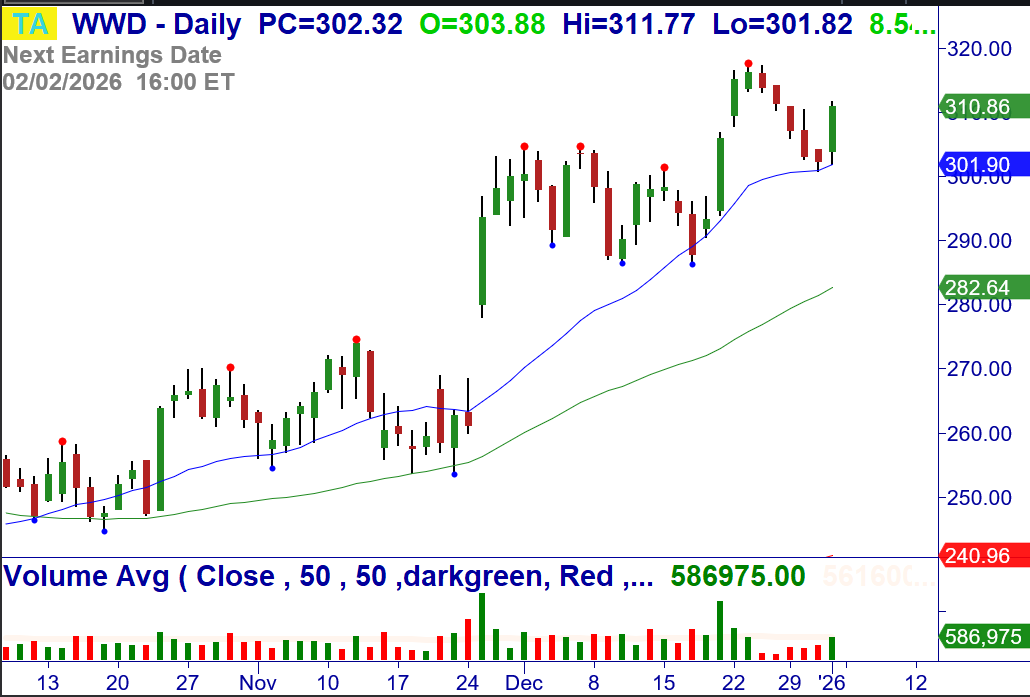
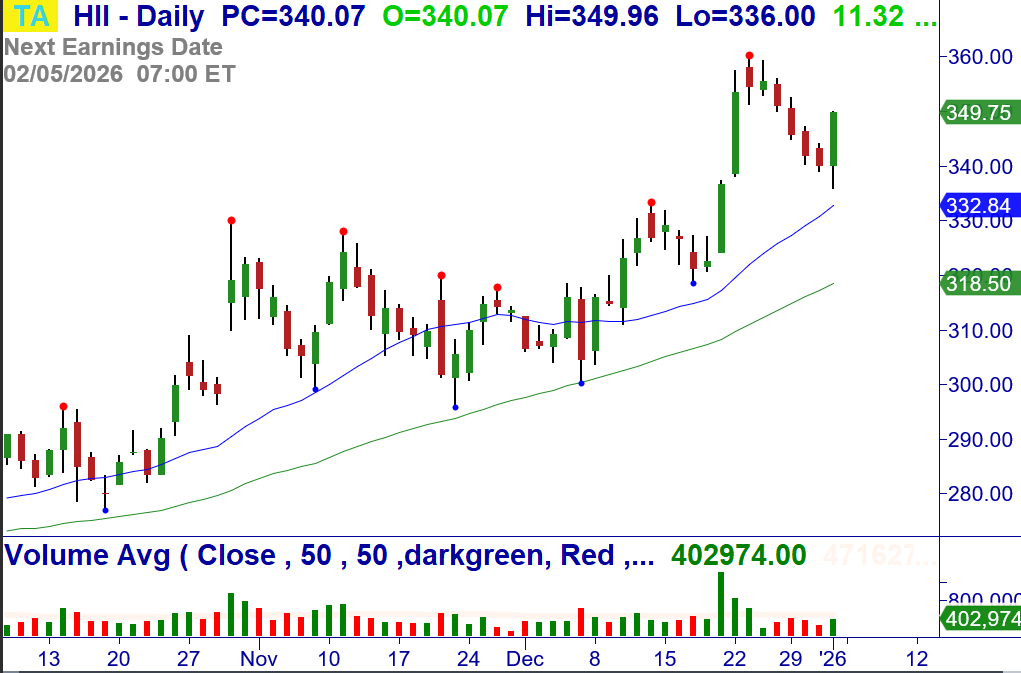
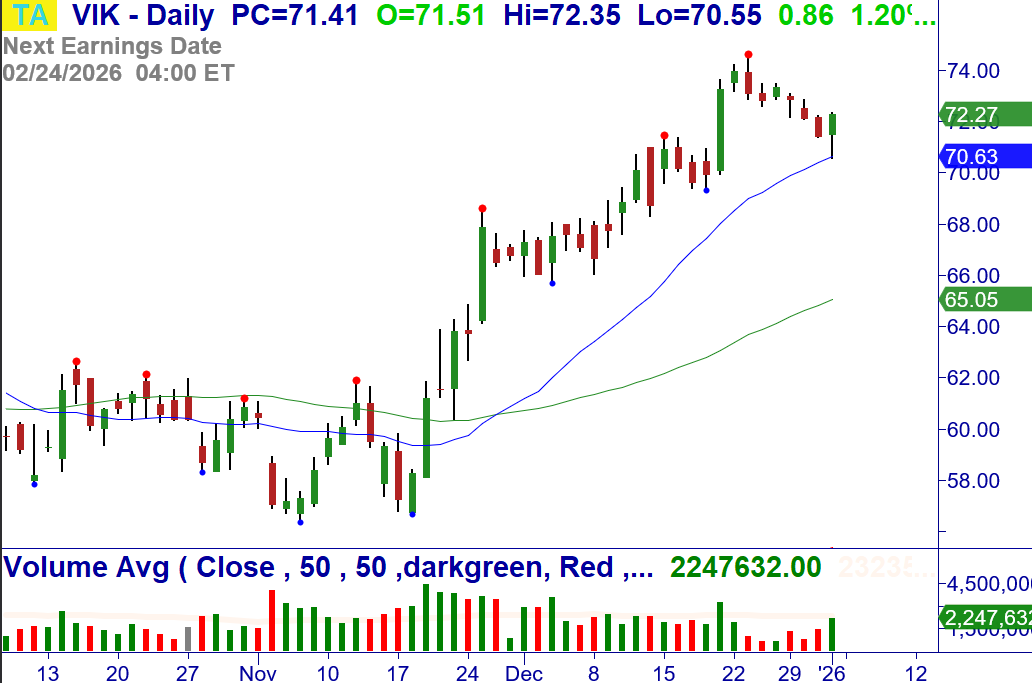
A number of our suggested trades have larger stops because of Friday's expanded volatility. Please calculate position size according using your Max Loss per your Trading Plan.
Here's an example:
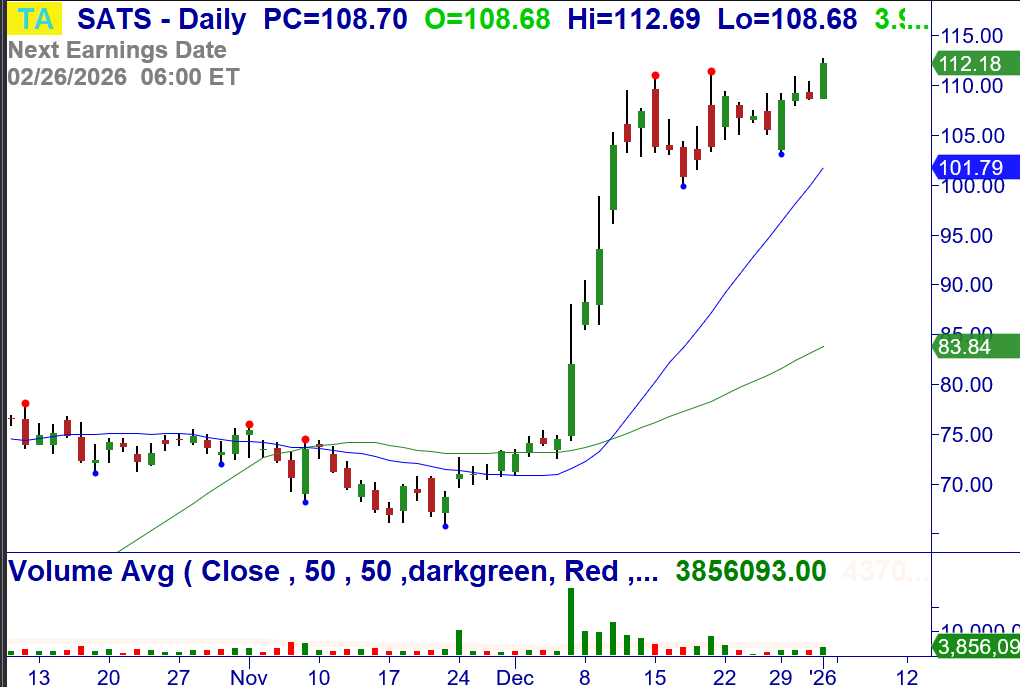
1/5: SATS – Over $112.69, consider buying the stock. Breakout. Stop $107.88.
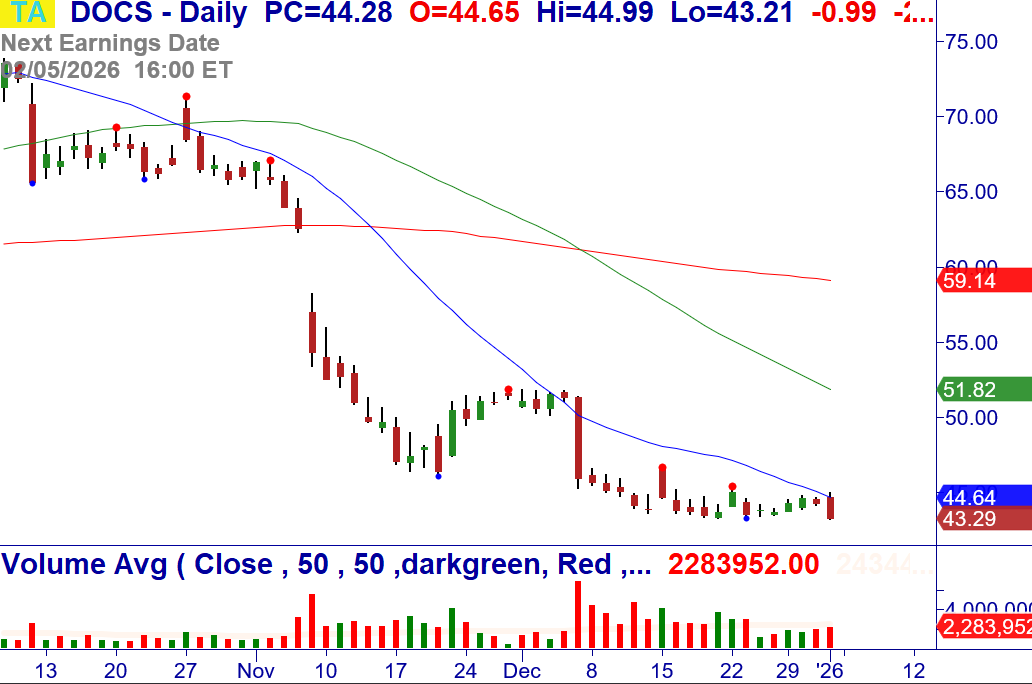
1/5: DOCS – Under $43.21, consider shorting the stock. Breakdown at the 20-MA. Stop $45.12.
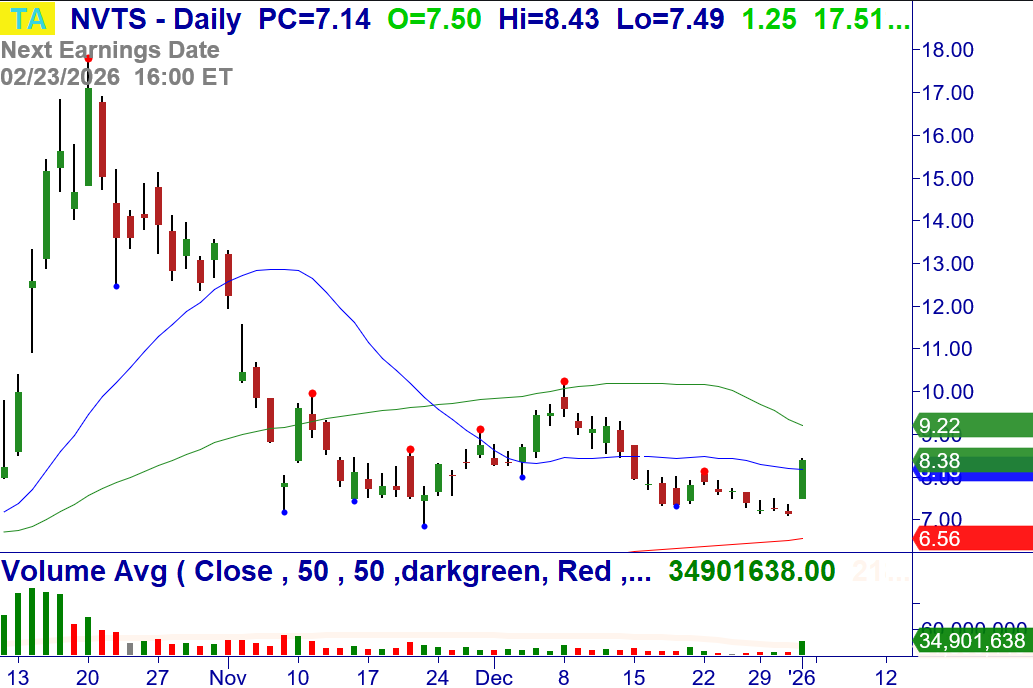
1/5: NVTS – Over $8.43, consider buying the stock. +WRB Breakout of a bottoming pattern at the 20-MA, bullish W-Reversal retest weekly. Stop $7.38.
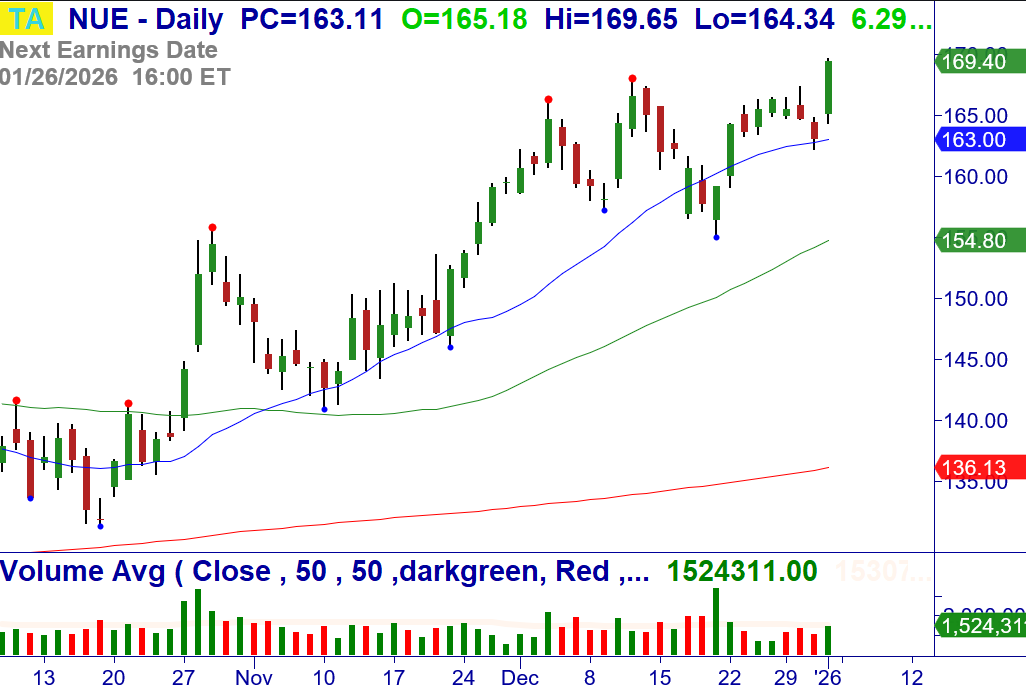
1/5: NUE – Over $169.65, consider buying the stock. +WRB Breakout at the 20-MA. Stop $164.33.
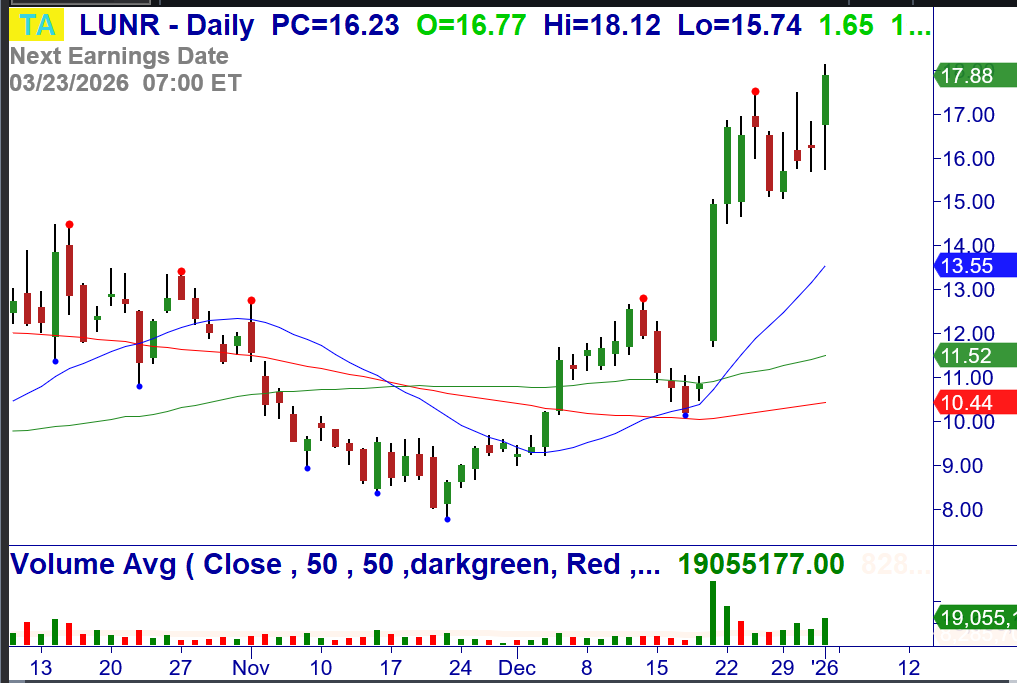
1/5: LUNR – Over $18.12, consider buying the stock. Bull Rectangle Breakout. Stop $15.68.
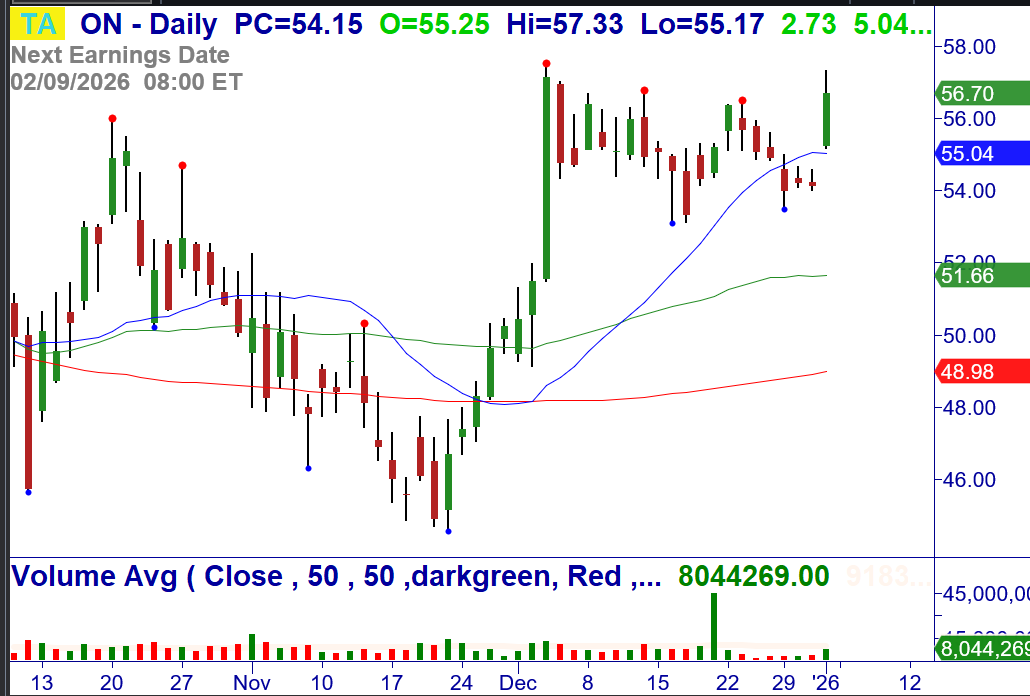
1/5: ON – Over $57.33 or the 30-Min. high, consider buying a ½ lot of the stock. +WRB Breakout at the 20-MA, +123 weekly. Stop $54.98.
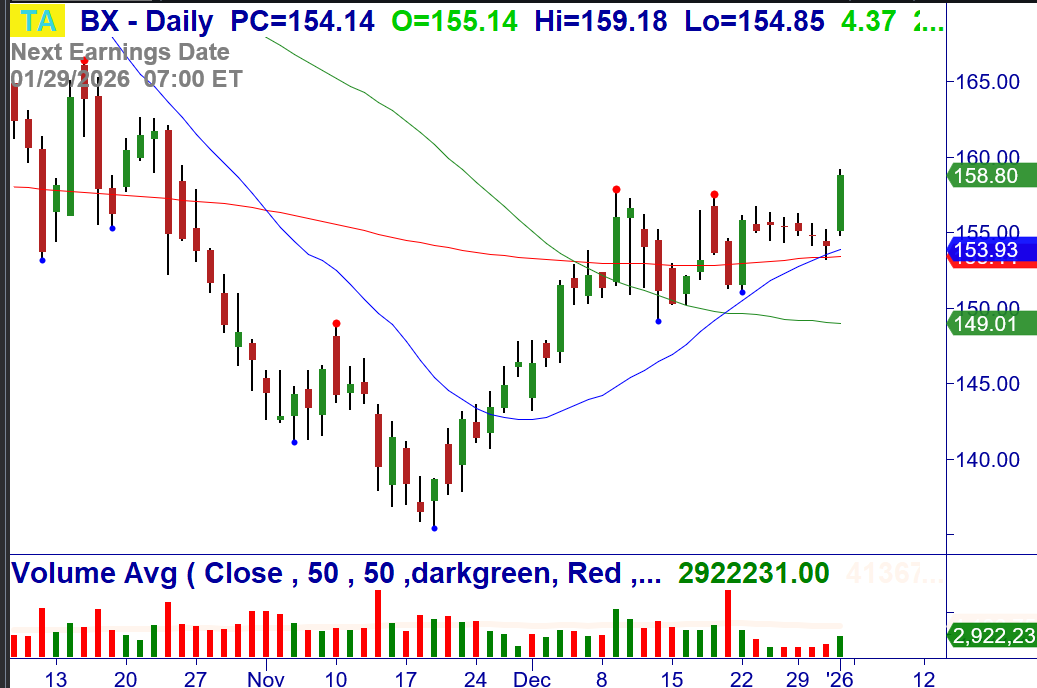
1/5: BX – Over $159.19, consider buying the stock. +WRB Breakout at the 20/200-MA. Stop $154.84.
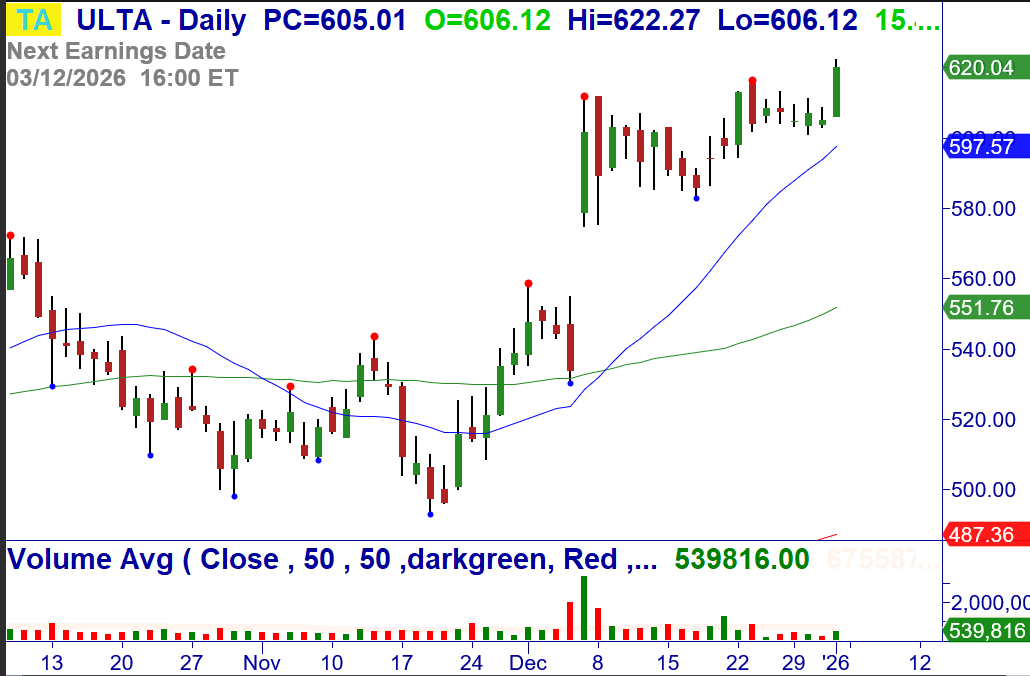
1/5: ULTA – Over $622.27, consider buying the stock. +WRB Breakout at the 20-MA to all-time highs. Stop $606.08.
Money Management for Trading and Investing
Proper money management for investing and Trading starts with position-sizing based on the amount of money you are willing to risk on a signal trade.
CLICK HERE to review these Master Trader Guidelines and Basic Money Management and Position Sizing Table.
NEW OPTIONS TRADING IDEAS
Directional Options Strategies and Debit Spreads for Swing Trading (See the Weekly Options Trader letter, which sells options/spreads for weekly Income that primarily expire in 10 days or less, CLICK HERE)
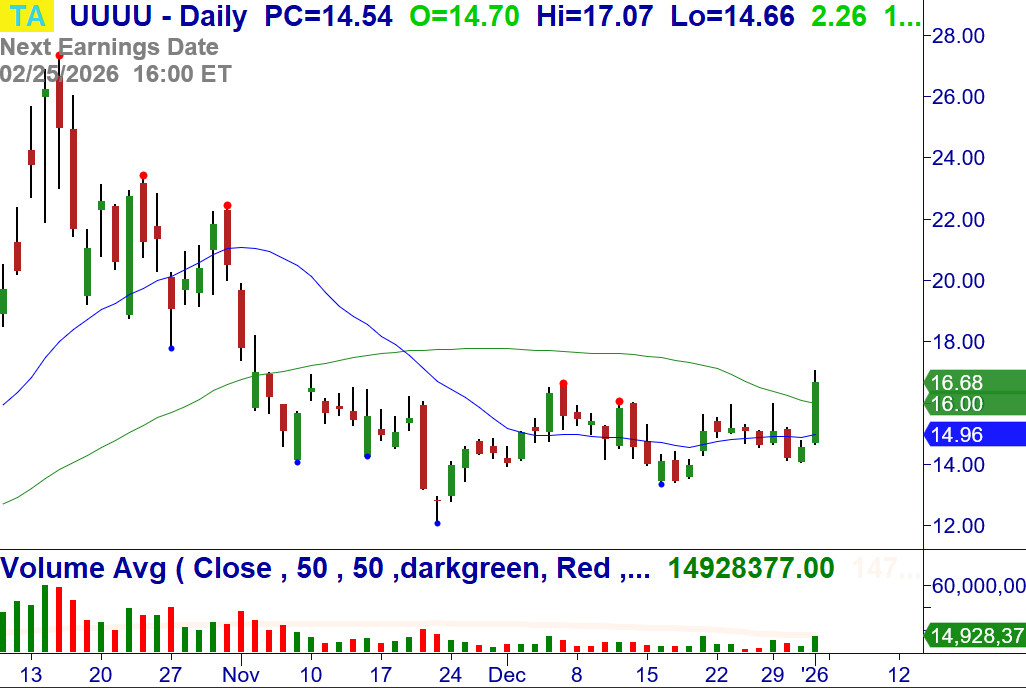
1/5: UUUU – Over $16.68 (closing price), consider buying Jan (1/16) $15 calls for a limit of $2.10/share (closed at $2.15/share). +WRB Breakout from a bottoming pattern at the 20/50-MA. Stop $14.65.
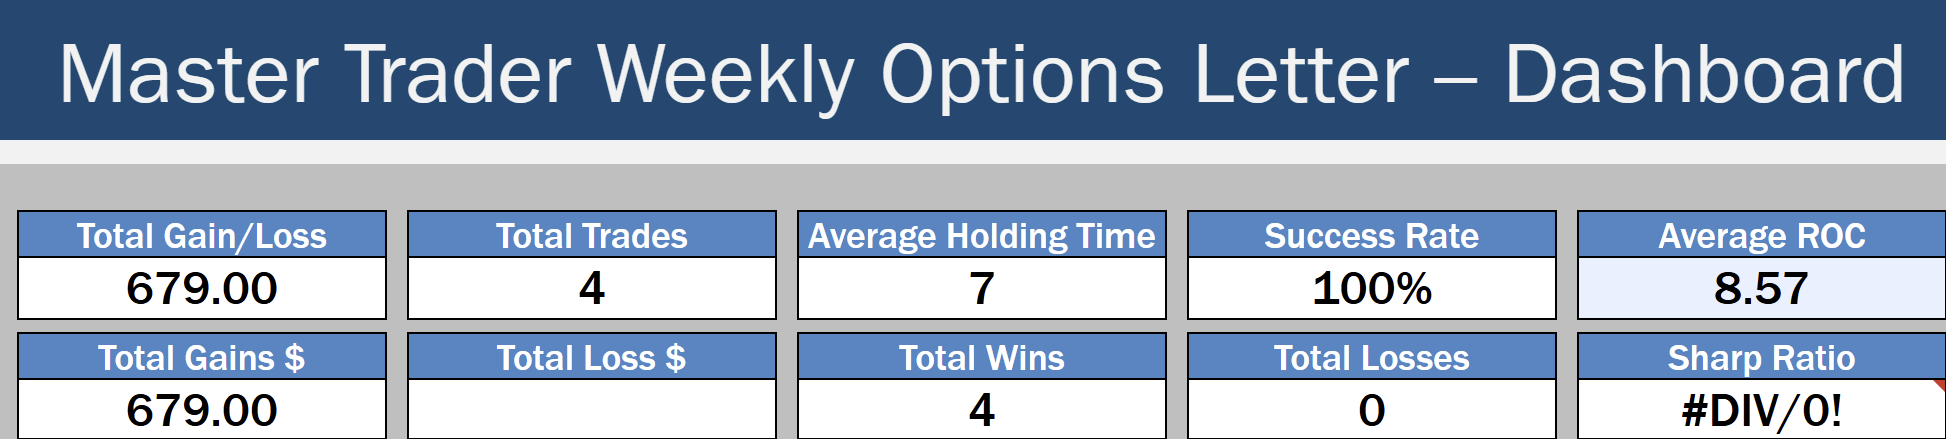
The Master Trader approach to selling credit spreads around technical turning points.
Read about the Weekly Options Trader letter, which sells options/spreads for weekly Income that primarily expire in 10 days or less, around Master Trader technical turning points, CLICK HERE
By selling spreads on stocks and ETFs where MTS indicates price is unlikely to go, we become the “smart money,” getting paid to take calculated, well-defined risk.
Check out the blog article with more information and monthly results, CLICK HERE
Professional consistency, short-duration trades, and risk-controlled income — that’s what defines the Master Trader approach.
Master Trader Holiday Sale: Courses, Memberships & More
Special deals for traders and investors of every level — enjoy savings that pay off all year long, CLICK HERE
Because your success is vital to you – and us.
Before selling options or credit spreads, we urge you to review the valuable and detailed information that we have provided for you in your Member’s Area Resources.
A quick simplified approach to calculating contract size is to simply base your contract size based on the number of shares permitted in your Trading Plan as if you were trading the stock or ETF. Simple Share Sizing = $ Risk / Stop Loss
The amount of money that you are willing to risk – divided by – the stop loss amount. For example, $100 / .20 = 500 shares. Credit Spread example, if your Trading Plan allowed you to trade 543 shares of AAPL based on the stop loss, then simply round down to the nearest hundred and short an equivalent number of contracts of the option. Since 1 contract represents 100 shares of the underlying, this would be five (5) contracts.
Master Trader and You Building Your Financial Future Together!
Good trading!
If you have any questions or comments, please e-mail Greg Capra at Greg@mastertrader.com or Dan Gibby at Dan@mastertrader.com
All the best,
Greg Capra Managing Director of Master Trader
Dan Gibby Chief Options Strategist
NOTE: Master Trader will show the opening and closing prices of all stock and options trades. We recommend that all traders and investors use proper share sizing for positions and money management. However, we cannot recommend what that is for your particular trading style, risk tolerance, or account balance. We urge you to calculate your own share/position size based on your individualized risk parameters, Trading Plan, and familiarity with the proposed trade strategy and risk. Advanced Management Strategies (AMS) covers in detail foundation and advanced position and money management.
NOTE: Master Trader and its representatives may have existing positions in actual or other trade recommendations before or after suggested herein. Additionally, we may manage them differently for internal purposes based on different risk parameters than noted herein. All trade ideas and content are for informational and educational purposes only. It is not, nor is it intended to be, trading or investment advice or a recommendation that any security, option, or investment strategy is suitable for any person. Trading securities can involve high risk and the loss of any funds. Significant gaps or volatility can increase these losses, particularly for short option strategies. Investment or trading information provided may not be appropriate for all investors, and is provided without respect to individual financial sophistication, financial situation, investing time horizon or risk tolerance. Supporting documentation for any claims (including claims made on behalf of options programs), comparison, statistics, or other technical data, if applicable, will be supplied upon request. Master Trader Consulting, Inc. is not a licensed financial advisor, registered investment advisor, or a registered broker-dealer. Options, futures, and futures options are not suitable for all investors.