Some of last week’s comments included:
"There are economic reports on Tuesday, and while they are unlikely to be significant influences, they could be the excuse to move the markets higher.
Considering it’s a holiday week and nearing the end of the year, there should be little risk of a significant move lower and a greater probability of moving higher toward overhead resistance."
Reflecting on 2025: From the Shadows to a Volatile Revival
As we wrap up the final letter of 2025, it’s hard not to step back and reflect—not just on the markets, but on the environment that shaped them.
Markets do not move in a vacuum. They reflect confidence, fear, policy, liquidity, and psychology. And 2025 was shaped by all five.
To understand this year’s volatility, optimism, and frustration, we first have to acknowledge the weight carried over from the prior four years under Joe Biden. Whether by design or by circumstance, those years felt rudderless. Massive government spending, aggressive wealth redistribution, and expanding bureaucracy pushed us toward what many viewed as a soft form of socialism—if not outright economic distortion.
Trillions were injected through stimulus and infrastructure programs, ballooning deficits and expanding government reach. Inflation followed, hitting the middle and lower classes hardest—exactly where inflation always hurts most.
Culturally, the country fractured further. Education became politicized. Parents watched schools turn into ideological battlegrounds, with deeply controversial policies around gender identity, explicit materials in libraries, and decisions being made far from parental input. Regardless of where one stands politically, confidence in institutions eroded.
Geopolitically, instability became the norm. Open borders strained resources. The Russia–Ukraine war expanded uncertainty. Afghanistan was mishandled. Mandatory vaccine policies sparked backlash. Payments to Iran raised alarms. Confidence—both domestic and global—was shaken.
It was unmanageable, but it was happening!
By late 2024, many feared America’s best days were behind it.
Trump’s Return: Relief… and Reality
When Donald Trump won in 2024, the collective sigh of relief was unmistakable.
Markets welcomed the idea of stability, strength, and a return to business-first thinking.
But markets also quickly reminded us of reality.
I’ll admit it—I underestimated how long it would take to unwind the damage. Turning a ship this size doesn’t happen overnight.
Trump moved fast, rescinding executive orders and floating aggressive policy ideas. Tariffs reentered the conversation. Markets sold off hard. Liberation Day triggered what felt like a second nightmare—a sharp selloff that tested investor confidence yet again.
In hindsight, that low became the launching pad.
The rally that followed wasn’t just technical—it was psychological. It reflected market approval of direction, even as rhetoric remained volatile. Trump’s habit of pushing ideas, watching market reactions, and backing off, when necessary, created what traders jokingly called the TACO trades. Effective? Often yes. Comfortable? Rarely.
There were plenty of moments this year when I wished he’d stop talking.
Whether intentional or not, that back-and-forth injected erratic price action into already fragile conditions.
Yet beneath the noise, something important happened.
The creation of the Department of Government Efficiency (DOGE) and the exposure of massive fraud—from Medicare and Social Security to NGOs funneling money back into politics or into the pockets of politicians—were staggering. Billions, possibly trillions, misallocated.
If 2025 taught us anything, it’s that corruption runs far deeper than most ever imagined.
We learned that America is deeply corrupt, perhaps the most corrupt nation.
And paradoxically, that realization created hope.
Curtailing corruption and redirecting funds through tariffs and efficiency isn’t just political—it’s economic fuel. Markets respond to cleaner systems, even when the process is uncomfortable.
Volatility Was the Price of Transition
From a trading perspective, 2025 fit perfectly with what we teach.
Erratic price action. Sharp drops. Fast recoveries. Long periods of indecision followed by sudden expansions. Institutional herding behavior driven by headlines.
This was not a “buy-and-forget” year. It was a year that rewarded patience, discipline, and waiting for confirmation.
Those who chased headlines got chopped up.
Those who respected support, resistance, multiple time frames, and money management survived—and often thrived.
And as we look ahead, it’s important to set realistic expectations.
We can be sure of one thing: 2026 will not be a straight line higher.
There will be disruptions. There will be uncertainty. There will be corrections. We’ve been through this cycle many times before, in different forms and under different headlines. Volatility is not an anomaly—it is the natural rhythm of markets.
What matters is not if corrections occur, but how we respond to them.
Our Techno-Fundamentals approach—combining technical analysis, intermarket relationships, market internals, and disciplined money management—exists for this exact environment. We take calculated risks, not emotional ones. We let price lead, not news, opinions, or social media narratives.
Corrections will create fear for some—and opportunity for others.
Our job is to remain objective, patient, and prepared, using structure and probabilities rather than reacting to noise.
Hope on the Horizon:
Looking ahead, income from tariffs and curtailing that mass corruption gives real hope for the future. For years, the exploding national debt has been held up as the inevitable trigger that would bankrupt America—and had nothing changed, that outcome would have been increasingly likely.
The price action throughout 2025 suggests investors believe the trajectory has shifted. While the debt remains enormous, the policy changes initiated in 2025 appear to have moved the country away from the edge of the cliff. The market’s vote throughout 2025 implies we have stepped back from the edge—and that renewed confidence gives us something invaluable as we move into 2026: hope grounded in reality, not rhetoric.
That renewed confidence is not abstract—it is already shaping where capital is flowing, and nowhere has that been more evident in 2025 than in artificial intelligence (AI).
AI in 2025: From Hype to Infrastructure
No reflection in 2025 would be complete without addressing artificial intelligence.
AI moved from buzzword to backbone.
Productivity gains became real. Cost savings showed up on balance sheets. Healthcare accelerated diagnostics and drug discovery. Biotechnology advanced. Education became more adaptive and personalized.
At the same time, the downsides became obvious.
Job displacement—especially in lower-wage and staffing-heavy sectors—was immediate. Privacy concerns grew. Energy demand surged. Regulatory frameworks lagged.
We saw Quantum AI stocks explode, crash, and reset—classic bubble behavior. Some of those names may reemerge in 2026, but only after proper bases are formed.
One truth remains unchanged: semiconductors are the backbone of AI.
Leaders like NVIDIA and Broadcom remain core holdings.
And AI’s energy appetite will only grow.
Solar, nuclear, hydrogen, and possibly natural gas may all play roles moving forward. Utilities quietly became one of the most technically sound sectors of the year—something few predicted coming into 2025.
Looking Ahead to 2026
2025 wasn’t easy. It wasn’t smooth. And it certainly wasn’t boring.
But it was necessary.
The volatility, the frustration, and the erratic price action were the cost of transition. The optimism returning late in the year suggests markets believe the worst of the structural damage is behind us—even if the repair process is far from complete.
As traders and investors, our job was never to predict politics. It was to read price, respect risk, and adapt.
That doesn’t change in 2026.
What does change is opportunity.
Here’s to cleaner systems, smarter capital allocation, disciplined trading, and letting price—not emotion—do the talking in the year ahead.
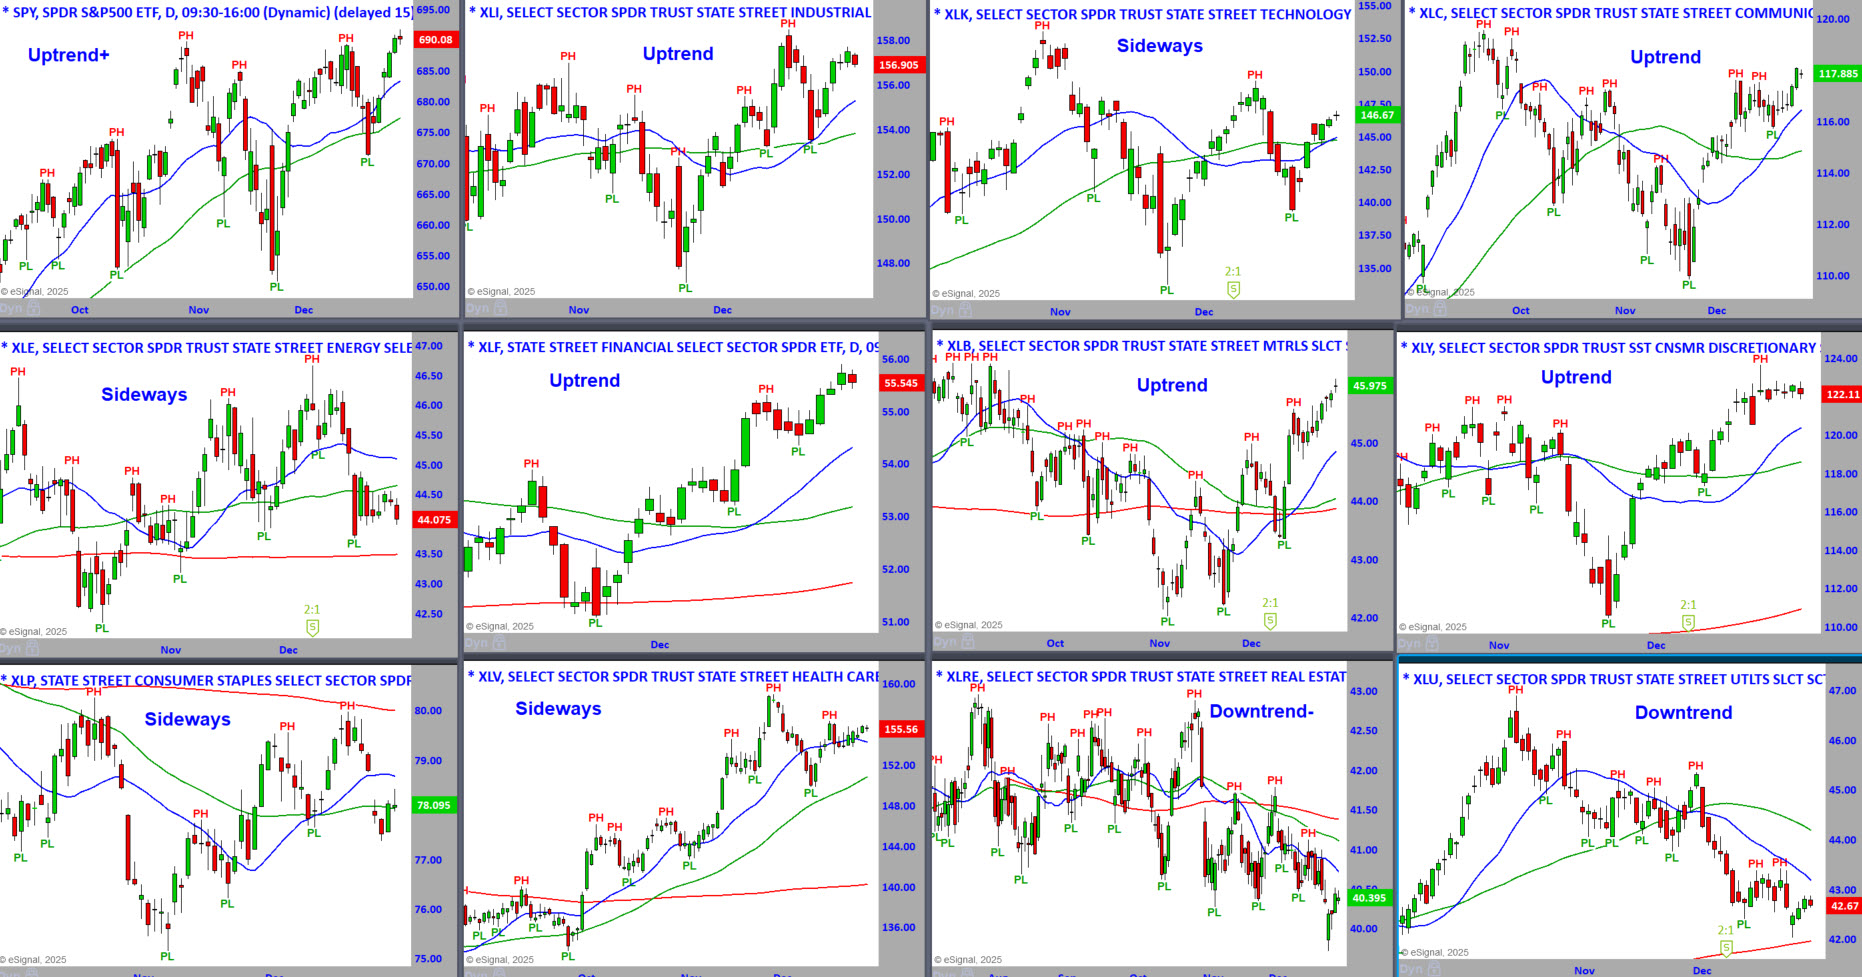
S&P Sector ETFs – Daily Charts - To See a Larger Image,
Right-Click and Press Open in a New Tab
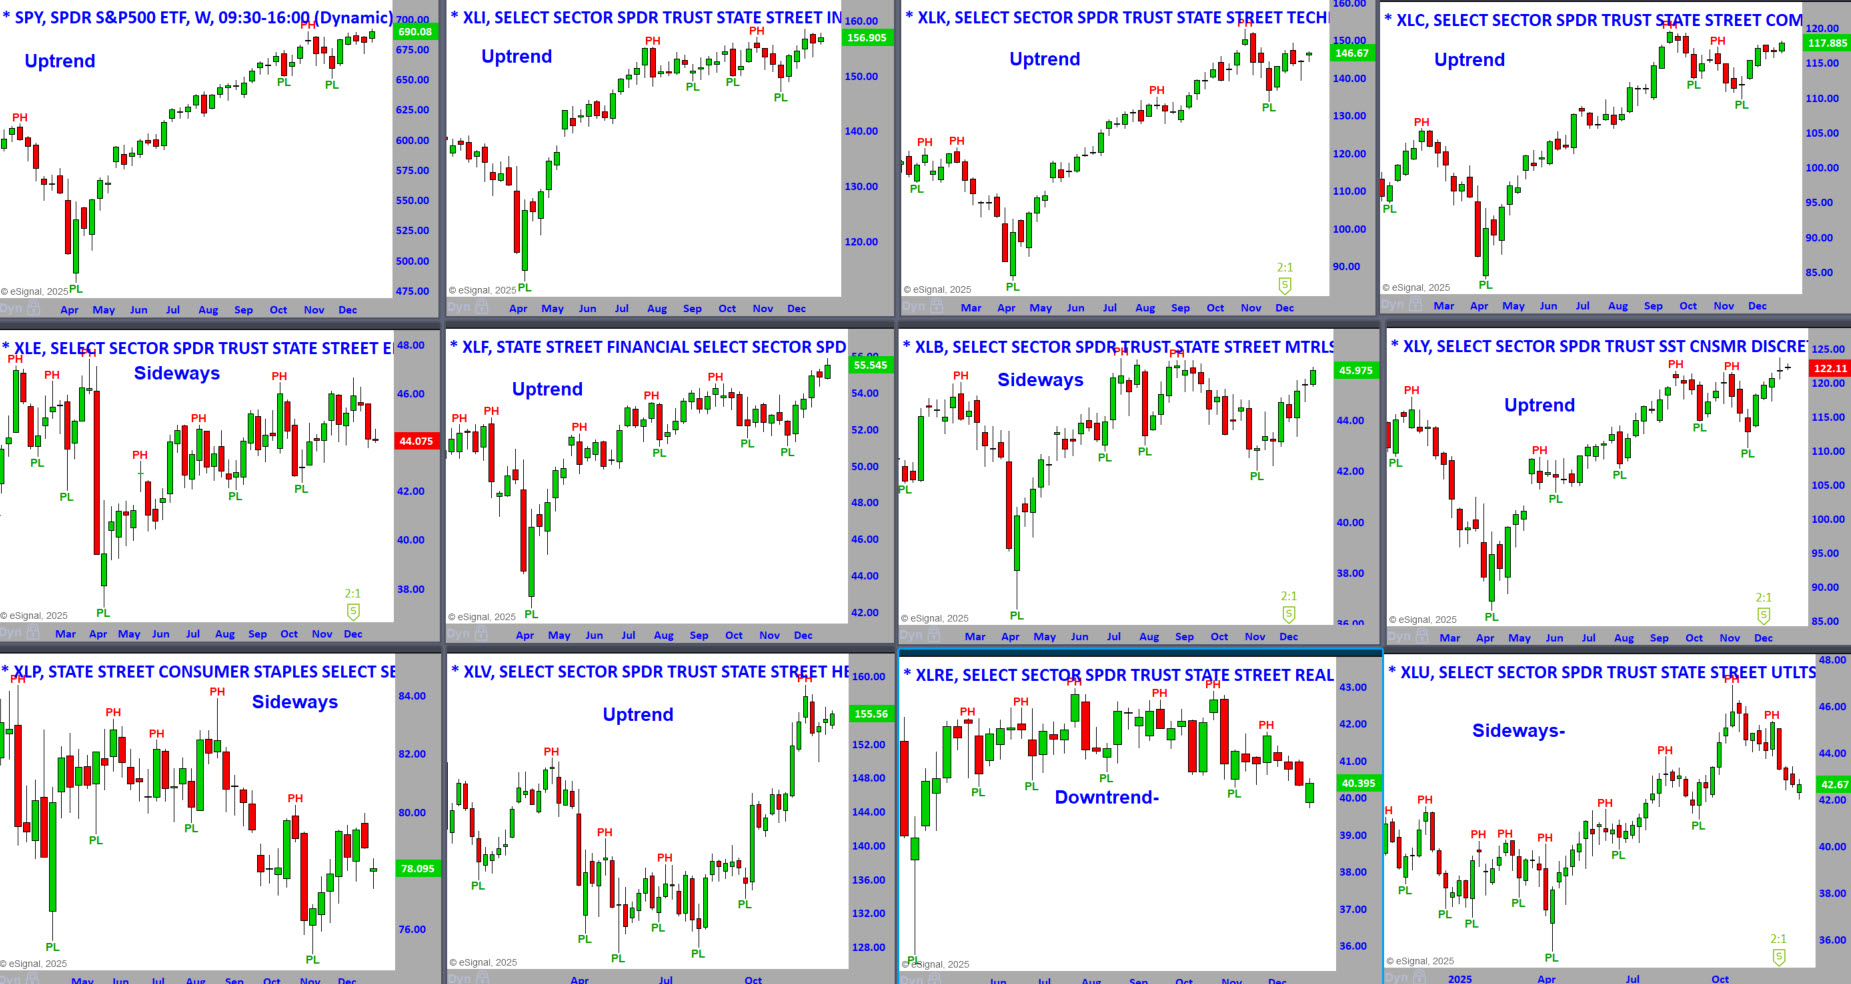
S&P Sector ETFs – Weekly Charts - To See a Larger Image,
Right-Click and Press Open in a New Tab
S&P Sector ETFs – Sorted by Weekly Percent Change This Week
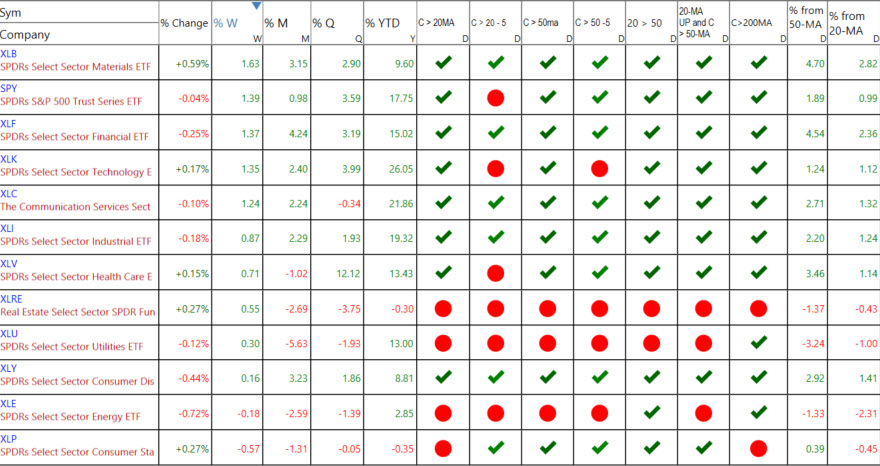
Last week’s percentage changes.
The percentage changes tell you which sectors were the strongest or weakest on Friday and for the week, month, quarter, and year.
There are seven columns after the percent changes in the sector listed above.
You can see the ETFs that are the strongest getting stronger or weakening.
- Close above or below the 20-MA.
- Close above or below the 20-MA 5 Days Ago. C>20 -5
- Close above or below the 50-MA.
- Close above or below the 50-MA 5 Days Ago. C>50 -5
- 20-MA above or below the 50-MA.
- 20-MA is pointed up, and the close is above the 50-MA


Master Trader Holiday Sale: Courses, Memberships & More
Special deals for traders and investors of every level — enjoy savings that pay off all year long, CLICK HERE
Where are the Markets Headed this Week?
This is a holiday-shortened week: Markets close early on Wednesday at 1 PM (New Year's Eve), are fully closed on Thursday (New Year's Day), and open on Friday all day, but trading is thin and typically finishes by noon.
Trading volume is expected to be thin, increasing the potential for outsized moves on low liquidity. Hopes are for a traditional Santa Claus rally.
Indices moved up last week, in a slow grind, and many are near resistance.
Internals are neutral.
There are many relatively tight ranges within broader ranges, which don't suggest significant moves.
However, some could advance in this short holiday week.
DOW JONES
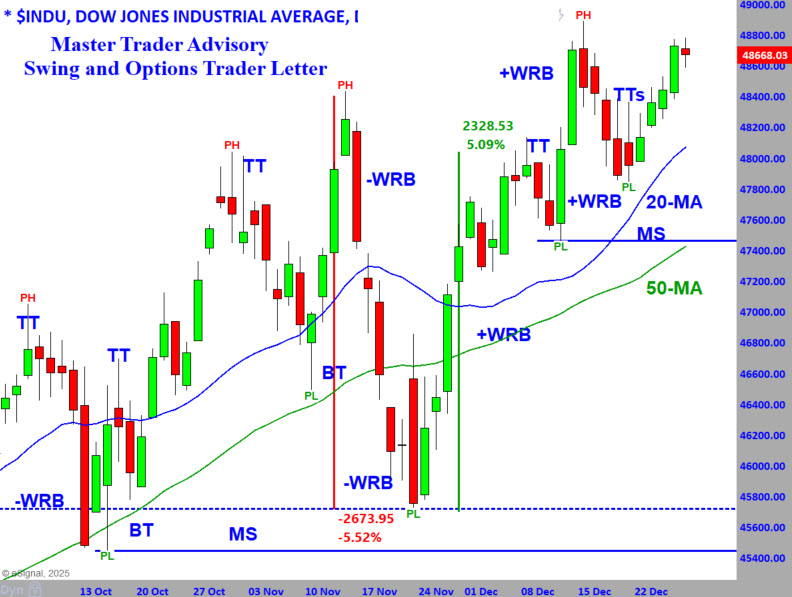
The Dow has been highly erratic, with wide down-and-up swings, but it remains in an uptrend and set new all-time highs last week.
The Dow advanced within the recent retracement to the rising 20-day moving average.
It's approaching the pivot high (PH) resistance, but in the uptrend, we assume the trend will continue, and the odds are a move above the PH.
That move would be new all-time highs, and the DOW would join the S&P 500.
The Transports also made new all-time highs, so a new Dow Theory confirmation of the bull market.
VIDEO REVIEW OF MARKETS, SECTORS AND INTERNALS - Click lower right to open Full Screen.
NEW STOCK TRADING IDEAS and Video Update Below
NOTE: Please see the document in RESOURCES entitled Master Trader Guidelines for Trading the Open and Gaps.
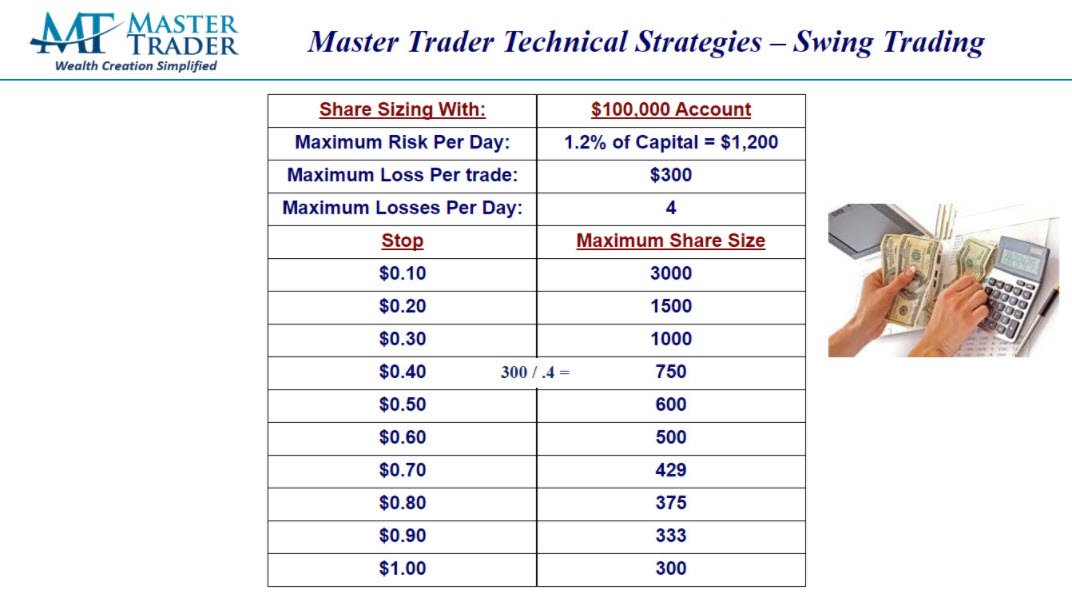
Note on Position Size Calculation in the Open Trades Sheet:
All trades are based on a hypothetical Max Loss of $300/trade. For Stocks, that is $300 / (Entry - Stop). Directional option trades use the same formula, then divided by 100, rounded down to the nearest whole number, with a minimum of one (1).
The “Master Trader Blended Method” for shorting options/spreads size starts with the stock position size, multiplying by 1.5, then divide by 100 because 1 contract represents 100 shares.
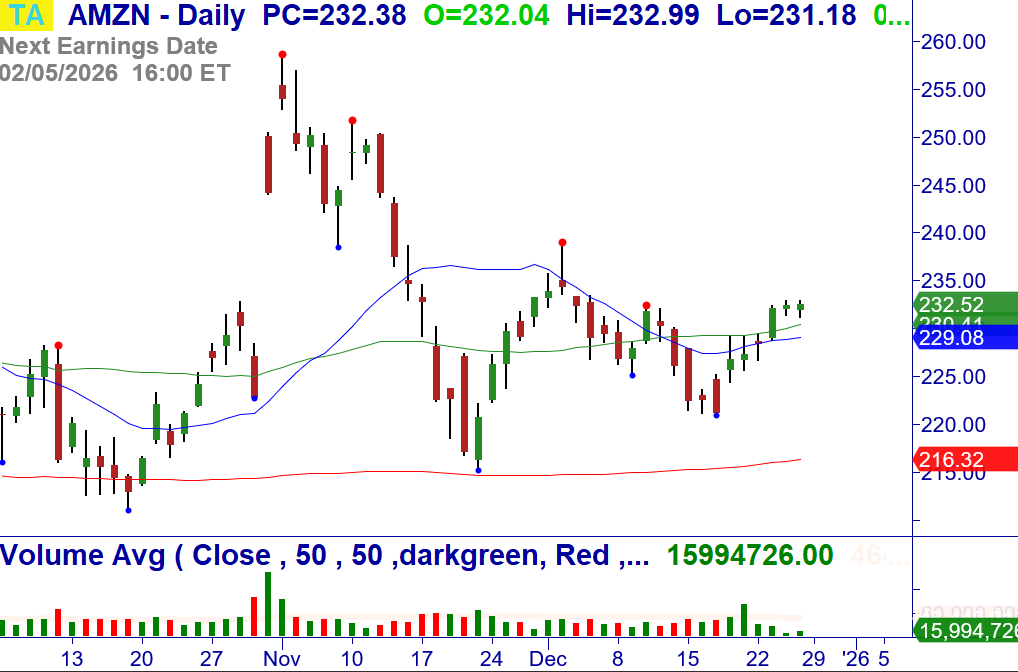
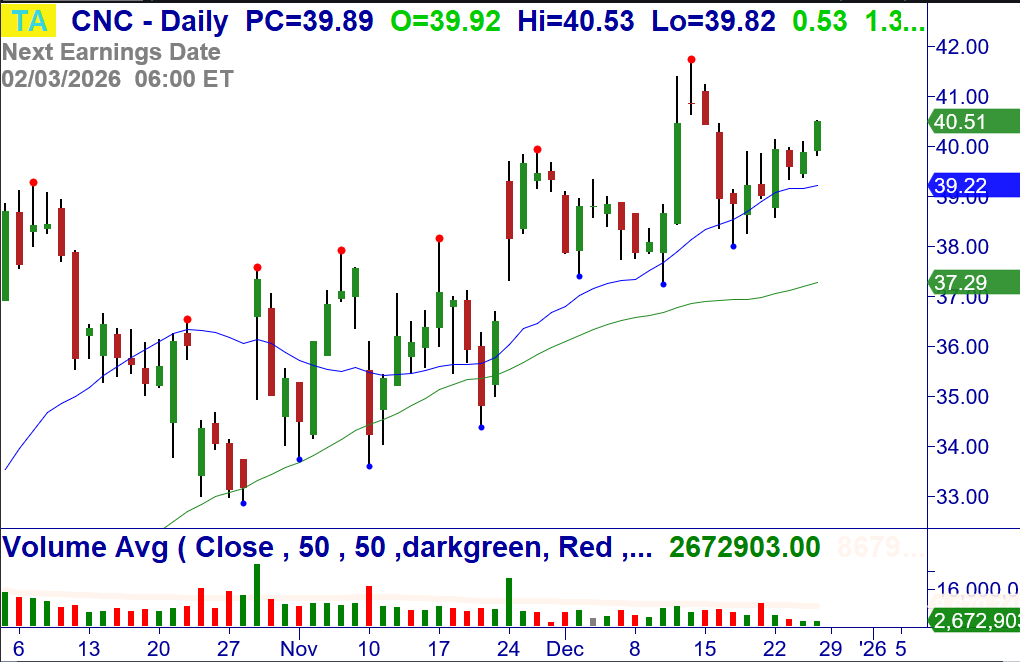
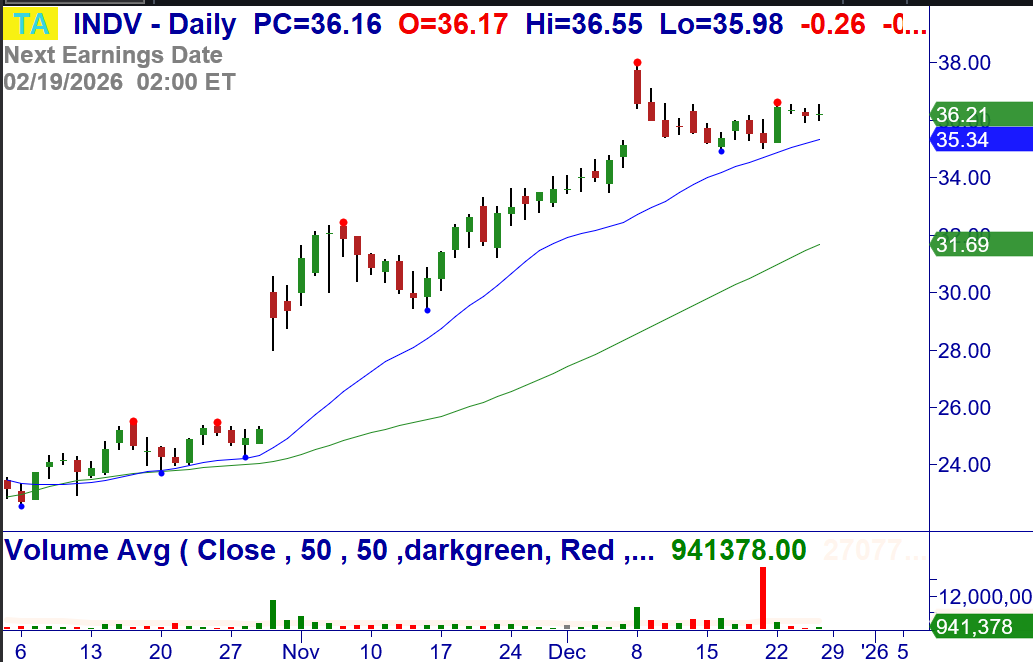
A number of our suggested trades have larger stops because of Friday's expanded volatility. Please calculate position size according using your Max Loss per your Trading Plan.
Here's an example:
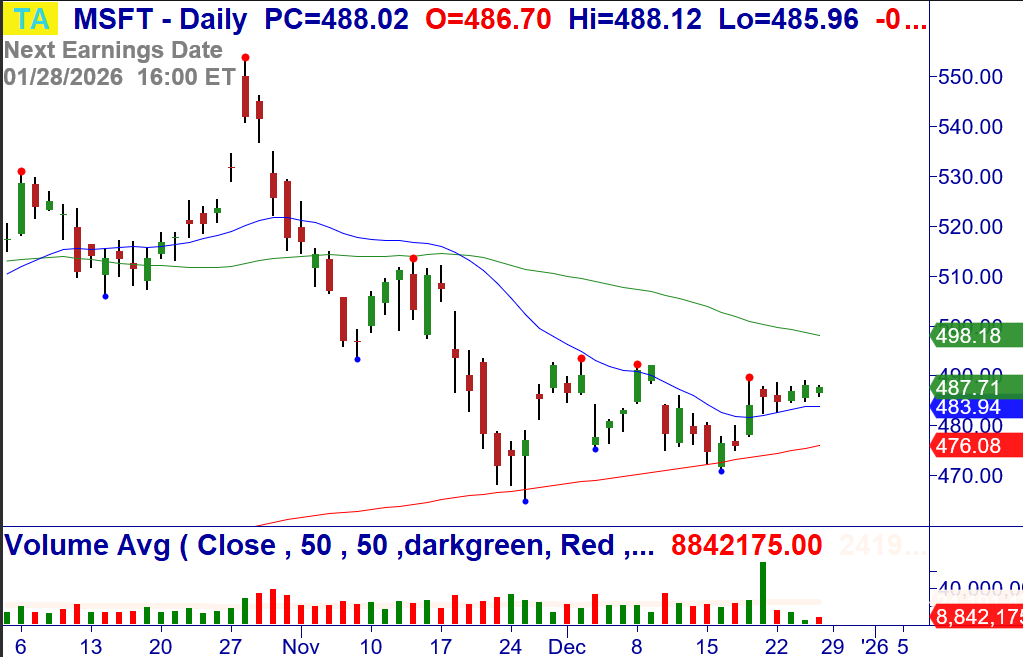
12/29: MSFT – Over $489.16, consider buying the stock. Anticipated Breakout of a bottoming pattern at the 20-MA. Stop $482.38.
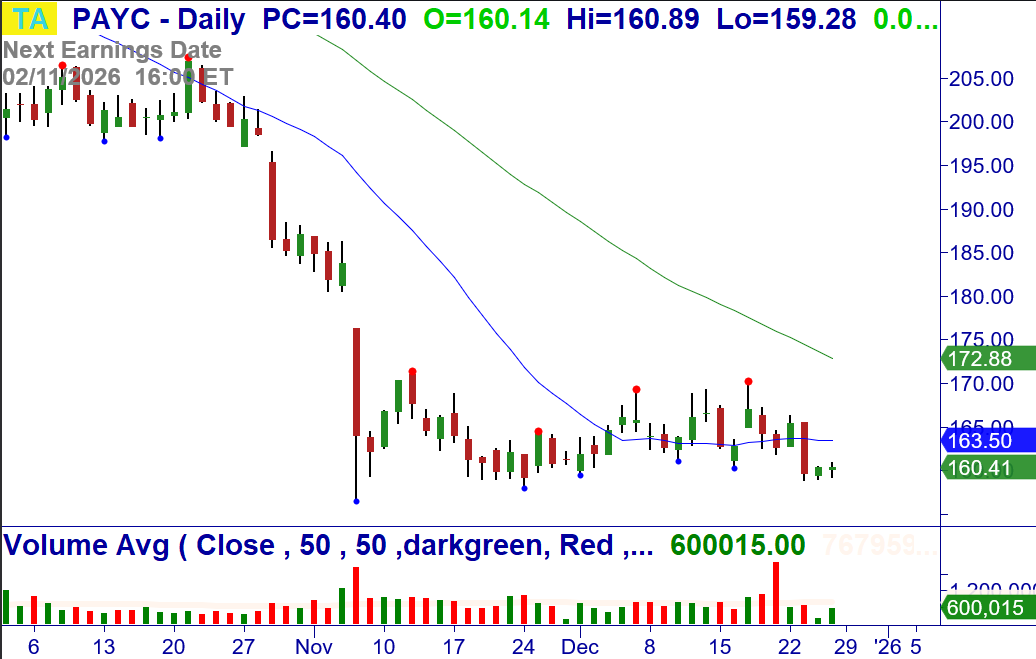
12/29: PAYC – Under $158.86, consider shorting the stock. -1234 Breakdown at the 20-MA. Stop $165.62.
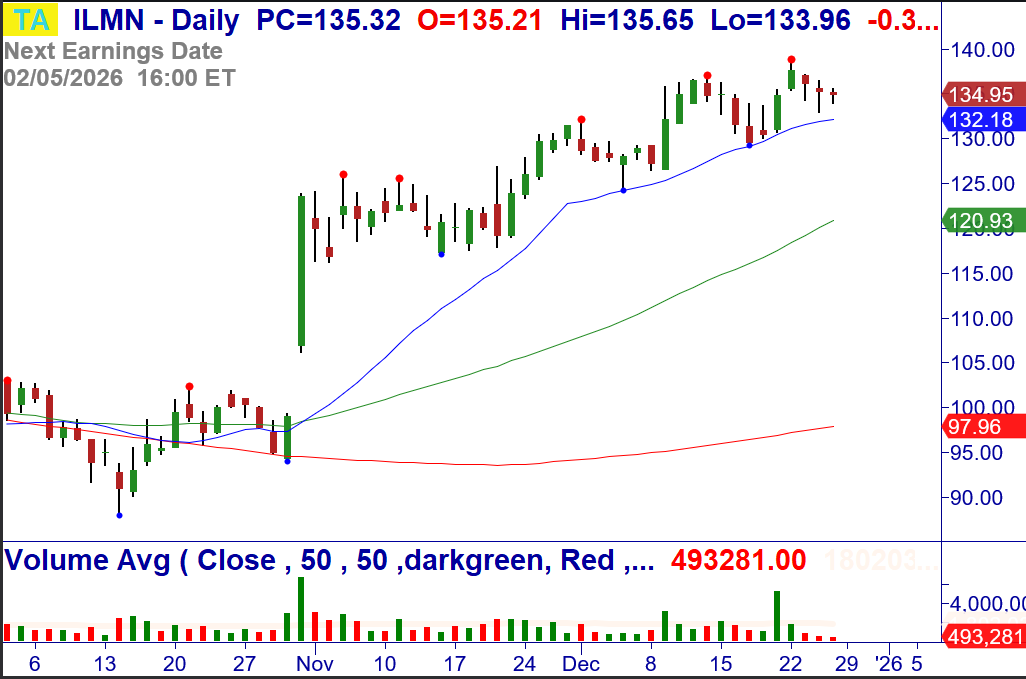
12/29: ILMN – Over $135.92 (intra-day resistance), consider buying the stock. Buy Setup and reversal at the 20-MA. Stop $130.74.
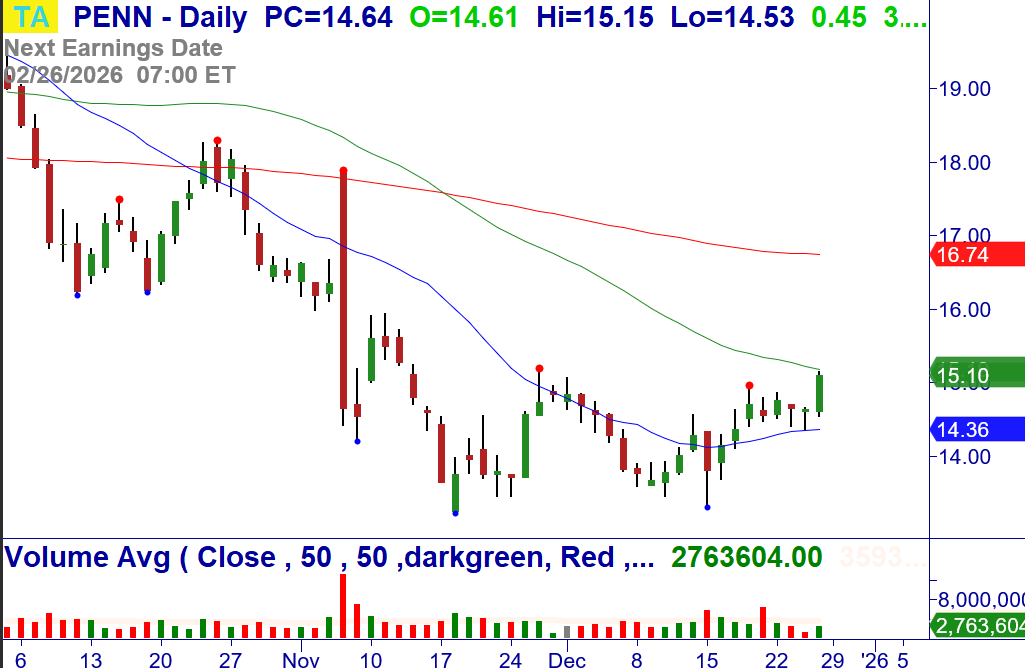
12/29: PENN – Over $15.15, consider buying the stock. +WRB Breakout of a bottoming pattern at the 20/50-MA. Stop $14.53.
12/29: EFX – Over $222.16, consider buying the stock. Breakout of a bottoming pattern at the 20/50-MA, +123 weekly. Stop $217.36.
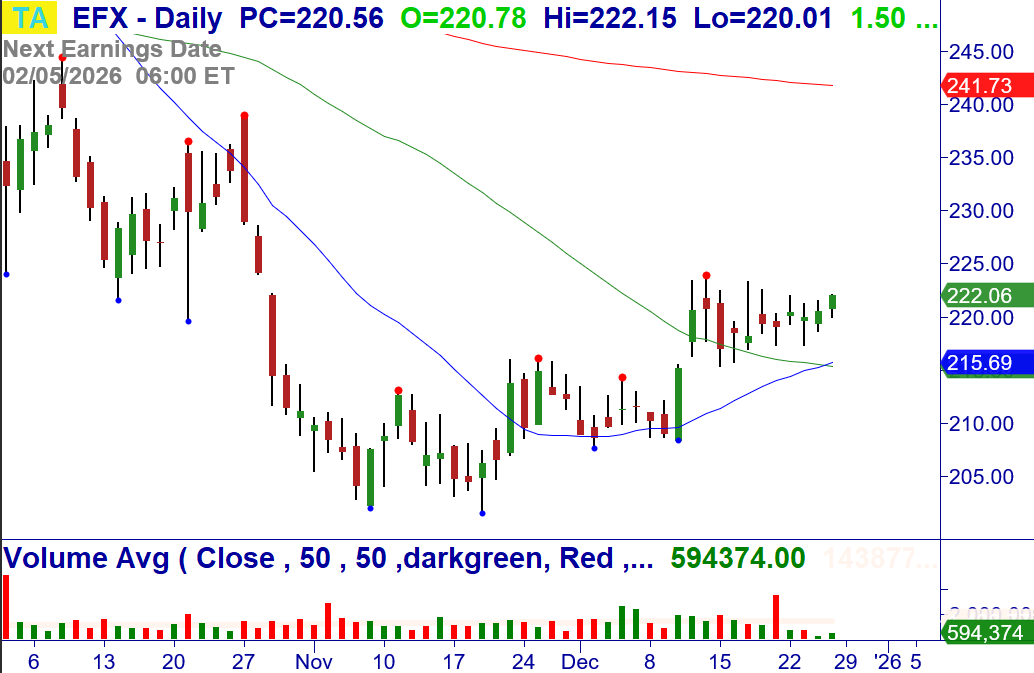
12/29: ODFL – Over $160.46, consider buying the stock. Breakout. Stop $156.28.
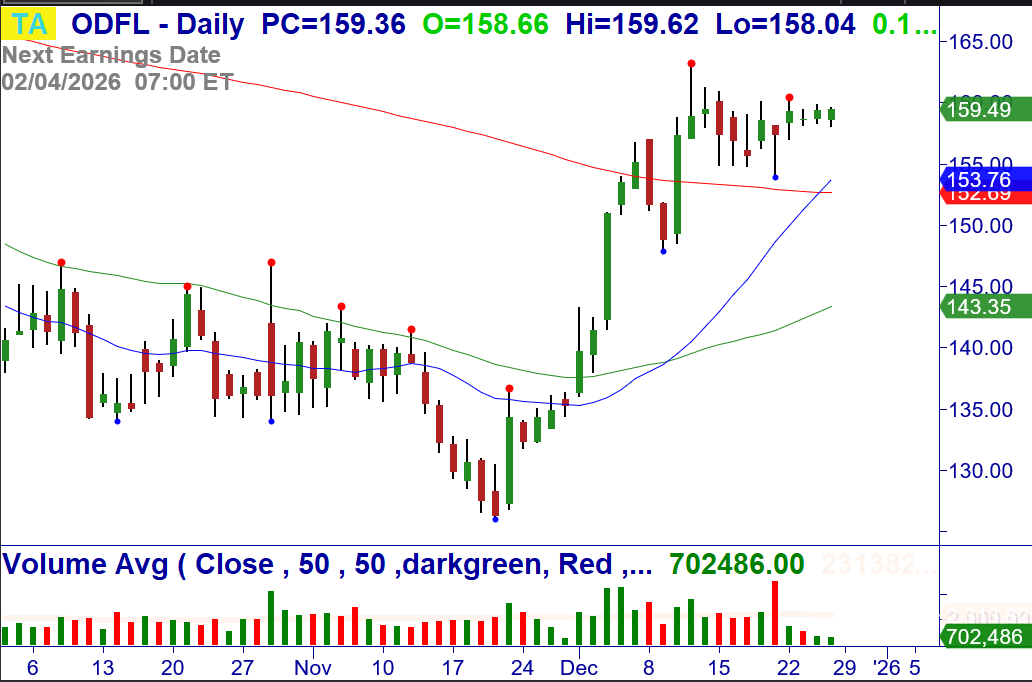
12/29: PEGA – Over $62.67, consider buying the stock. Breakout. Stop $61.08.
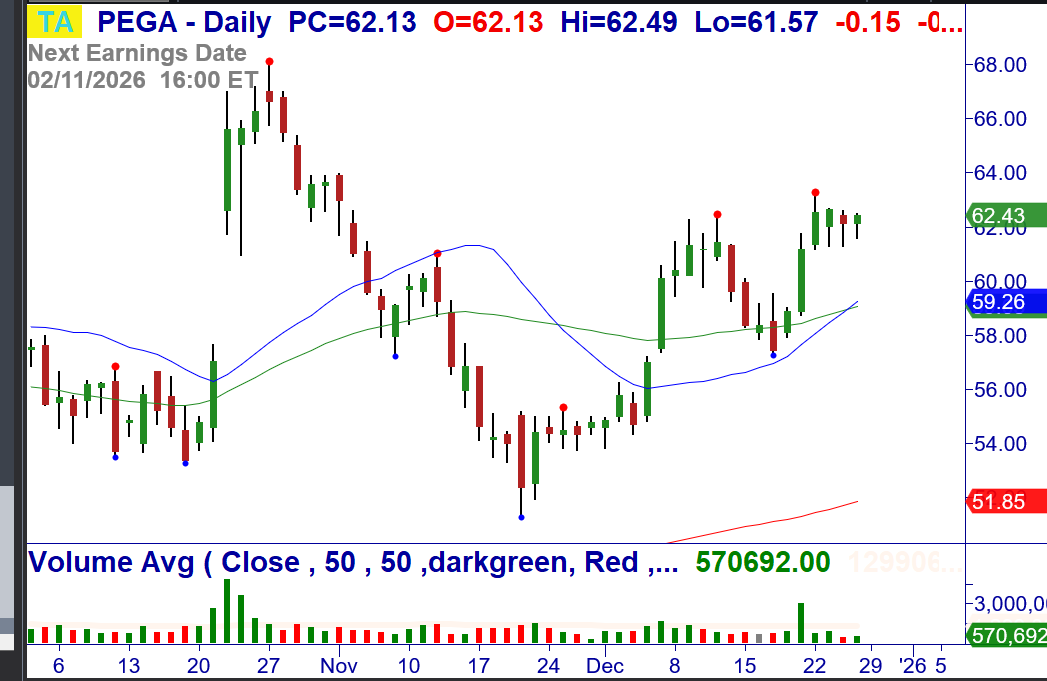
12/29: FN – Over $489.67, consider buying the stock. Breakout at the 20-MA. Stop $471.98.
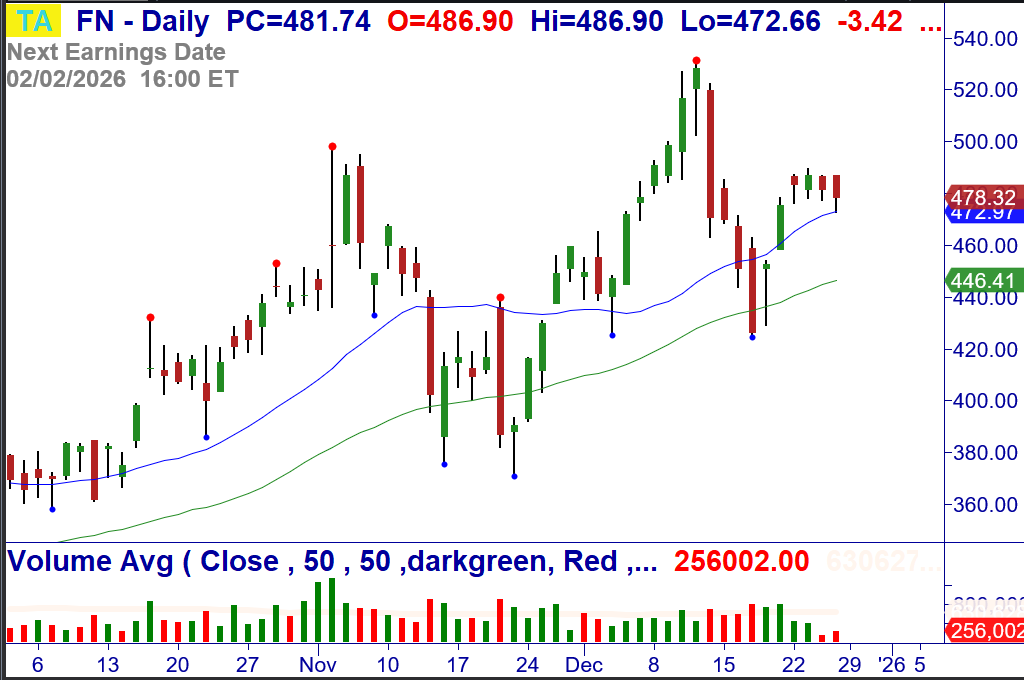
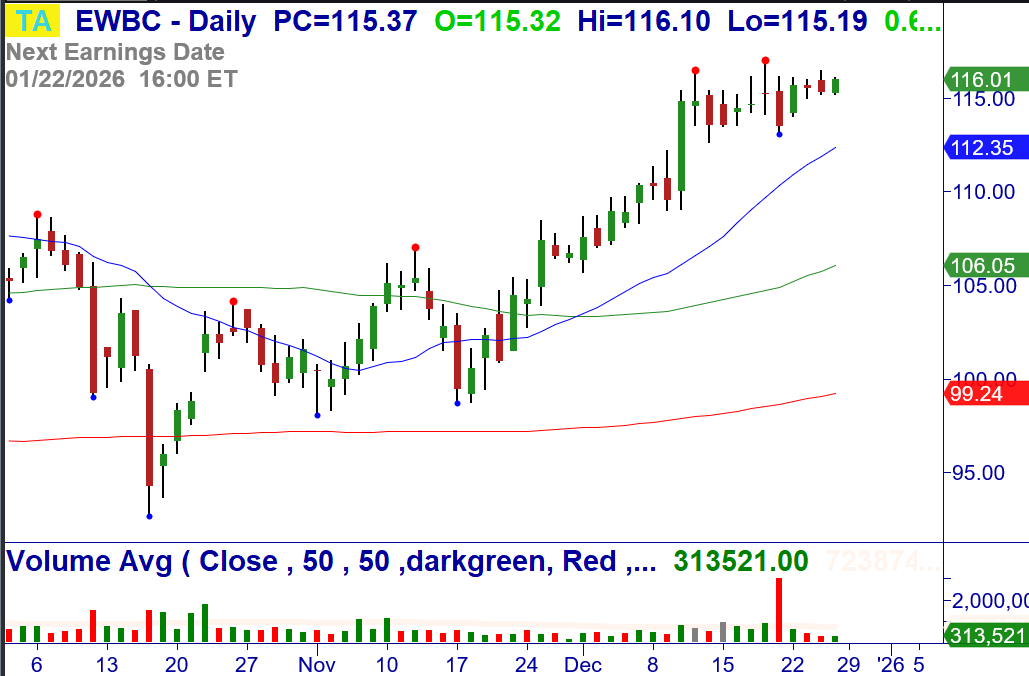
12/29: EWBC – Over $116.49, consider buying the stock. Breakout. Stop $113.98.
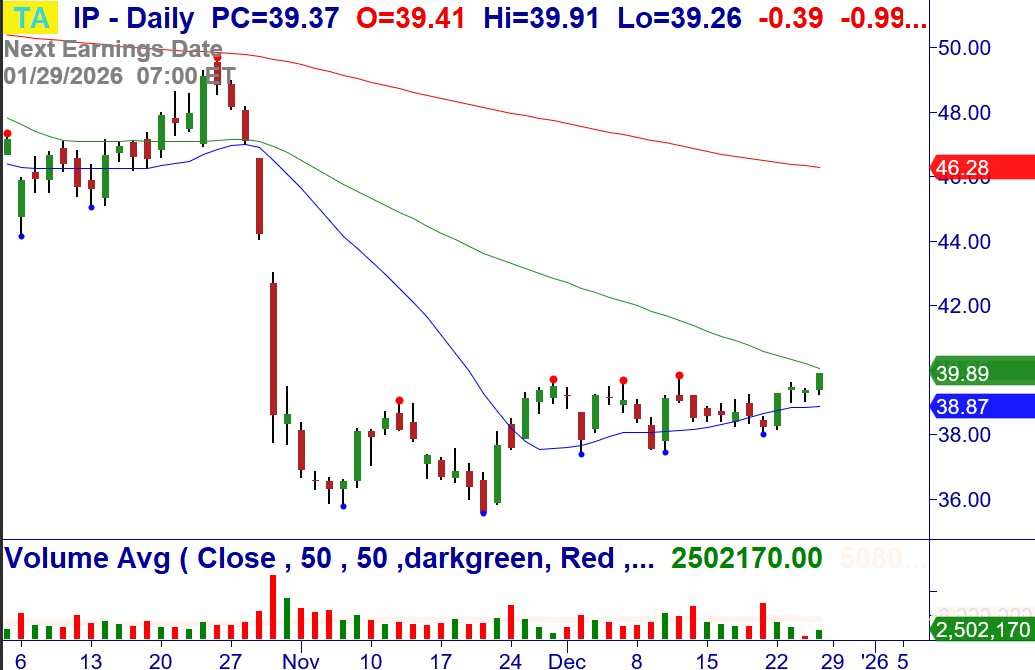
12/29: IP – Over $39.91, consider buying the stock. Breakout of a bottoming pattern at the 20/50-MA. Stop $38.65.
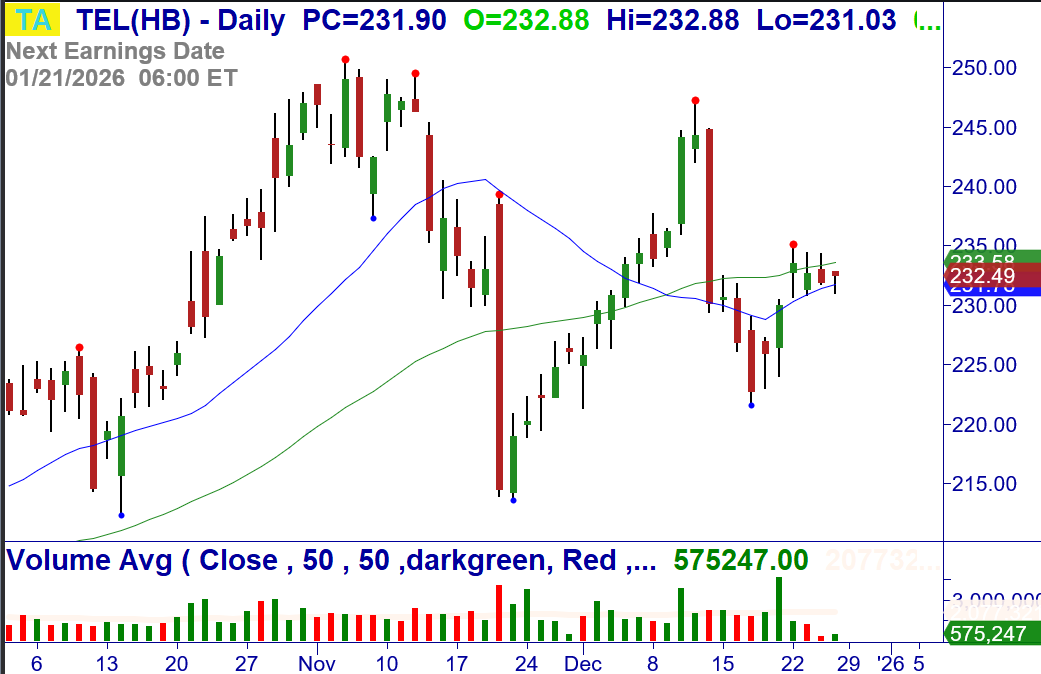
12/29: TEL – Over $234.47, consider buying the stock. Breakout at the 20/50-MA. Stop $230.48.
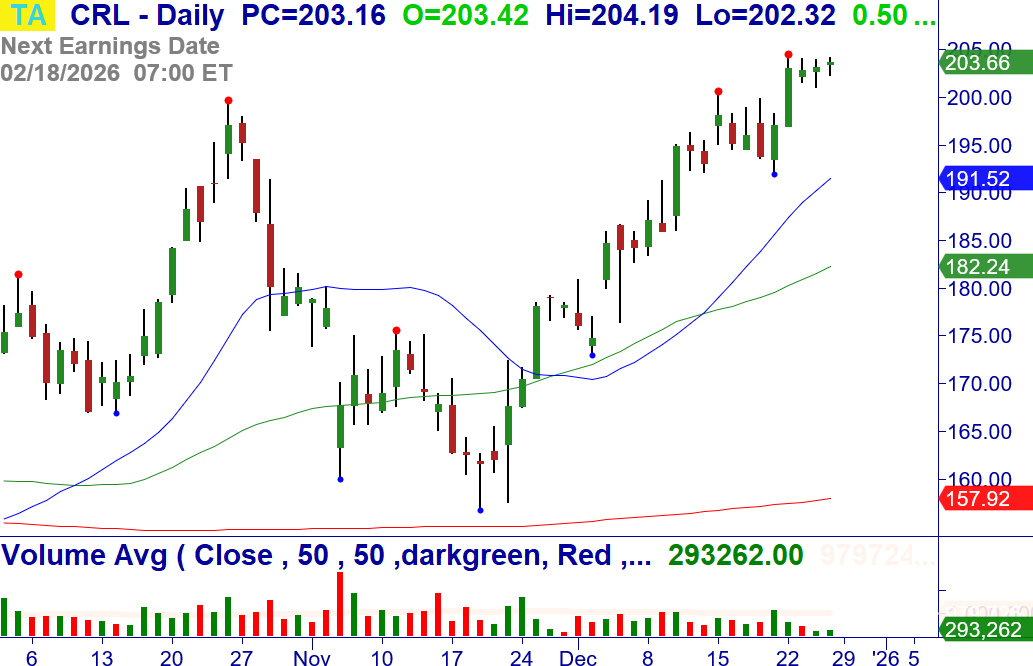
12/29: CRL – Over $204.47, consider buying the stock. +1234 Breakout. Stop $197.88.
Money Management for Trading and Investing
Proper money management for investing and Trading starts with position-sizing based on the amount of money you are willing to risk on a signal trade.
CLICK HERE to review these Master Trader Guidelines and Basic Money Management and Position Sizing Table.
NEW OPTIONS TRADING IDEAS
Directional Options Strategies and Debit Spreads for Swing Trading (See the Weekly Options Trader letter, which sells options/spreads for weekly Income that primarily expire in 10 days or less, CLICK HERE)
The Master Trader approach to selling credit spreads around technical turning points.
Read about the Weekly Options Trader letter, which sells options/spreads for weekly Income that primarily expire in 10 days or less, around Master Trader technical turning points, CLICK HERE
By selling spreads on stocks and ETFs where MTS indicates price is unlikely to go, we become the “smart money,” getting paid to take calculated, well-defined risk.
Check out the blog article with more information and monthly results, CLICK HERE
Professional consistency, short-duration trades, and risk-controlled income — that’s what defines the Master Trader approach.
Master Trader Holiday Sale: Courses, Memberships & More
Special deals for traders and investors of every level — enjoy savings that pay off all year long, CLICK HERE
Because your success is vital to you – and us.
Before selling options or credit spreads, we urge you to review the valuable and detailed information that we have provided for you in your Member’s Area Resources.
A quick simplified approach to calculating contract size is to simply base your contract size based on the number of shares permitted in your Trading Plan as if you were trading the stock or ETF. Simple Share Sizing = $ Risk / Stop Loss
The amount of money that you are willing to risk – divided by – the stop loss amount. For example, $100 / .20 = 500 shares. Credit Spread example, if your Trading Plan allowed you to trade 543 shares of AAPL based on the stop loss, then simply round down to the nearest hundred and short an equivalent number of contracts of the option. Since 1 contract represents 100 shares of the underlying, this would be five (5) contracts.
Master Trader and You Building Your Financial Future Together!
Good trading!
If you have any questions or comments, please e-mail Greg Capra at Greg@mastertrader.com or Dan Gibby at Dan@mastertrader.com
All the best,
Greg Capra Managing Director of Master Trader
Dan Gibby Chief Options Strategist
NOTE: Master Trader will show the opening and closing prices of all stock and options trades. We recommend that all traders and investors use proper share sizing for positions and money management. However, we cannot recommend what that is for your particular trading style, risk tolerance, or account balance. We urge you to calculate your own share/position size based on your individualized risk parameters, Trading Plan, and familiarity with the proposed trade strategy and risk. Advanced Management Strategies (AMS) covers in detail foundation and advanced position and money management.
NOTE: Master Trader and its representatives may have existing positions in actual or other trade recommendations before or after suggested herein. Additionally, we may manage them differently for internal purposes based on different risk parameters than noted herein. All trade ideas and content are for informational and educational purposes only. It is not, nor is it intended to be, trading or investment advice or a recommendation that any security, option, or investment strategy is suitable for any person. Trading securities can involve high risk and the loss of any funds. Significant gaps or volatility can increase these losses, particularly for short option strategies. Investment or trading information provided may not be appropriate for all investors, and is provided without respect to individual financial sophistication, financial situation, investing time horizon or risk tolerance. Supporting documentation for any claims (including claims made on behalf of options programs), comparison, statistics, or other technical data, if applicable, will be supplied upon request. Master Trader Consulting, Inc. is not a licensed financial advisor, registered investment advisor, or a registered broker-dealer. Options, futures, and futures options are not suitable for all investors.