Some of last week’s comments included:
"The S&P 500 held 6800 on Friday, but that’s only a slight positive, and the level may have held because traders didn't want the exposure over the weekend. However, it was a significant amount of put options at the 6,715 strike expiring on Monday, so Friday’s bearish trading led to those bearish bets and hedges. 6,700 should provide a good support level. Between 6,800 and 6,700 is the widely followed 50-day moving average.”
Other than the typical up-and-down movements created by options expiration, which was a quarterly one, most indices didn’t move far from where they were the previous week.
Last week’s letter mentioned that 6700 should provide good support and that a large number of put options bought at the 6715 strike were expiring on Monday. Those bearish bets expired worthless on Monday.
However, there was a plunge down toward 6700 on Wednesday that just missed the 6715 strike before the decline stopped.
Wednesday's plunge was driven by continued weakness in tech, stemming from the AI bubble theme that collapsed Oracle and Broadcom and began to spill over into other tech stocks.
Wednesday’s bearish wide-range bar (-WRB) came after several down days and seemed like capitulation, but, as with any pattern, we need to see confirmation of the bias. I did mention in the Green Room that it was unlikely the markets would collapse during a quarterly options expiration.
The largest Open Interest in S&P 500 (SPX) calls was at 6800. When prices move far from the highest open-interest strike during an options expiration, there is a tendency for prices to move back toward that area.
The inflation data on Thursday was lower than anticipated, helping stabilize the markets, and the 6800 high open interest began to pull prices toward it.
Interest rates, as measured by the 10- and 30-year yields, pulled back from their recent moves higher, which also helped the broader markets avoid those higher yields as a headwind.
Upbeat earnings from Micron Technology (MU) also brought life to the beaten-down semiconductors, and while Nvidia (NVDA) moved higher on Friday, it severely underperformed. Considering it was in a Major Support (MS) area, a move higher with the rest of the markets played out.
On Friday, the markets moved up for the first 20 minutes as if they were going to make new all-time highs, but by 10 AM ET, trading began to flatline as if the world had already gone on holiday.
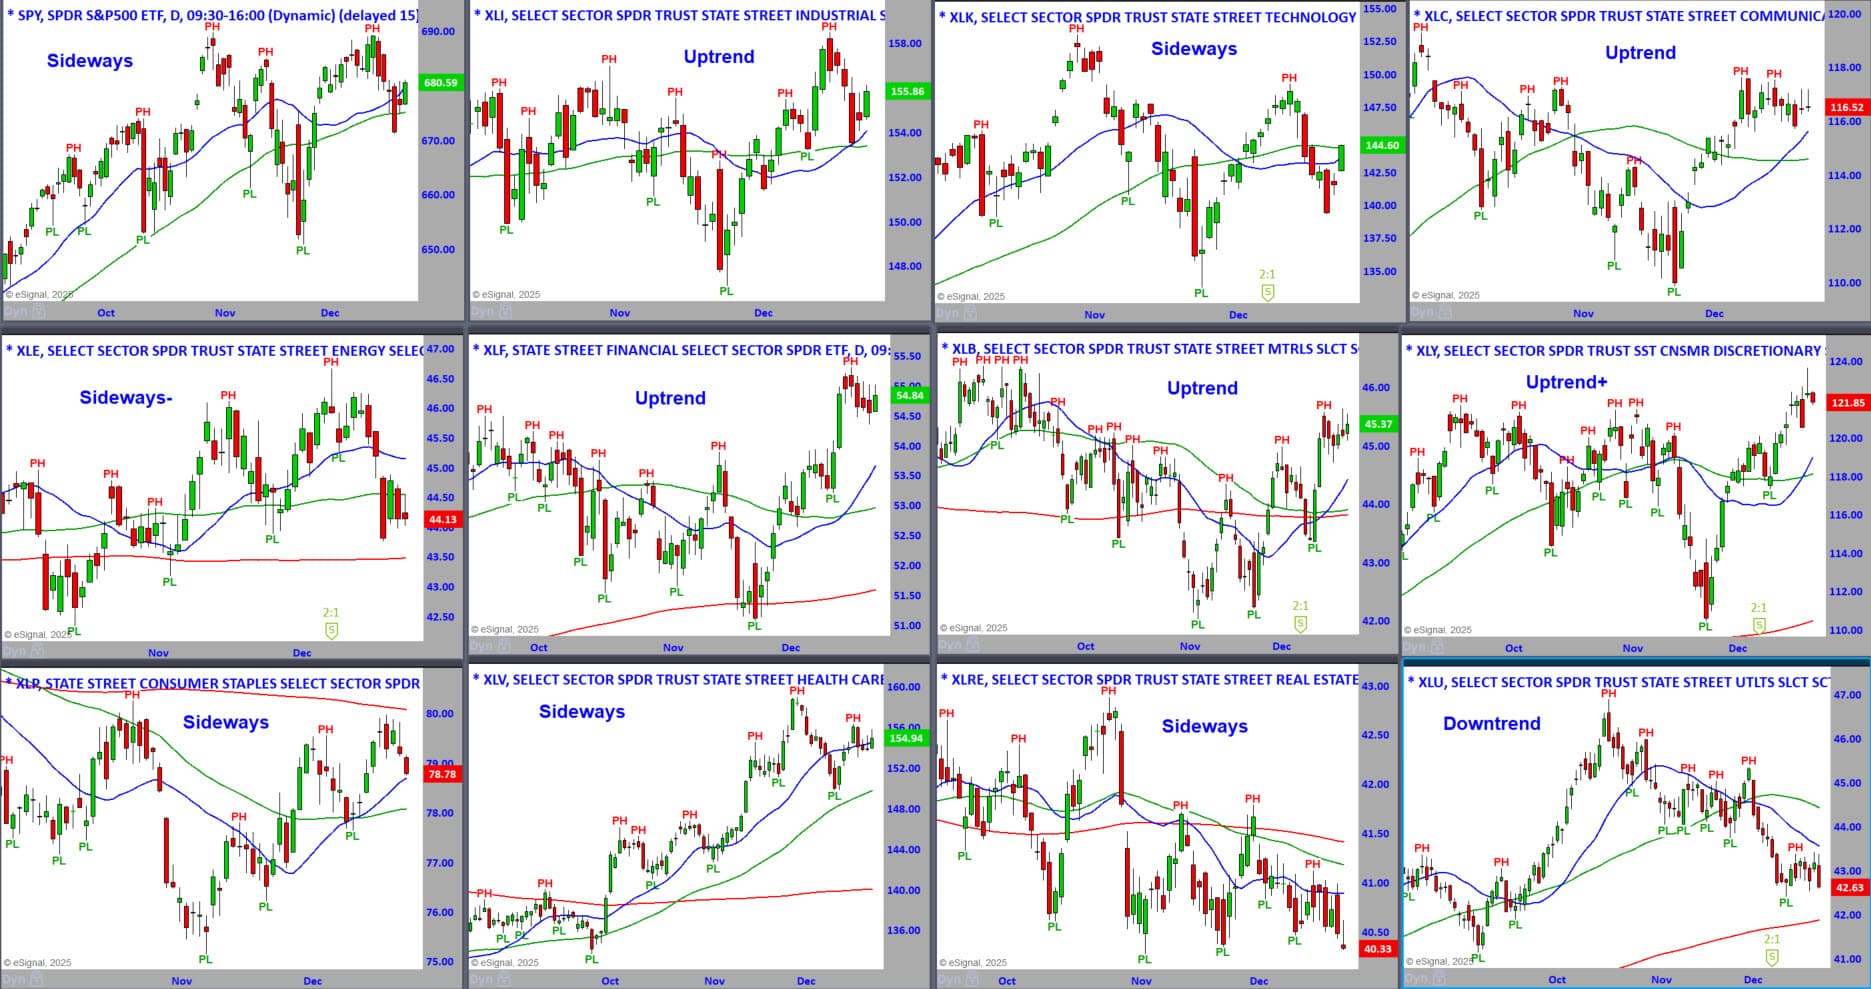
S&P Sector ETFs – Daily Charts - To See a Larger Image,
Right-Click and Press Open in a New Tab
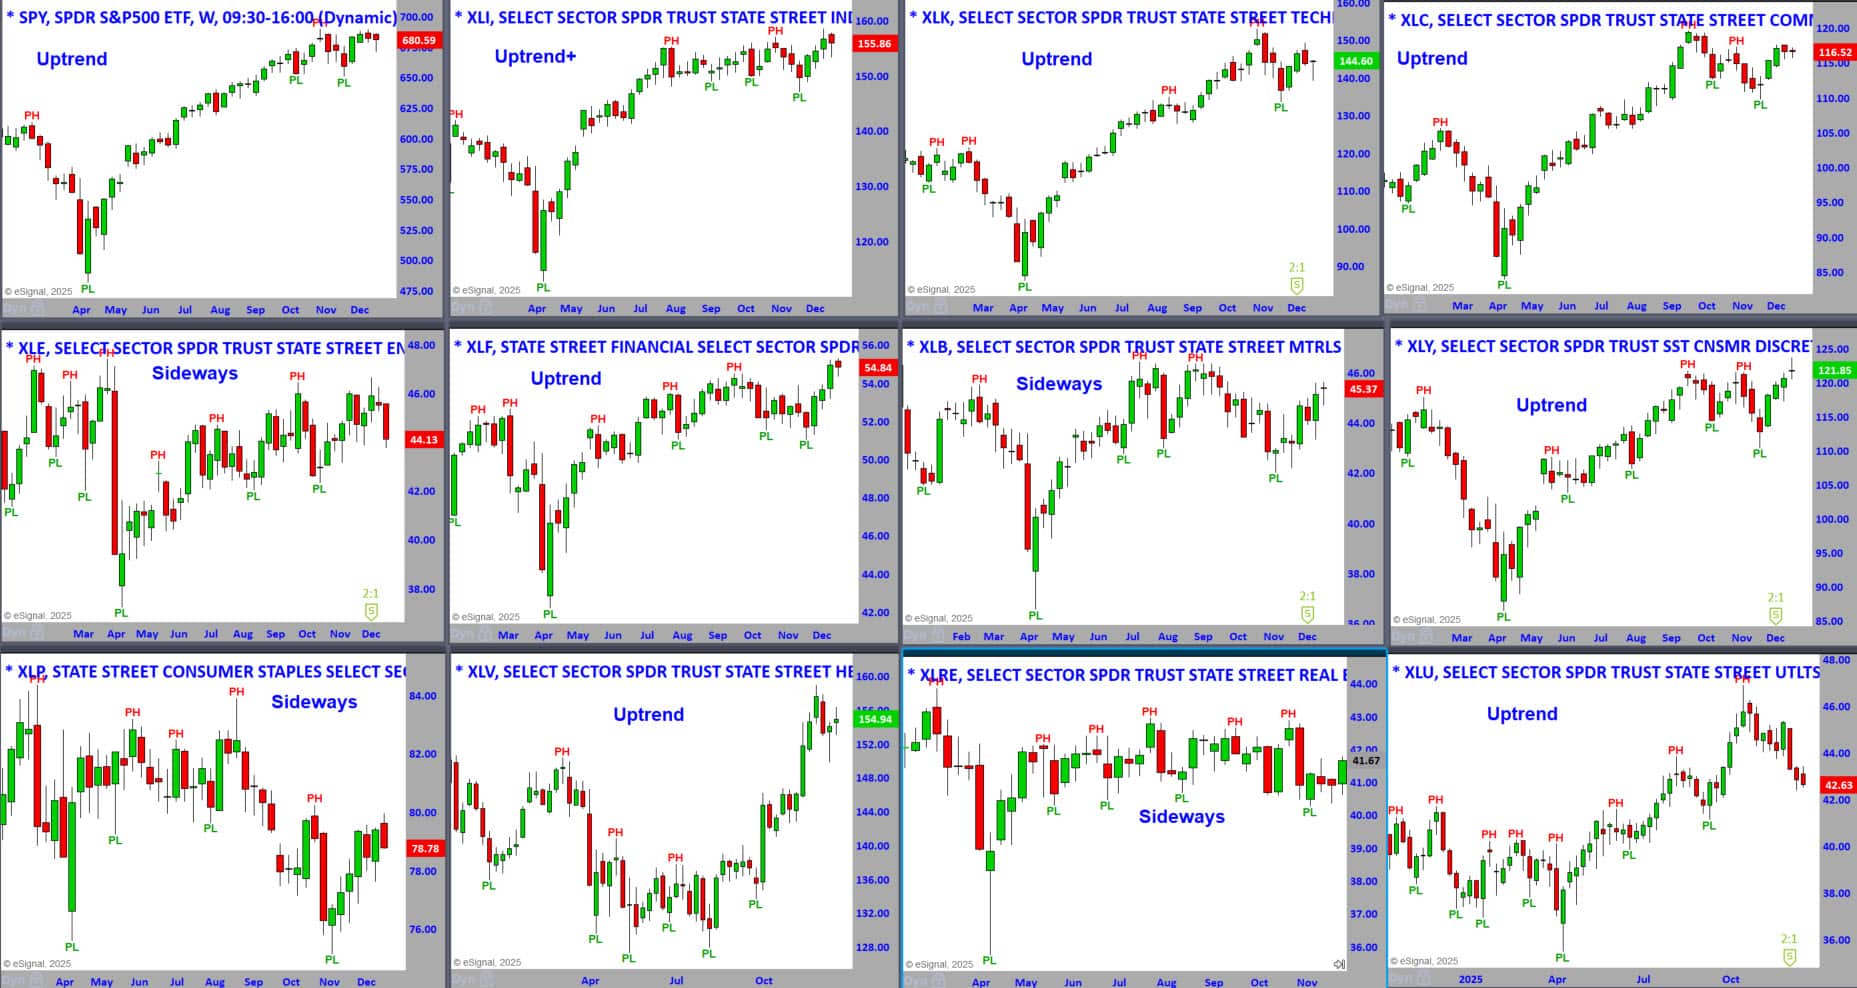
S&P Sector ETFs – Weekly Charts - To See a Larger Image,
Right-Click and Press Open in a New Tab
S&P Sector ETFs – Sorted by Weekly Percent Change This Week
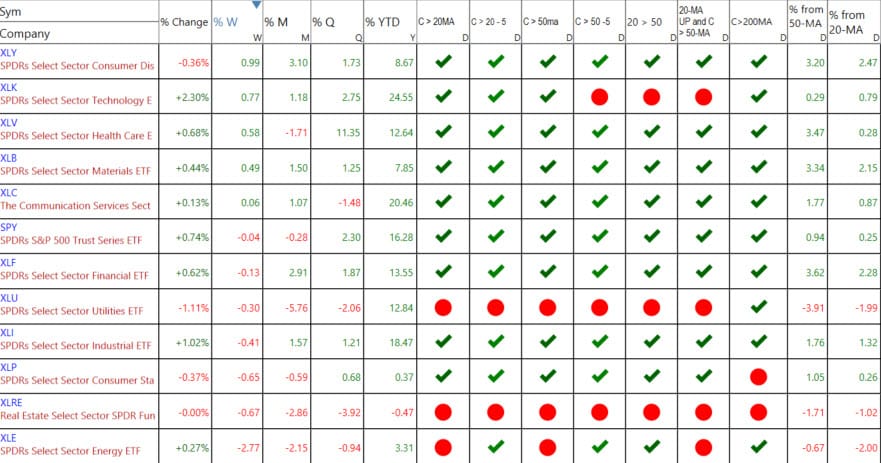
Last week’s percentage changes.
The percentage changes tell you which sectors were the strongest or weakest on Friday and for the week, month, quarter, and year.
There are seven columns after the percent changes in the sector listed above.
You can see the ETFs that are the strongest getting stronger or weakening.
- Close above or below the 20-MA.
- Close above or below the 20-MA 5 Days Ago. C>20 -5
- Close above or below the 50-MA.
- Close above or below the 50-MA 5 Days Ago. C>50 -5
- 20-MA above or below the 50-MA.
- 20-MA is pointed up, and the close is above the 50-MA


Master Trader Holiday Sale: Courses, Memberships & More
Special deals for traders and investors of every level — enjoy savings that pay off all year long, CLICK HERE
Where are the Markets Headed this Week?
This is a holiday-shortened week: Markets close early on Wednesday at 1 PM (Christmas Eve), are fully closed on Thursday (Christmas), and open on Friday all day, but trading is thin and typically finishes by noon.
Trading volume is expected to be thin, increasing the potential for outsized moves on low liquidity. Hopes are for a traditional Santa Claus rally.
The pullback in the NASDAQ 100 of about 5% and about 10% in semiconductors was enough to push sentiment gauges toward a bullish level, but not quite all the way there.
Breadth retraced to a neutral level of zero, and historically, after moving as sharply higher as it did a couple of weeks ago, the zero level is where markets turn up.
There are economic reports on Tuesday, and while they are unlikely to be significant influences, they could be the excuse to move the markets higher.
Considering it’s a holiday week and nearing the end of the year, there should be little risk of a significant move lower and a greater probability of moving higher toward overhead resistance.
DOW JONES
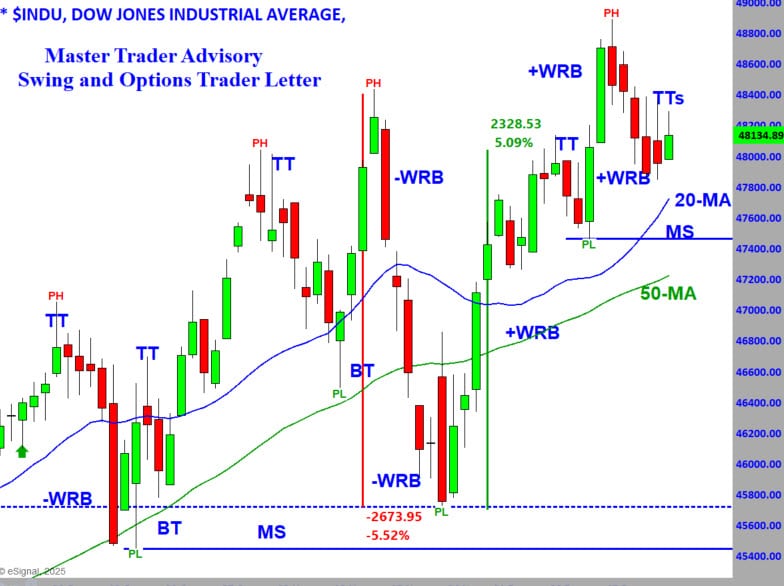
The Dow has been highly erratic, with wide down-and-up swings, but it remains in an uptrend and set new all-time highs last week.
The Dow retraced below the bullish wide-range bar (+WRB), which is often a sign that a trend is failing; however, the highest wide-range bar was preceded by another bullish wide-range bar, and that’s where prices stabilized last week.
Where prices held is also the area of Minor Support (resistance that was overcome), and historically, prices have held in a strong uptrend.
On each attempt to move higher on Thursday and Friday, prices were rejected, forming minor Topping Tail (TT) bars.
If the Dow can overcome those TTs and prices are in an existing uptrend, I think there is a reasonable probability the Dow could make new all-time highs, which would confirm Santa is coming to town!
Major Support (MS) is the Pivot Low (PL) just below the rising 20-MA. Unless that level is violated, assume the trend will continue higher.
VIDEO REVIEW OF MARKETS, SECTORS AND INTERNALS - Click lower right to open Full Screen.
NEW STOCK TRADING IDEAS and Video Update Below
NOTE: Please see the document in RESOURCES entitled Master Trader Guidelines for Trading the Open and Gaps.
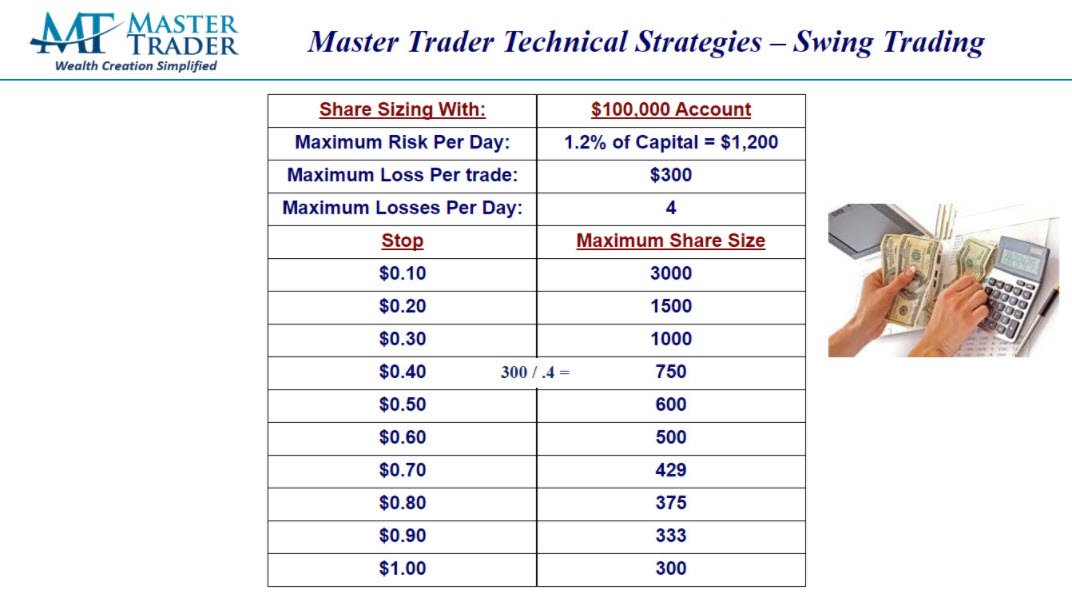
Note on Position Size Calculation in the Open Trades Sheet:
All trades are based on a hypothetical Max Loss of $300/trade. For Stocks, that is $300 / (Entry - Stop). Directional option trades use the same formula, then divided by 100, rounded down to the nearest whole number, with a minimum of one (1).
The “Master Trader Blended Method” for shorting options/spreads size starts with the stock position size, multiplying by 1.5, then divide by 100 because 1 contract represents 100 shares.
A number of our suggested trades have larger stops because of Friday's expanded volatility. Please calculate position size according using your Max Loss per your Trading Plan.
Here's an example:
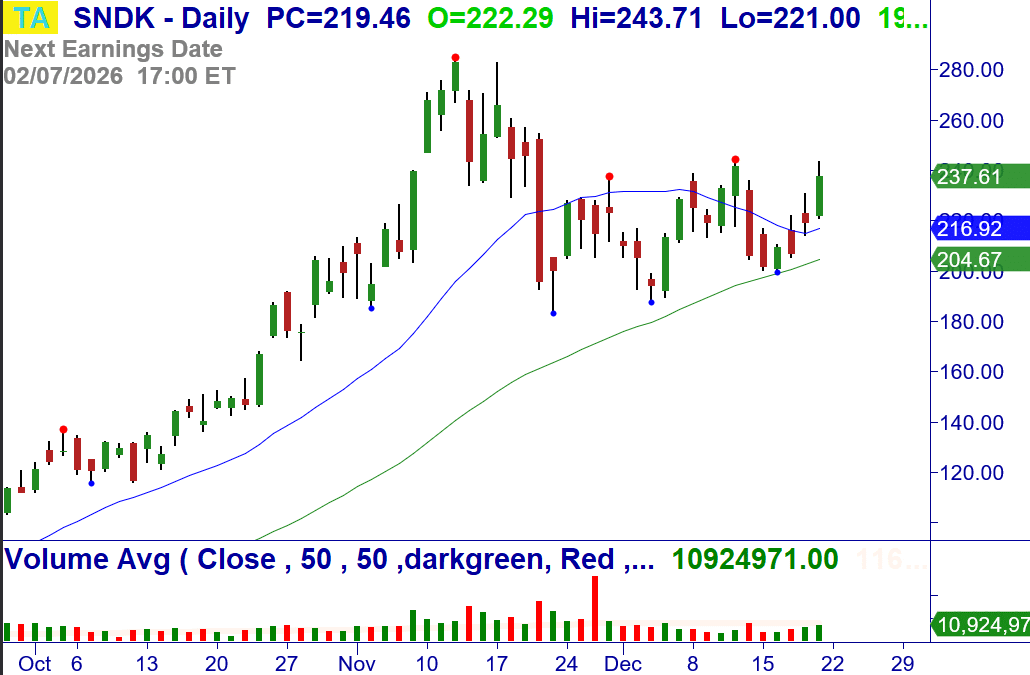
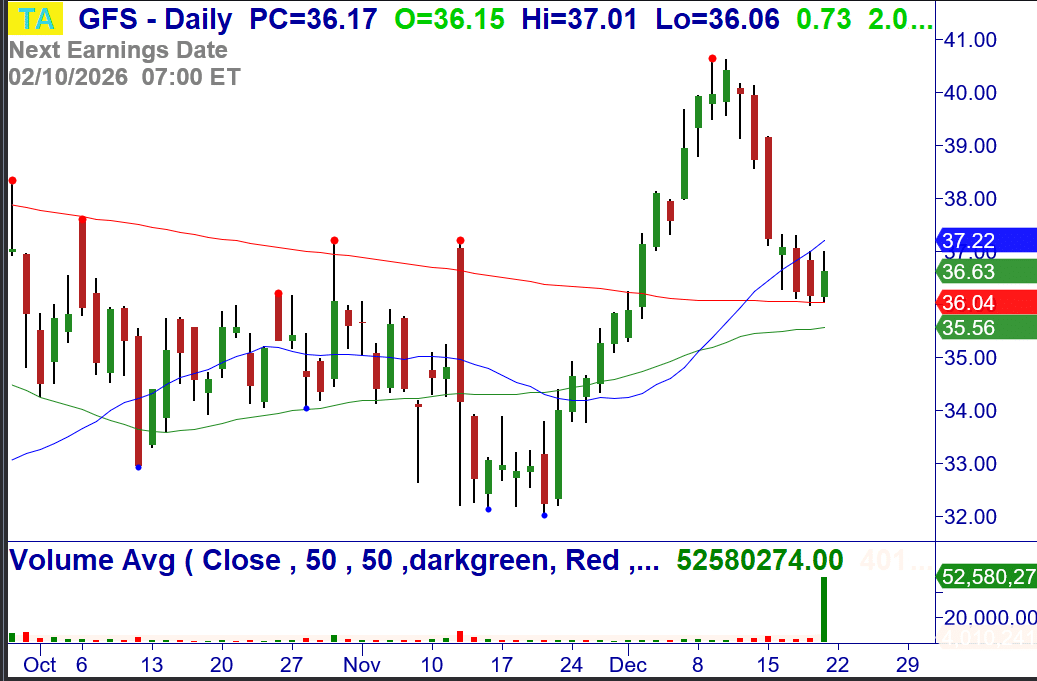
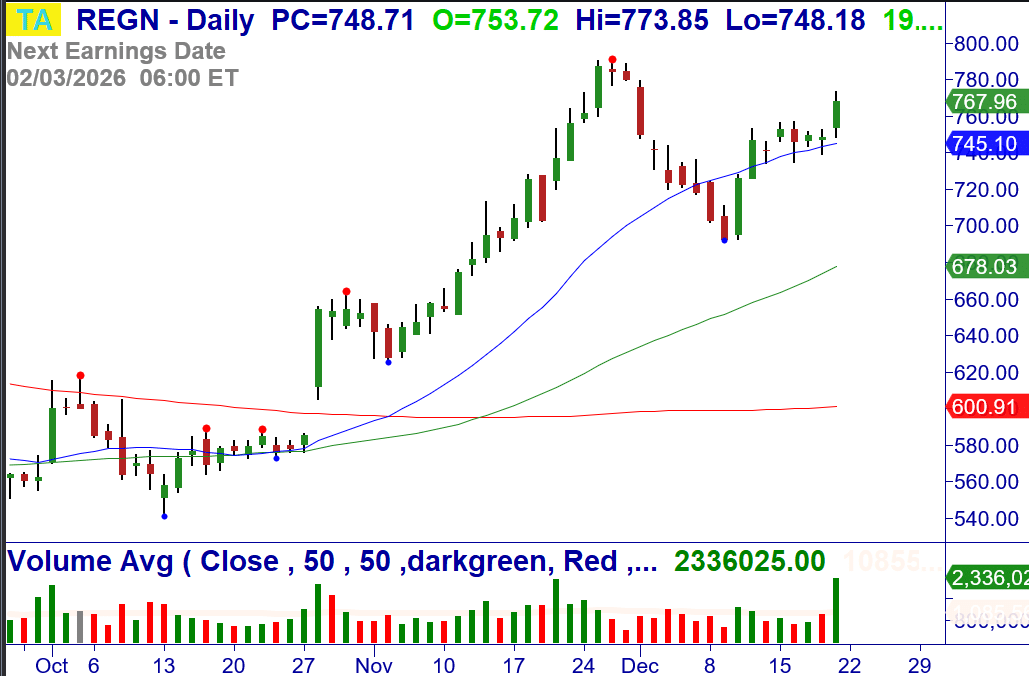
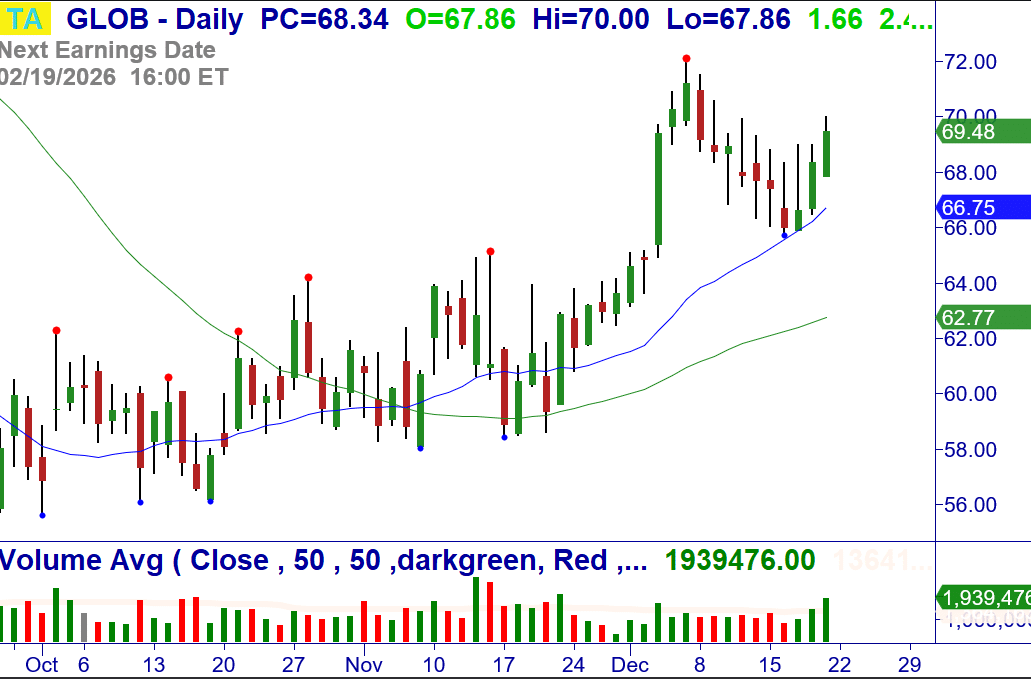
12/22: GLOB (Information Technology) – Over $70.00, consider buying the stock. Why, Breakout of a Bull Flag consolidation at the 20-MA. Stop $66.47.
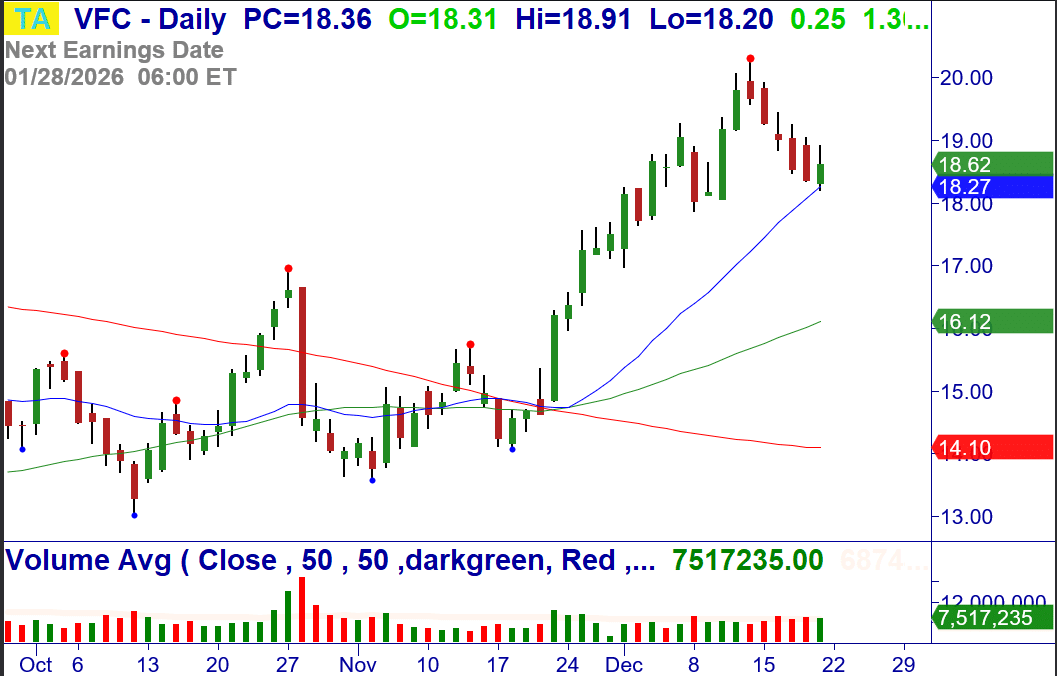
12/22: VFC (Apparel Manufacturing) – Over $19.04, consider buying the stock. why, Buy Setup and reversal at the 20-MA. Stop $18.08.
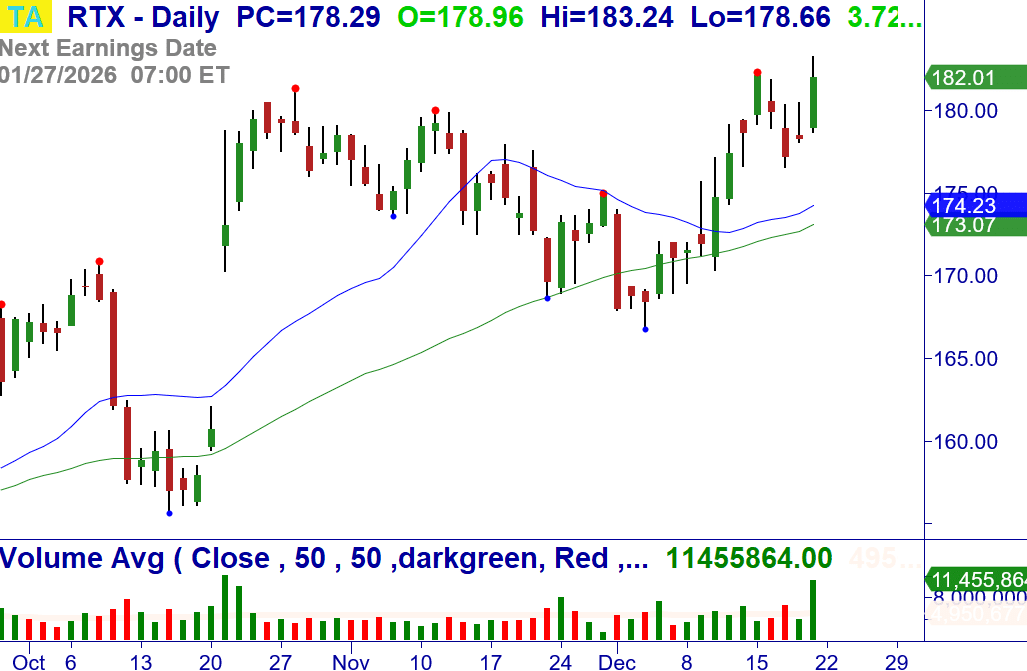
12/22: RTX (Aerospace & Defense – Over $183.24, consider buying the stock. Why, Breakout on +Vol. Stop $178.08.
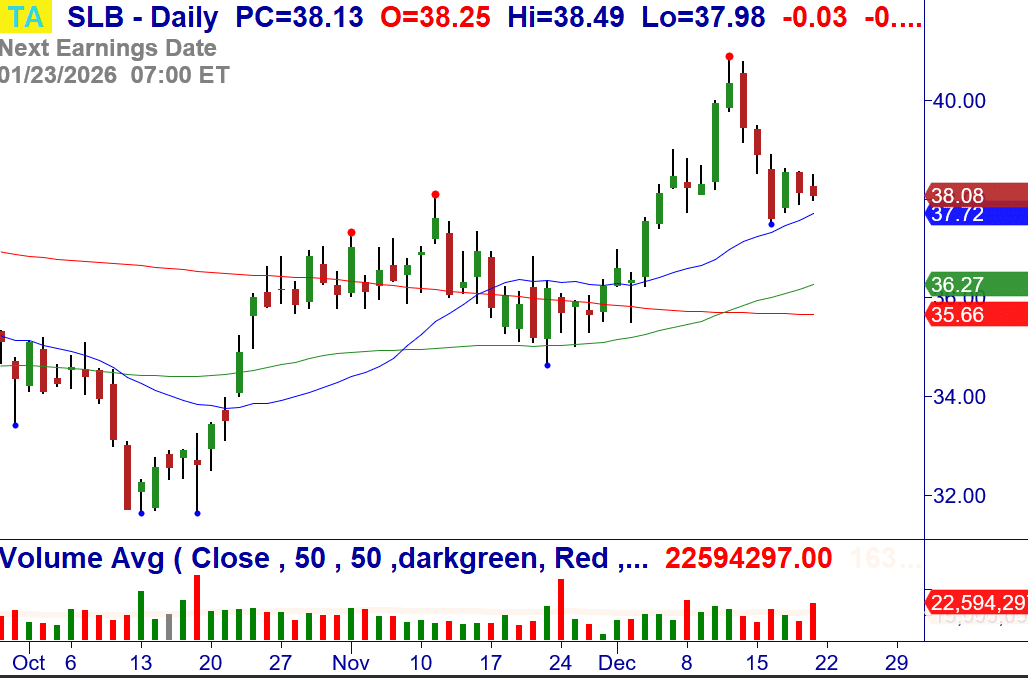
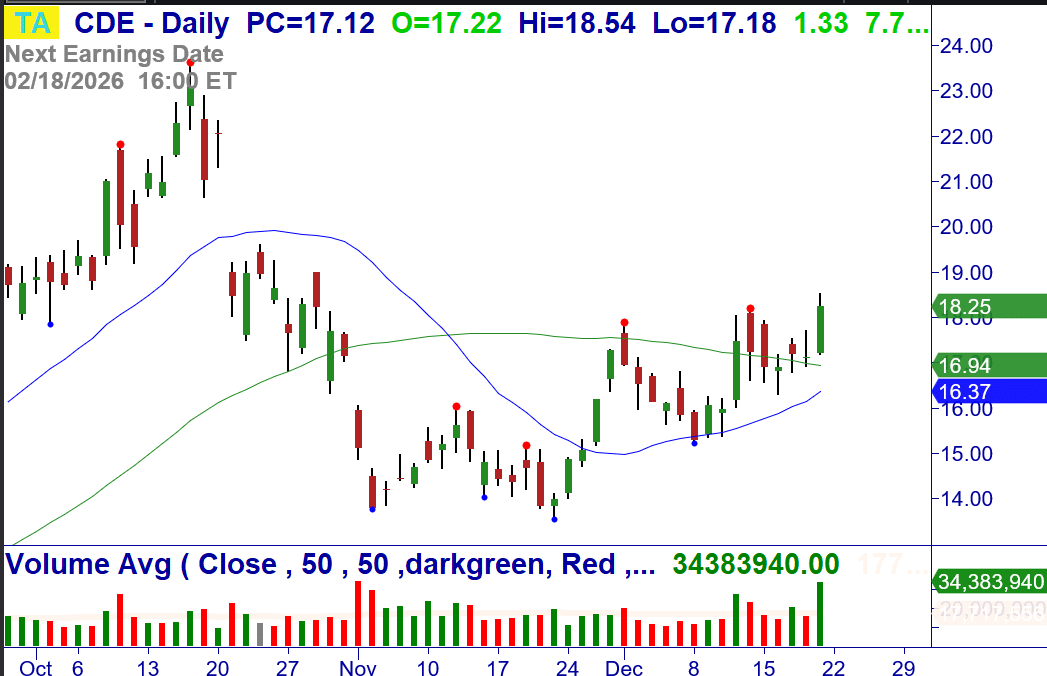
12/22: CDE (GOLD) – Over $18.54, consider buying the stock. Why, +WRB Breakout from a bottoming pattern at the 50-MA on +Vol. Stop $17.17.
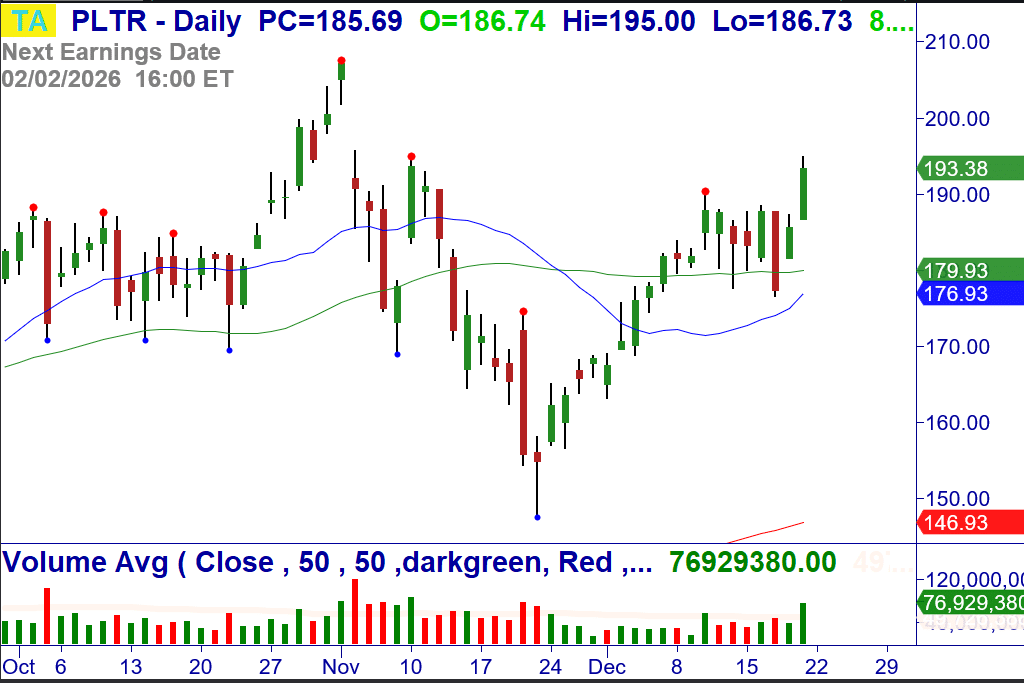
12/22: PLTR (Software - Infrastructure) – Over $193.38 (closing price), consider buying the stock. Why, +WRB Breakout at the 50-MA. Stop $186.68.
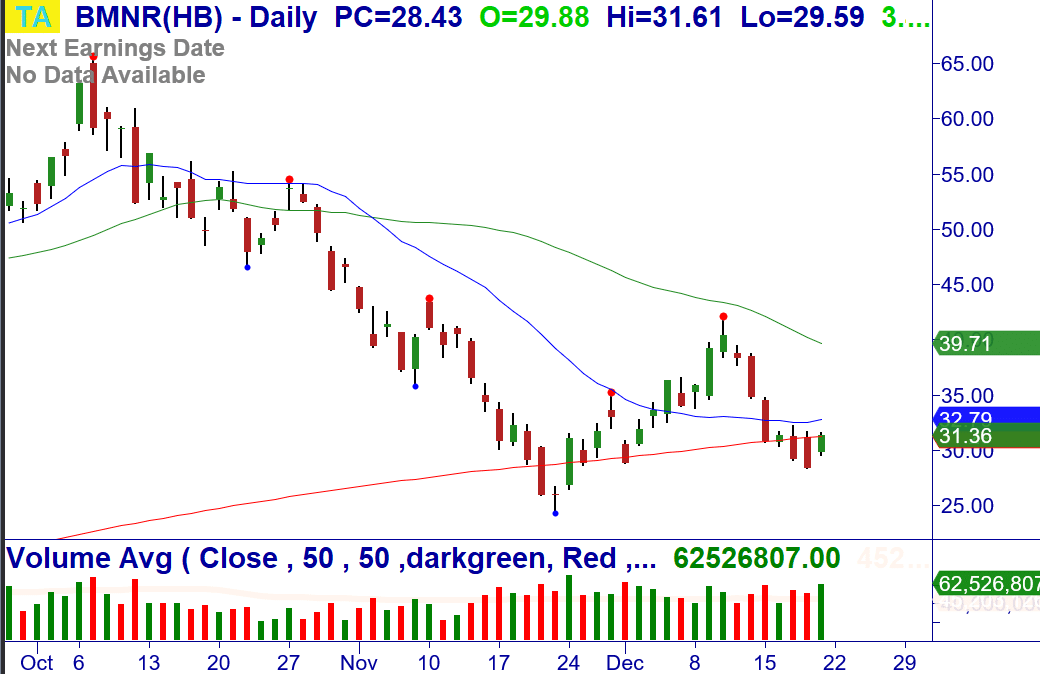
12/22: BMNR (Capital Markets) – Over $32.23, consider buying the stock. Breakout at the 20/200-MA. Stop $27.88.
Money Management for Trading and Investing
Proper money management for investing and Trading starts with position-sizing based on the amount of money you are willing to risk on a signal trade.
CLICK HERE to review these Master Trader Guidelines and Basic Money Management and Position Sizing Table.
NEW OPTIONS TRADING IDEAS
Directional Options Strategies and Debit Spreads for Swing Trading (See the Weekly Options Trader letter, which sells options/spreads for weekly Income that primarily expire in 10 days or less, CLICK HERE)
The Master Trader approach to selling credit spreads around technical turning points.
Read about the Weekly Options Trader letter, which sells options/spreads for weekly Income that primarily expire in 10 days or less, around Master Trader technical turning points, CLICK HERE
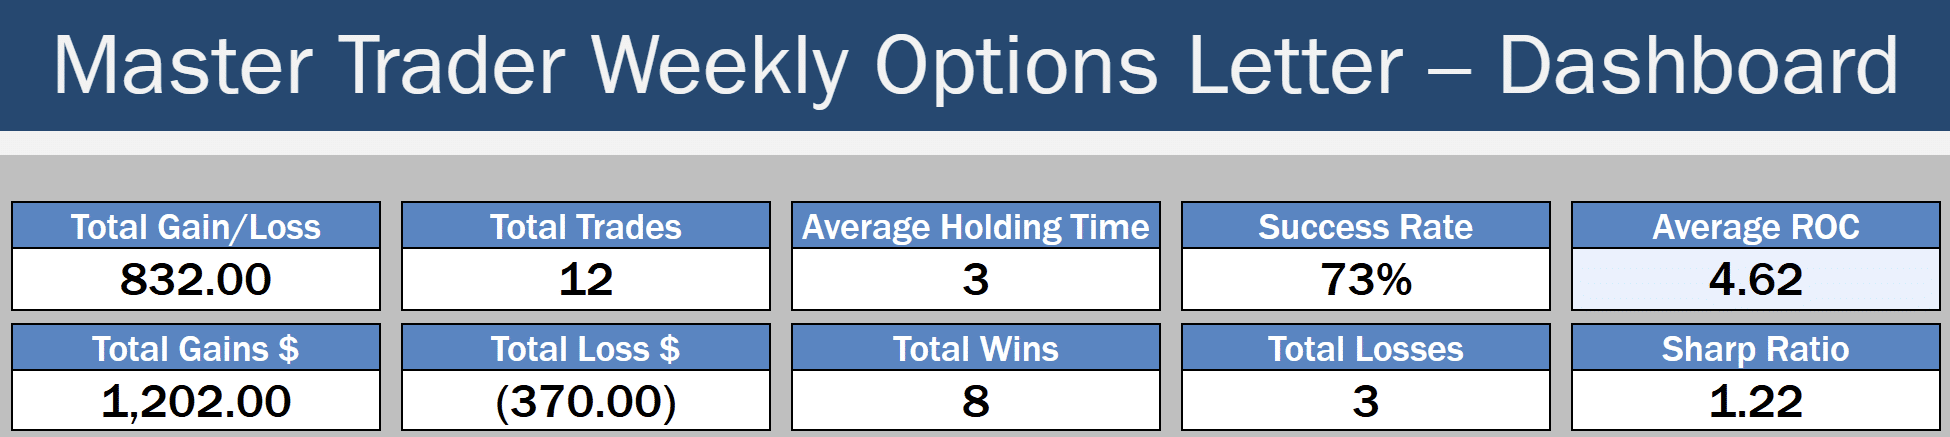
By selling spreads on stocks and ETFs where MTS indicates price is unlikely to go, we become the “smart money,” getting paid to take calculated, well-defined risk.
Check out the blog article with more information and monthly results, CLICK HERE
Professional consistency, short-duration trades, and risk-controlled income — that’s what defines the Master Trader approach.
Master Trader Holiday Sale: Courses, Memberships & More
Special deals for traders and investors of every level — enjoy savings that pay off all year long, CLICK HERE
Because your success is vital to you – and us.
Before selling options or credit spreads, we urge you to review the valuable and detailed information that we have provided for you in your Member’s Area Resources.
A quick simplified approach to calculating contract size is to simply base your contract size based on the number of shares permitted in your Trading Plan as if you were trading the stock or ETF. Simple Share Sizing = $ Risk / Stop Loss
The amount of money that you are willing to risk – divided by – the stop loss amount. For example, $100 / .20 = 500 shares. Credit Spread example, if your Trading Plan allowed you to trade 543 shares of AAPL based on the stop loss, then simply round down to the nearest hundred and short an equivalent number of contracts of the option. Since 1 contract represents 100 shares of the underlying, this would be five (5) contracts.
Master Trader and You Building Your Financial Future Together!
Good trading!
If you have any questions or comments, please e-mail Greg Capra at Greg@mastertrader.com or Dan Gibby at Dan@mastertrader.com
All the best,
Greg Capra Managing Director of Master Trader
Dan Gibby Chief Options Strategist
NOTE: Master Trader will show the opening and closing prices of all stock and options trades. We recommend that all traders and investors use proper share sizing for positions and money management. However, we cannot recommend what that is for your particular trading style, risk tolerance, or account balance. We urge you to calculate your own share/position size based on your individualized risk parameters, Trading Plan, and familiarity with the proposed trade strategy and risk. Advanced Management Strategies (AMS) covers in detail foundation and advanced position and money management.
NOTE: Master Trader and its representatives may have existing positions in actual or other trade recommendations before or after suggested herein. Additionally, we may manage them differently for internal purposes based on different risk parameters than noted herein. All trade ideas and content are for informational and educational purposes only. It is not, nor is it intended to be, trading or investment advice or a recommendation that any security, option, or investment strategy is suitable for any person. Trading securities can involve high risk and the loss of any funds. Significant gaps or volatility can increase these losses, particularly for short option strategies. Investment or trading information provided may not be appropriate for all investors, and is provided without respect to individual financial sophistication, financial situation, investing time horizon or risk tolerance. Supporting documentation for any claims (including claims made on behalf of options programs), comparison, statistics, or other technical data, if applicable, will be supplied upon request. Master Trader Consulting, Inc. is not a licensed financial advisor, registered investment advisor, or a registered broker-dealer. Options, futures, and futures options are not suitable for all investors.