This week’s chart of Palantir Technologies (PLTR) below serves as a perfect reminder that candlestick size alone is never enough to determine a bullish opportunity. When viewed through the full lens of Master Trader Technical Strategies (MTS), the message becomes much clearer — and far more cautionary.
1. The Angle of Retracement Tells the Story
After the strong rally off the October low, prices collapsed back toward that same low at a very steep angle.
In MTS, this is one of the most reliable signs that:
- sellers were aggressive,
- longs were bailing in fear, and
- The prior bullish momentum has broken.
Steep pullbacks rarely reach the prior high. More often, they stall halfway and roll over.
2. The Big Bullish Reversal Candle
Strong-looking… but weak in a complete MTS context
Yes, the reversal candle is wide and closes well — but that’s only one concept.
When it forms after a panicked selloff, back into a major support retest, its meaning is limited.
The strongest reversal candles form after controlled pullbacks, not aggressive dumps.
This is where inexperienced traders get trapped.
However, experienced Options Credit Spread Traders would consider the setup as a Put Spread.
3. The Psychological and Historical Pattern
Deep retracements carry a high probability that:
- Early strength gets sold into,
- Overhead supply becomes a problem, and
- The bounce stalls well below the prior high.
The next wave of sellers often emerges more aggressively as longs try to escape near breakeven.
This is why MTS always asks:
What’s above, and what’s below?
Palantir Technologies - PLTR
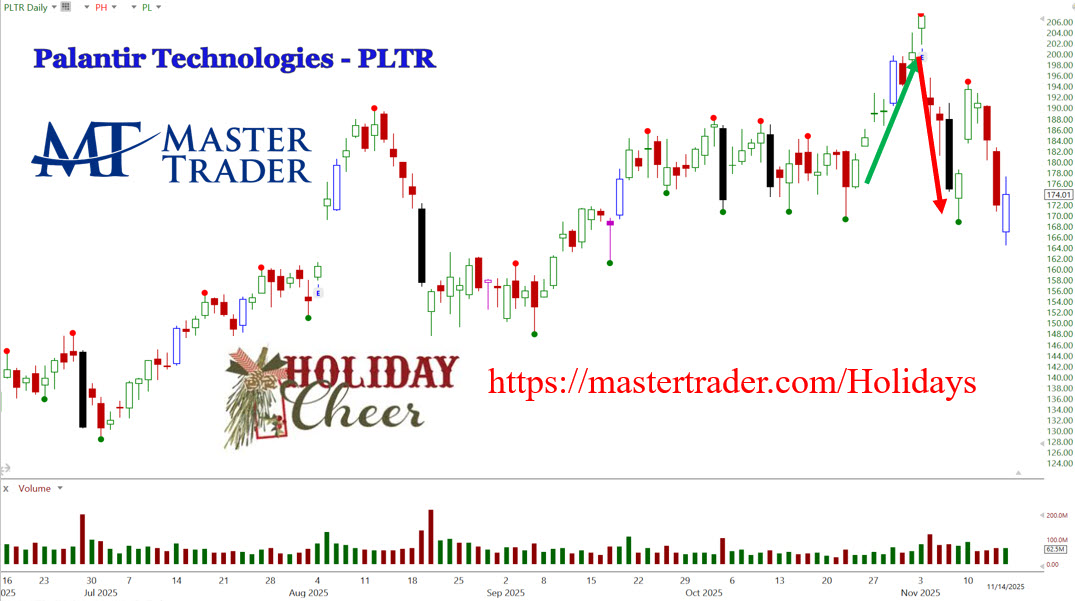
4. The Most Bearish Scenario Is Already in Play
If a large reversal candle cannot push meaningfully above its own high — or falls back below it quickly — the pattern often results in a failure of support.
When that happens, and the left side has a void, prices can move sharply lower with little friction.
That is the setup that may be developing here.
5. The Upside-Down Shakeout (An MTS Classic)
Look at the sequence:
- Rally
- Deep drop back to support
- Bounce
- Another drop toward support
This creates the upside-down shakeout, which is bearish.
Multiple retests of support show that buyers are losing conviction and sellers are gaining control.
Repeated tests = weakening support.
6. Key MTS Takeaway
A large reversal candle doesn’t change the trend, the momentum, or the psychology behind the move.
One candle is not a signal.
MTS evaluates the entire sequence: trend, angle, momentum, support, voids, and trader behavior.
When you combine all of those elements on this chart, the weight of evidence leans bearish, not bullish.
Master Trader Tip
Never trade a candle in isolation — even a big bullish one.
The candlestick is the message.
MTS provides the translation.
Check Here or MT End of Year Specials!