
At Master Trader, our unique approach — what we call Techno-Fundamentals — combines technical analysis, intermarket analysis, and market internals. This powerful blend gives traders and investors the confidence to evaluate markets objectively and take action with clarity.
In this week’s Chart of the Week, we’ll show you how two internal gauges — sentiment and breadth — can provide powerful signals when markets reach major turning points.
What Are Market Internals?
Market internals measure what’s happening beneath the surface of the major indexes. While price tells us “what,” internals help answer the “why” and “how strong.”
- Sentiment shows what traders and investors believe about the market (bullish or bearish).
- Breadth shows how many stocks are actually participating in a market move.
Most traders and investors look at these separately, but after decades of research, I’ve found that the real edge comes when sentiment and breadth are combined at extremes.
Why Most Sentiment and Breadth Indicators Don’t Work
There are dozens of ways to measure internals, but many fail in real-world use:
Breadth indicators like the advance-decline line or Summation Index often lag so severely they are nearly useless for timing.
Sentiment surveys such as the AAII Investor Sentiment Survey (individual investors) and Investors' Intelligence (newsletter writers/advisors) are informative but not timely enough to generate trades.
After years of testing, I concluded that:
Many gauges overlap and add little value.
Breadth or sentiment alone can mislead.
The winning formula is combining the two and focusing on historical extremes.
The Best Sentiment and Breadth Gauges
At Master Trader, here are the gauges we use every week:
1. The Put/Call Ratio (Sentiment)
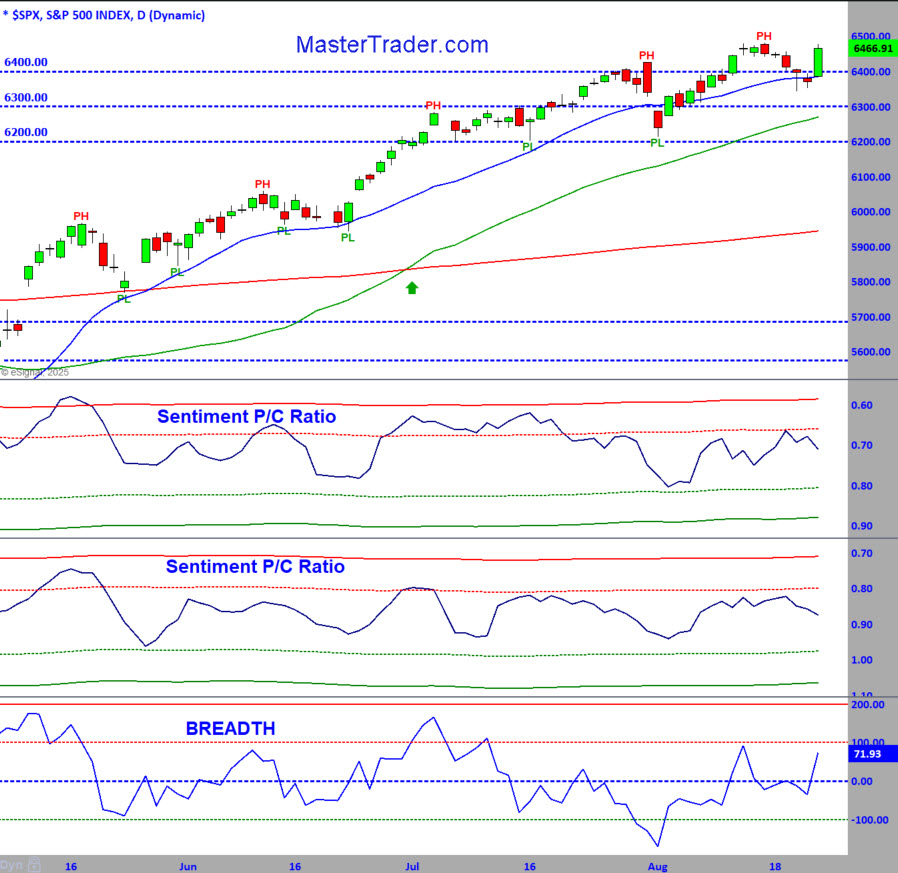
Options markets magnify the fear and greed of human nature. At major tops, options traders tend to load up on calls (bullish bets). At major bottoms, they pile into puts (bearish bets). This makes the Put/Call Ratio the most timely and reliable sentiment gauge.
2. The McClellan Oscillator (Breadth)
This classic indicator looks at the number of advancing stocks minus declining stocks, then compares short- and long-term moving averages. When the spread between them hits extremes, it reflects when markets are stretched too far.
On their own, each can give false signals. Together — at extremes — they’ve proven to be one of the most powerful timing tools in the markets.
What Market Internals Are Saying Right Now
Currently, our sentiment and breadth gauges are not yet at an extreme, which means no new high-probability signal this week.
However, based on recent price action, I expect one in the very near future. Historically, when these indicators align, they mark some of the best swing trading and options opportunities available.
How Subscribers Use This Every Week
Subscribers to the Master Trader Advisory Swing and Options Trader Letter get:
Weekly internal market analysis – Sentiment, breadth, and how they align with the overall market trend.
Detailed sector and index reviews – See where money is flowing across the markets.
Swing and options trade ideas – Actionable, high-probability setups for the coming week.
Intraday text alerts – For managing open trades or seizing new opportunities in real time.
Nightly videos – Updates on trade management, education, and new trading setups.
This isn’t just analysis. It’s a complete trading plan that combines education and actionable trades, helping you become a confident, self-reliant trader.
Ready to Trade with Confidence?
At Master Trader, we’ve helped traders and investors for decades by combining technical analysis, intermarket analysis, and market internals into one cohesive system — Techno-Fundamentals.
The next sentiment + breadth extreme could mark a major turning point. When it does, you’ll want to be prepared.
Subscribe today to the Master Trader Advisory Swing and Options Trader Letter and gain the insights, tools, and trade ideas professionals rely on to stay ahead of the markets.
Why choose Master Trader for your Financial Future?
