Stacked Moving Averages: A Simple Guide to Gauging Trend Strength
When traders look for ways to identify a strong trend, one of the simplest and most visual tools is the concept of stacked moving averages. This occurs when the shorter-term moving average is above the intermediate-term, which is above the long-term (for uptrends), or in reverse order for downtrends.
In other words:
Shorter above longer = bullish strength
Shorter below longer = bearish strength
This alignment means that buyers (or sellers, in a downtrend) have been in control across multiple time frames. The cleaner and more widely separated these moving averages are, the more consistent the trend has been, and the more confidence traders can have in the market’s direction.
Why Master Traders Use the Stack
- Visual Clarity: At a glance, you can see if the market, stock, or ETF is in a bullish, bearish, or messy phase.
- Trend Confirmation: When the moving averages are stacked, it supports the idea that the trend has underlying strength.
- Bias Creation: The stack offers a directional bias — in a bullish stack, you’ll lean toward long trades; in a bearish stack, short trades.
It’s a Starting Point — Not the Full Picture
While stacked moving averages can confirm that a trend is strong, they don’t tell you when to enter. A common mistake is buying (or shorting) simply because the stack is in place. Trends can become extended, meaning price is stretched far away from the short-term moving average and is due for a pullback.
Entering at this stage can put you at risk of buying the high or selling the low.
Think of it this way — the stack gives you the direction, but it doesn’t tell you where the road bends. That’s where pattern recognition and market structure analysis come in.
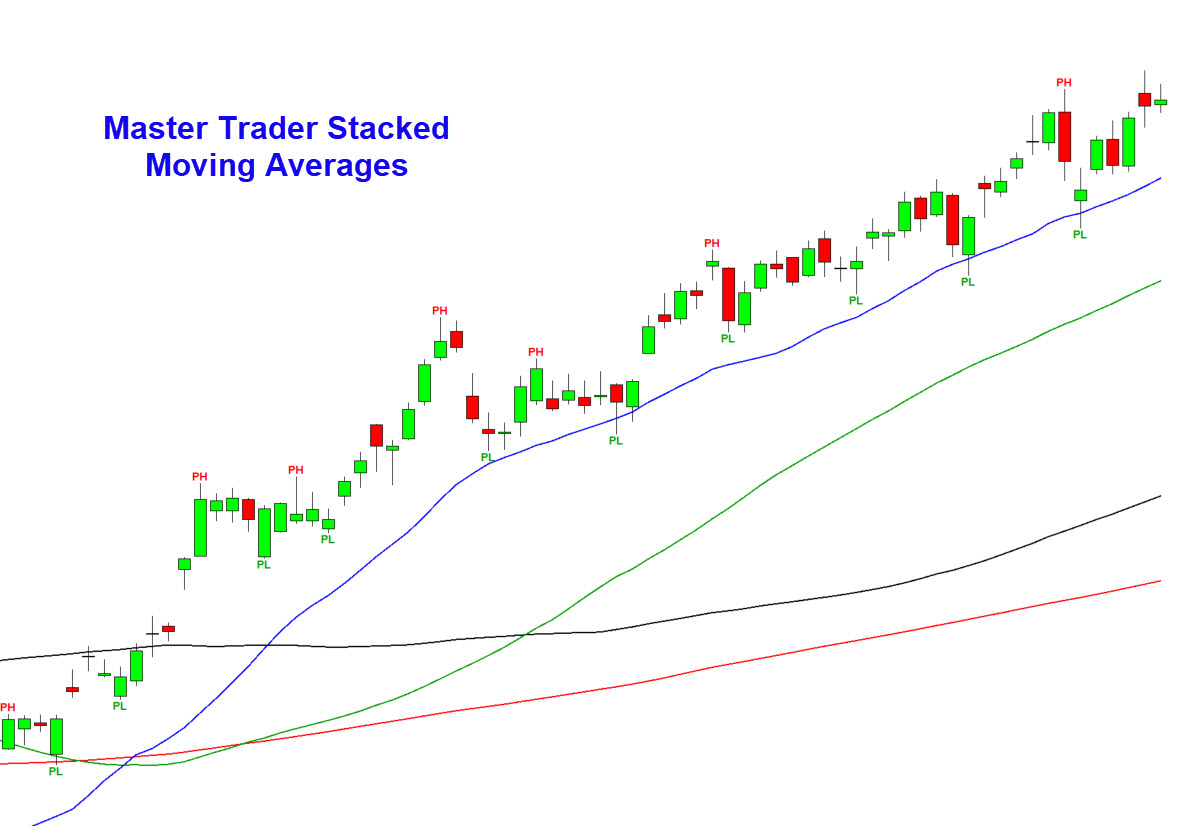
The Power of MTS Price Patterns
To make the stack actionable, combine it with price pattern analysis. This approach helps you spot:
- Pullbacks to logical support or resistance where the trend is likely to resume.
- Breakouts from consolidations within the stacked structure.
- Voids, or areas on the chart with little opposing price structure, where moves can travel quickly.
- Reversal Warnings when a stack remains intact, but price starts failing at key reference points.
When the stacked moving averages give you a bias and the price pattern provides a specific, high-probability entry point, you’re trading with structure and purpose rather than emotion.
Mastering the Stack for Real Trades
At Master Trader, we teach traders how to use tools like stacked moving averages as part of a complete market analysis, not as a stand-alone decision trigger. Our Swing Trading Course goes in-depth on:
- Reading and interpreting trend quality.
- Identifying when trends are likely to continue or reverse.
- Spotting voids and other chart structures that set up fast, high-odds moves.
- Pinpointing precise entry points with excellent reward-to-risk ratios.
- Trader Psychology and How to Keep a Trading Journal.
- Position and Money Management, and much more.
When you understand not only that a market is trending, but also how to enter it with timing and structure, you set yourself apart from the majority who chase late and exit in frustration.
Stacked moving averages are a powerful visual guide to trend strength, but they’re just the compass. The map — price patterns, voids, and trend analysis — is what takes you to consistent trading success.
The Master Trader Swing Trading Course shows you exactly how to put these elements together so you can trade with confidence, precision, and consistency — instead of chasing every move and hoping for the best.
Why choose Master Trader for your Financial Future?