In this Educational Chart of the Week, Market Options Expiry Part 2
The chart below displays the S&P 500 ETF symbol SPY, with the monthly and quarterly options expirations marked with a vertical line. We reviewed this chart and bias last week.
It’s a chart I shared with our Advisory Swing and Options Trader letter a couple of weeks ago as part of our market and sector analysis with market internals.
Many turns occurred within days of the expiry, and this Thursday is a monthly expiration. The Advisory letter will take advantage of this to profit in the coming weeks.
Our Bias Was,
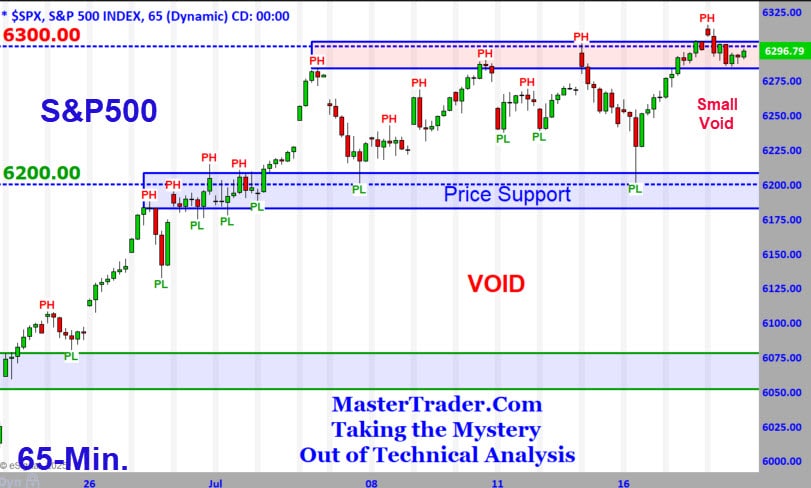
The largest open interest strike in S&P 500 puts (bearish bets) expiring this week is 6200, and it is also a price support area, so it is likely to hold near that level.
If the markets are to advance, the largest open interest call strike in the S&P 500 is 6300, and since that is a whole number, it should stall near that area.
Unless a significant break and close occurs, odds are the S&P will be contained close to the recent trading range. And I would not rule out failed attempts.
What Happened and in a Directionless Market, Trading Credit Spreads Works - SEE BELOW!

Here is the intraday 65-minute Dow Futures chart used for biasing lower time entries.
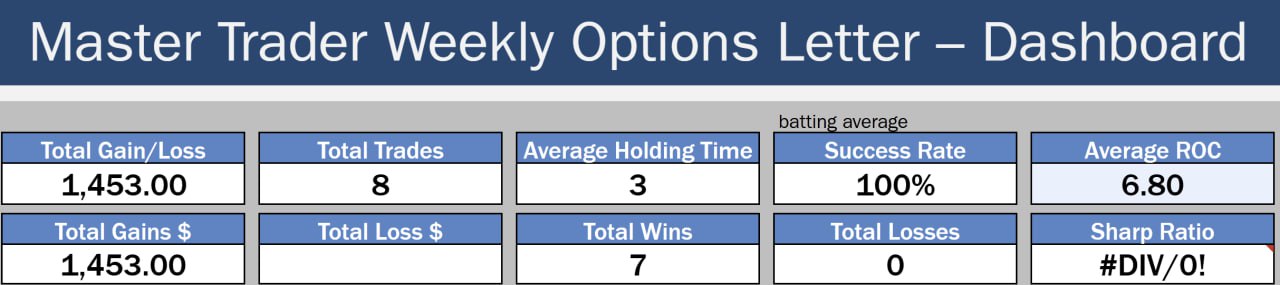
The Weekly Options Trader Letter Results for the Week of 7/14/25 - If you took last week's trades, risking $300 per trade, the profits could have paid for 2.5 Years of a Monthly Subscriptions!
Here is the intraday 65-minute Dow Futures chart used for biasing lower time entries.
The July 18 options expiration contributed to the S&P 500’s containment within 6200–6300, as mentioned last week, pinning the index near key strike prices.
The chart of the S&P 500 shown on a 65-minute timeframe displays last week’s reactions between the strikes mentioned. The grey lines are pre-market.
There are outside factors that influence the markets. Still, as technical traders, we need to identify the significant support and resistance levels where buyers and sellers are likely to enter or exit positions.
Strong earnings help push the S&P 500 toward 6,300, where it was rejected. Traders without an understanding of the effects of options expiration and the basics of support and resistance could be confused by that price action.
Last week’s strong retail sales and drop in jobless claims helped increase confidence in the economy, pushing the S&P 500 to 6,300, and then rejecting it.
Trade and tariff concerns continue to have less adverse effects than they have in the past. Still, again, President Trump's intraday comment about removing Fed Chair Powell sent the markets sharply lower to 6,200, where buyers waited. - Our Options Expiration Analysis and Bias in Effect!
The “Potent” turn at 6,200 and rally to the top of the range (6,300) signals the underlying bullish sentiment to buy the dip by institutions.
The robust rally from the bottom of the range to the top of the range created a small void but signaled strength and the potential to continue higher.
At this link, you can get the Advisory Swing and Options Trader for two months for the price of one, plus two free MTS Courses. Plus live monthly coaching sessions, which are recorded for review!
Why choose Master Trade for your Financial Future?
Master Trader and You Building Your Financial Future Together!
Happy trading! If you have any questions or comments, please e-mail Greg Capra at Greg@mastertrader.com or Dan Gibby at Dan@mastertrader.com