

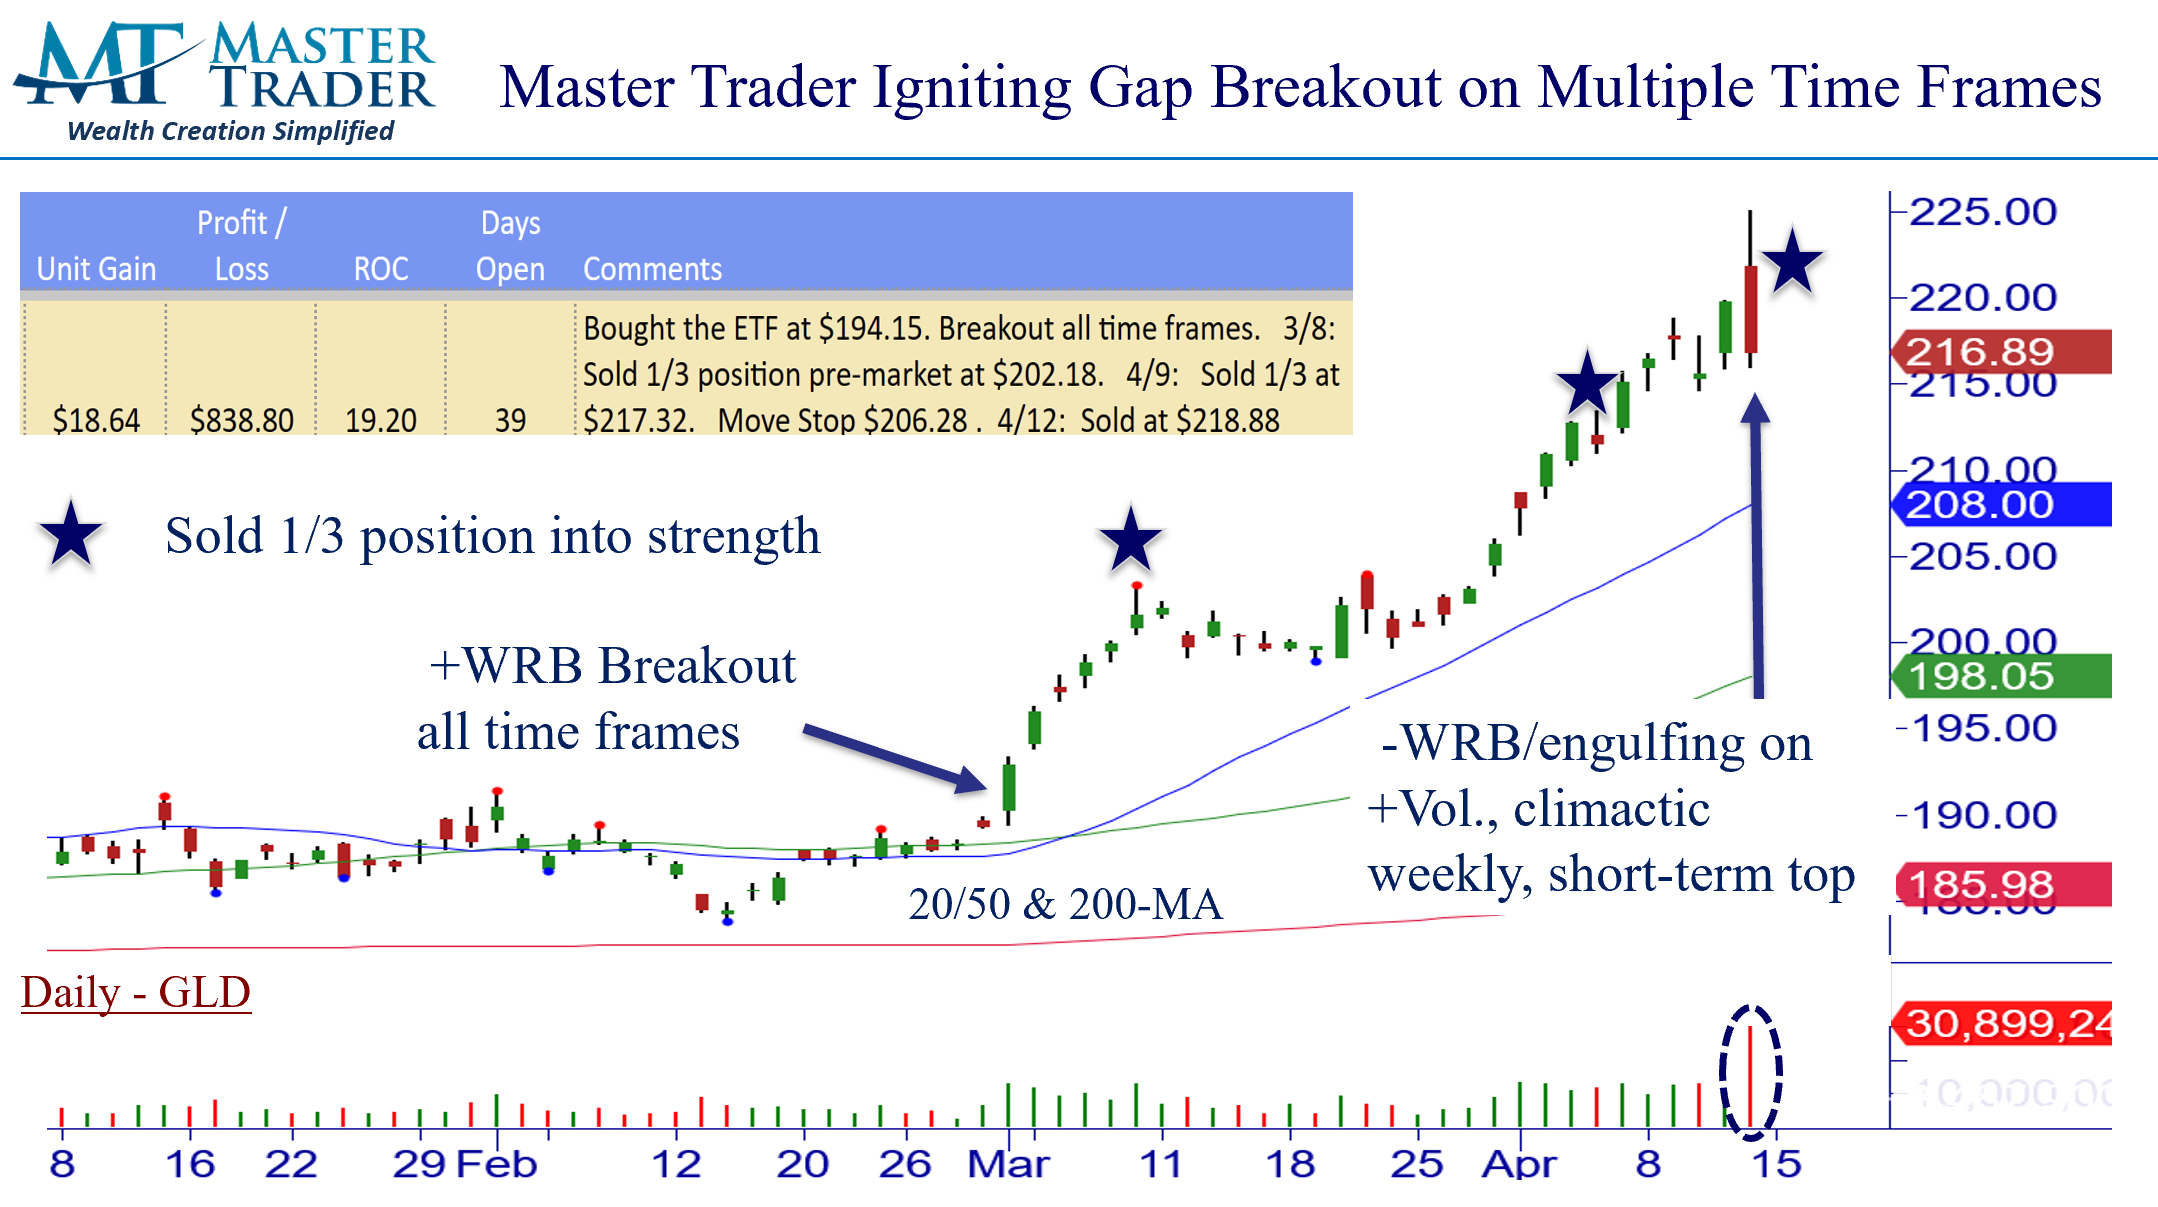
GLD: Many traders are paralyzed to buy Breakouts out of fear that they will fail. Master Trader teaches how to detect the “tells” to ensure that initial Breakouts are high-probability Setups. We also teach how to pullbacks and reversals on Support after breakouts. GLD, however, was a beautiful no-brainer initial Breakout on multiple time frames (MTF), which we recommended to subscribers of our Master Trader ETF Investment Trader, which buys and shorts ETFs with intended longer holding times. After breaking down last October (not shown), GLD broke out and was consolidating in a bullish trading range from December through February. Notice the flat 20/50/200-MAs visually confirming this bullish trading range. GLD a had a beautiful closing breakout where shown, signaling the time to enter bullish stock and option trades. It was also a Breakout on the weekly and monthly charts as it marched to all-time highs. As shown, we sold three times into strength, booking an amazing gain and return in a 39-day easy-to-manage swing trade.

YMM: YMM broke down in March and they quickly recovered, which is bullish. It was a large trading range (notice the flat 20/50/200-MAs visually confirming this bullish trading range) which became support after the closing Breakout. The first marked blue star was a sloppy Buy Setup (pullback and reversal on support in an uptrend). The fact that it went sideways for two more weeks with bullish price action and building more support above the 20-MA made the Breakout more confident. We recommended buying YMM over the closing Breakout candlestick. It showed great relative strength as the broader markets were having a bearish retracement, delivering a quick and easy 5-day easy-to-manage swing trade.
I think you are amazing to manage the sheer volume of trades you put out on both the weekly and the swing services. Unreal! You are one of the best I've see, and I've seen a lot. Thanks on behalf of all!
Mick T.
I learned a lot going through the MTS course; so far I reviewed it three times and each time, I discovered wealth of new insights. I am also a member of the Advisory Letter and the Weekly Options: where else can you find a batting average higher than 85%. Greg and Dan are not only Master Trader but also Master Teachers; I don’t miss the Wednesday lessons (MT Live) where you learn how to find that something something to boast your returns. I am addicted.
Ibrahim A.
You guys are the only two traders that teach candlesticks and relate them directly to trade setups. I have learned so much and it has actually turned me into a profitable NQ trader which is where I cut my teeth. Could not consistently achieve “green” days until I found MasterTrader. Now I am learning stocks, and options and swing trading. It is all starting to make sense. Before, it was a jumbled mess. I would highly recommend MT because you 2 are traders, teachers, and mentors. This does not exist in the “learn to trade” world. I find your pre-market and live market trading second to none. Also, you give pre-made scans to students for TC 2000 which is invaluable! Really - it is priceless! For me, you guys have all the bases covered short of you sitting with me at my computer teaching me what to do....but you guys already do that too--- daily!