

Some of last week's comments included,
"What occurred last week may have set the stage for prices to accelerate higher, which will lead to the following corrective price action.
It's normal for prices to correct when they become extended because of moving too far too fast.
Also of concern and interest was the breakout to new highs in Gold."
More...
Last Monday, markets started moving higher, as the previous week's close suggested. It was a slow trading day as prices stayed in a narrow range for most of the day. Just after 2:30 ET, prices broke out of the range.
It was a solid-looking breakout on the five- and 15-minute time frames that formed bullish wide-range bars (+WRBs) suggesting higher prices.
At about 3:30, prices began to inch lower, and then the selling picked up, which negated the breakout in the day close with a narrow range-topping tail.
Sellers taking control so abruptly was odd, but the daily timeframe was still solidly bullish, suggesting higher prices in that timeframe.
Maybe it was because Apple did not recover after negative news about its phone sales, but in hindsight, something negative created uncertainty.
On Tuesday, the broader markets gapped lower, and many tech stocks fell between 3 and 5%. Apple fell 5% last week and is likely to go lower.
The NASDAQ 100 broke below the prior Pivot Low, also Major Support.
Deep retracements like the one that occurred in the NASDAQ 100 often precede a move lower, but that isn't a certainty -- it's a warning.
It was unlikely that the markets would make a significant move ahead of the testimony from the Fed Chairman on Wednesday.
On Wednesday, prices traded in a tight range and the Chairman's comments seem to have little effect. After all, he wasn't saying anything we hadn't heard.
On Thursday, markets shrugged off the negative price action that occurred earlier in the week, and prices increased. The S&P 500 made another all-time high.
All right, the coast was clear for the broader markets to move higher --and they did so from the open on Friday.
The NASDAQ joined the S&P 500 to new all-time highs. The advance stalled at the 10:30 ET reversal time. The daily and intraday price patterns suggested buyers would be willing to step in on a pullback and move prices higher.
And our previous week's idea of an accelerated move higher appeared ready.
There was no technical pattern or Intermarket analysis reason (for example, a move higher in interest rates) for the markets to fall. After 10:30, they did all day.
In my premarket commentary Friday, I pointed out the risk of the extended semiconductor index and the move in Gold (GLD), but they did not negatively affect early trading. Traders even brushed off the bearish gap in MRVL.
S&P Sector ETFs – Daily Charts

There weren't any trend changes last week.
The sectors that have been the strongest became the weakest last week.
Those trends continue to be up, but we must wonder whether the bearish reversal bars formed on Friday are a precursor to a correction.
During the advance that started at the end of 2023, other bearish reversal bars were ignored, but eventually, we know one will not be.
The bearish reversals occurred in the S&P 500, and the Industrials occurred after making new highs.
The bearish reversal bar formed in the Technology sector increased above the all-time high before turning sharply lower.
The Communication ETF was rejected from its new high and formed a topping tail (TT), but it is still in a trading range. As long as it doesn't violate the bottom of the range, we will give the uptrend the benefit of the doubt for now. META continues to hold.
The Energy ETF is "grinding higher" even though Crude Oil has failed to move higher in its attempts. The grinding higher behavior pattern suggests institutions anticipate higher prices, but oil prices create uncertainty.
The Financial sector continues its steady advance. Unless it breaks down, it will support the S&P 500.
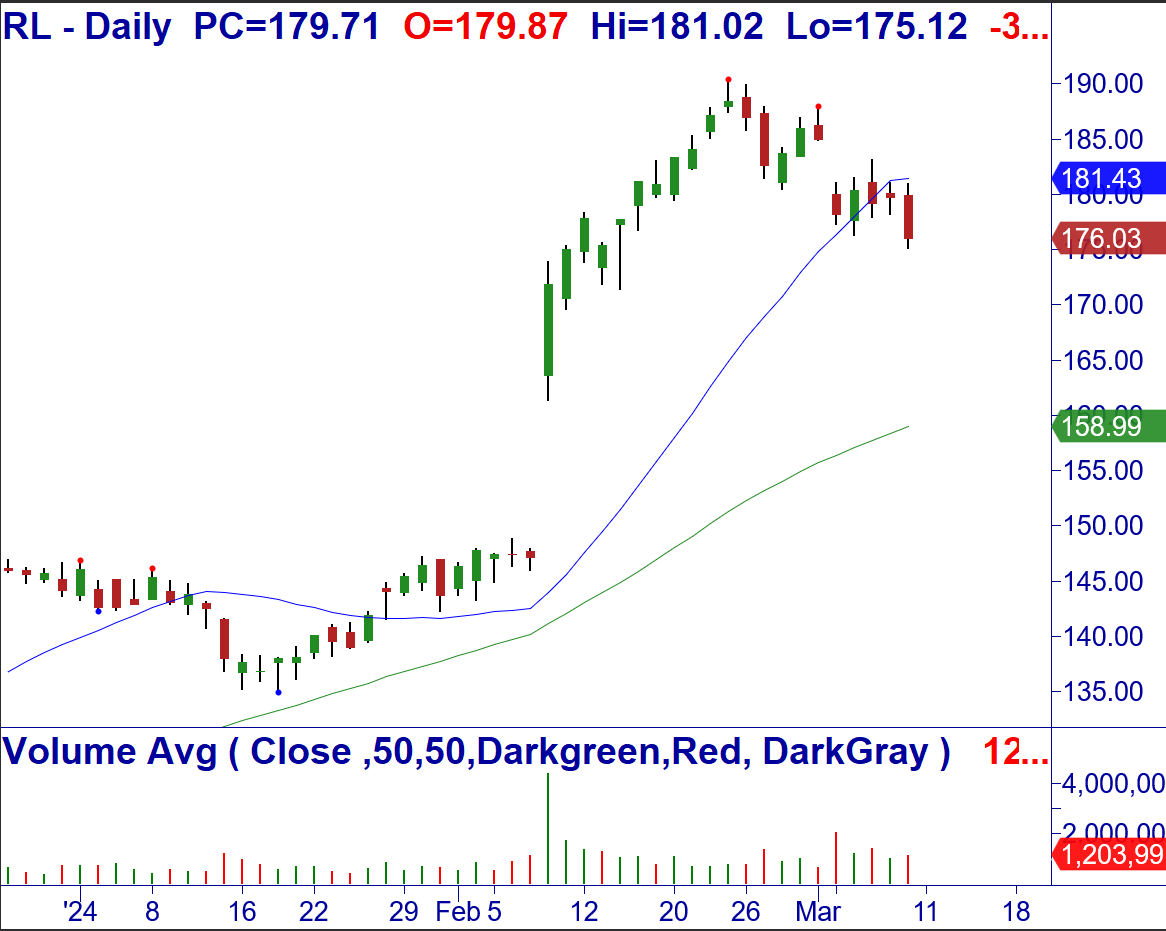
The Consumer Discretionary ETF broke down last week, with Tesla continuing to move lower. Ralph Lauren (RL) also added to weakness and has room to fall.
The Consumer Staples continued its erratic uptrend as money rotates into some of the defense of stocks like Clorox (CLX) and Kroger (KR). Procter & Gamble (PG) formed a bullish Reversal bar Friday and should move higher once above.
Healthcare formed a higher Pivot Low (PL), retested the low, and moved higher at the end of last week. That PL is new support that should not be violated.
The Real Estate ETF and the Utilities ETF benefitted from the recent lower intermediate-term interest rates. The sectors should stay relatively strong as long as the intermarket relationship is maintained.
S&P Sector ETFs – Weekly Charts

There weren't any weekly trend changes last week.
The S&P 500 weekly candle closed with the open and closing prices almost the same, with tails on both sides: candles that signal stalling momentum. A close below last week's low would signal a short-term correction but would not change the current uptrend.
The Industrials also had a narrow candle body signaling a slowing momentum.
The Technology ETF broke out above a month-long consolidation, and three weeks ago, there was a breakdown reversal continuation signal. If the sector can stay above the $200 level on a closing basis, maintain a bullish bias, closing below that level will likely pull the broader markets lower with it.
Semiconductors pulled the sector down, and the bearish reversal was powerful. Nvidia (NVDA), the leader, fell 100 points from its high and lost 8% on Friday.
The Energy sector is broadly trading and may reach the top. Marathon Petroleum (MPC) and Valero Energy (VLO) are leaders and should continue higher. Exxon Mobile (XOM) broke above its trading range and moving averages last week and has room to move higher.
Financials' momentum also slowed and will have a short-term correction if it breaks below last week's low.
The Materials ETF is nearing the top of the extended trading range we pointed out a few weeks ago; $92 is the top of the range.
The Consumer Discretionary ETF closed below the previous week's low but is still an uptrend. We'll see if there's a follow-through to last week's weakness or whether it will be a Red Bar ignored (RBI).
Consumer Staples has been a steady grind higher. Last week, it formed a minor topping tail (TT) as it neared the resistance area from last year. A close below $74 would be bearish.
Healthcare has three weeks with equal Lows. A close below that is bearish.
The move up in Real Estate ETF should exceed the prior Pivot High (PH), and a move near $72 is possible if interest rates continue lowering.
The Utilities formed a bullish wide-range bar last week, but the next PHs are close, so this bullish bar will not interest us for a long trade.
S&P Sector ETFs – Sorted by Yearly Percent Change This Week

The percent changes tell you which sectors were the strongest or weakest on Friday and for the week, month, quarter, and year.
There are seven columns after the percent changes in the sector list above.
You can see the ETFs that are the strongest getting stronger or weakening.
- Close above or below the 20-MA.
- Close above or below the 20-MA 5 Days Ago. C>20 -5
- Close above or below the 50-MA.
- Close above or below the 50-MA 5 Days Ago. C>50 -5
- 20-MA above or below the 50-MA.
- 20-MA is pointed up, and the close is above the 50-MA.
- Close above or below the 200-MA
It has been a while since the Utility sector was the best weekly performer.
Materials was the second-best performer, and while it may get to the top of its trading range, leaders in the sector like Martin Marietta (MLM) and Vulcan Materials (VMC) are extended and reversal lower on Friday. These two stocks would be good candidates for selling Covered Calls.
Selling covered calls is an options strategy to collect income and lower your cost basis on strong stocks you do not want to sell. Use Coupon Code MTSOPX for 30% off these options courses this week.
If the Real Estate ETF has one red dot left and that one that marks whether the 20-MA is above the 50-MA, it should turn green next week when prices increase.
The Communication Services ETF got a new red dot last week because it's been moving sideways for over a month, and the 20-MA turned flat from up.
The Consumer Discretionary ETF moved under its 20-MA and is vulnerable to testing the 50-MA if it trades under last week's low.
Where are the Markets Headed this Week?
The broader markets have been advancing since the 2023 October low and are vulnerable to a short-term correction. Last week may have been the start.
The Semiconductor sector was down almost 5% on Friday and up 27% this year. So, a short-term correction should not be a surprise.
That leading sector weakness is one reason to believe a short-term correction is at hand. However, there was selling in many technology stocks.
Institutions have continued to buy large one-day drops, and we will see if they're willing to do that again early this week.
The internal market gauges are neutral and do not help with guidance.
The sharp move higher in Gold and the strength in Utilities is typically seen when institutions become nervous about world events. And the President's rant about Russia in his State of the Union address is a reason for concern.
A fall in the 10-year yield and the US Dollar did not help the markets advance to the same degree as in the past, which is a measure of relative weakness.
It's essential to have an alert above the current crude oil prices or the ETF for oil symbol USO. A break above last week's high would increase inflation concerns.
On Tuesday is the Core Inflation Rate report, and expectations are for a lower number. Expectations for a cut in the Fed Funds rate in June are growing, so we will continue to be susceptible to the day-to-day swings based on the numbers.
The Russell 2000 ETF (IWM) is slowly increasing, and mildly bullish that some money is moving into speculative stocks.
The Transports have been whipping up and down in the range since the end of last year, and that range has gotten tighter. It will break one way or another soon, and its direction will be a heads-up for broader markets.
The short answer to the long explanation is that the markets have been grinding higher in anticipation of a rate cut (more liquidity).
The significant break in semiconductor and other technology stocks is a short-term concern.
Buyers will continue to buy weakness unless some world event shakes the markets.
DOW JONES

Above is the Dow Jones Industrial Average chart we review for monthly MTS education and information.
The Dow continued to show relative weakness last week and closed under its 20-MA for the second time since the beginning of the advance.
On Friday, prices moved above the prior three days but ended with a topping tail (TT)- a sign of weakness.
If prices break under last week's low, they will likely test Major Support (MS) and the 50-MA.
Since the October low, each time prices made a higher high, there has not been a retest of MS and the 50 MA.
If that happens next week, it will be an indisputable sign of weakness.
VIDEO REVIEW OF MARKETS, SECTORS AND INTERNALS - Click lower right to open Full Screen.
[s3mm type="video" s3bucket="mastertrader2" s3region="us-east-1" files="greg-2024/MarketUpdate_3_11_24.mp4" source="cloudfront" /]
NEW STOCK TRADING IDEAS and Video Update Below
NOTE: Please see the document in RESOURCES entitled Master Trader Guidelines for Trading the Open and Gaps.
3/11: RL – Under $175.12, consider shorting the stock. Breakdown after -Gap. Stop $181.54.
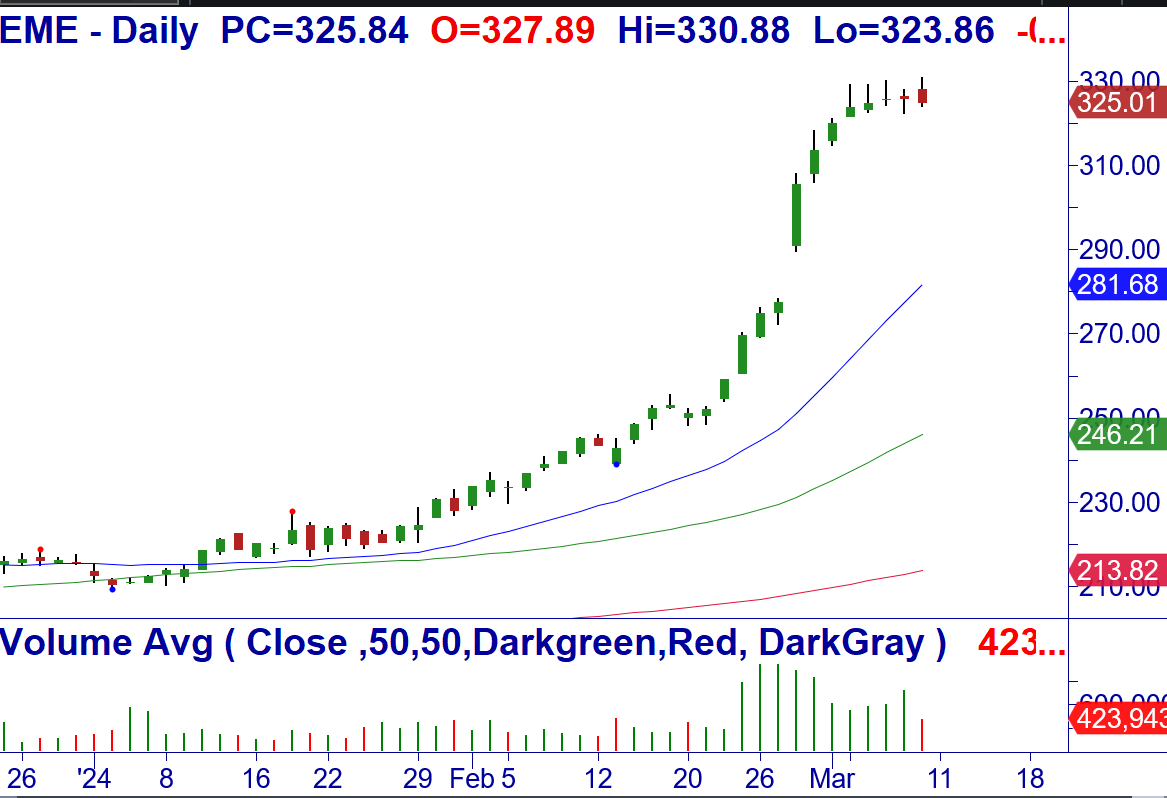
3/11: EME – Under $321.71, consider shorting the stock. Climactic Sell Setup on +Vol. and rounding top. Stop $332.32.
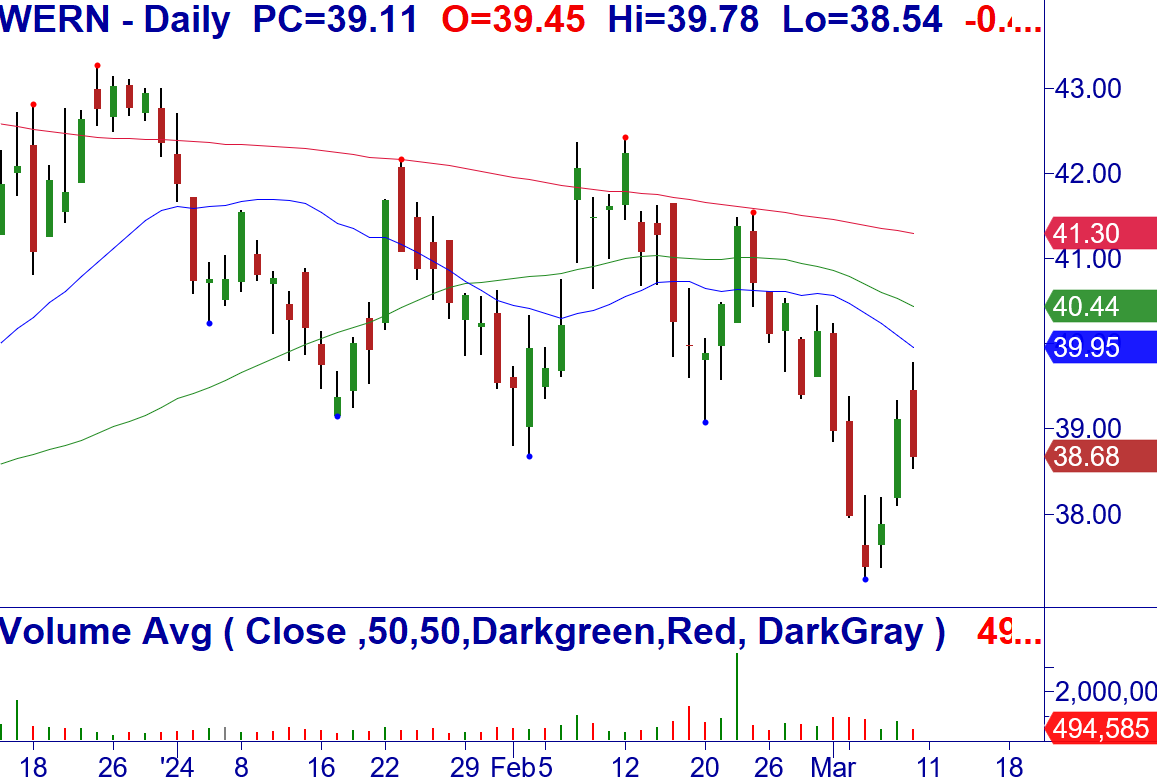
3/11: WERN – Under $38.54, consider shorting the stock. Sell Setup and reversal at the 20-MA. Stop $39.82.
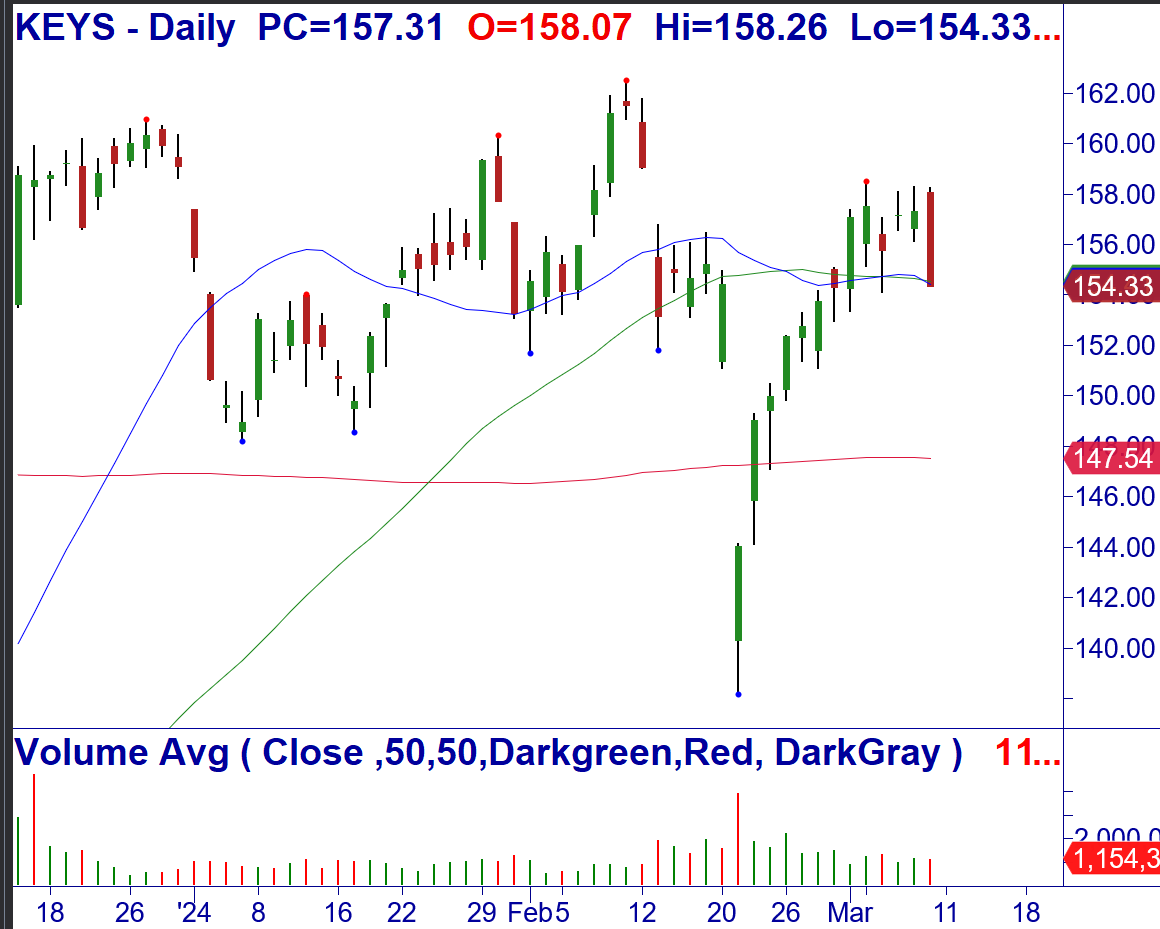
3/11: KEYS – Under $154.33, consider shorting the stock. Sell Setup and bearish 6-bar reversal. Stop $158.32.
3/11: GKOS – Under $87.45, consider shorting the stock. Sell Setup and reversal at the 20/50-MA. Stop $91.12.
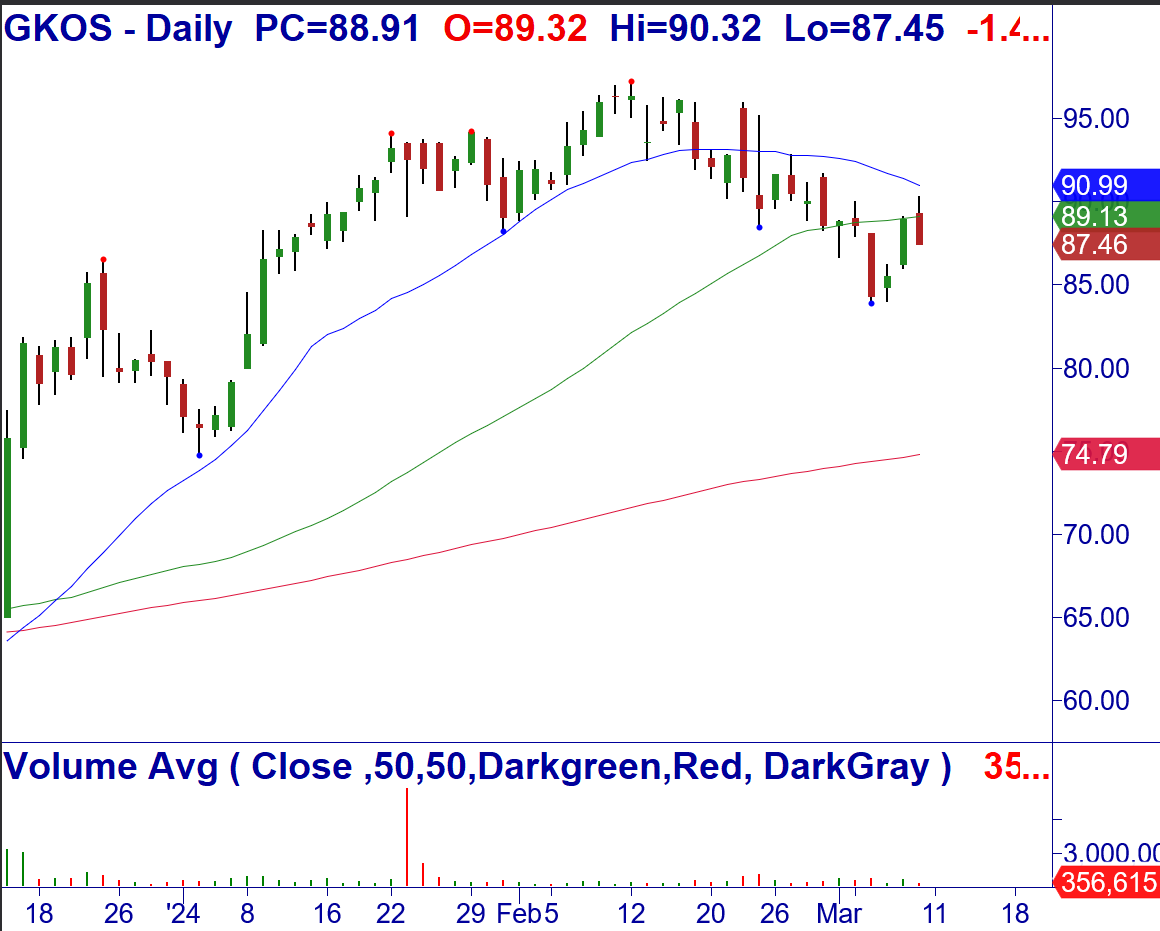
3/11: CNNE – Over $22.20, consider buying the stock. Breakout after +Gap and bullish turn. Stop $21.65.
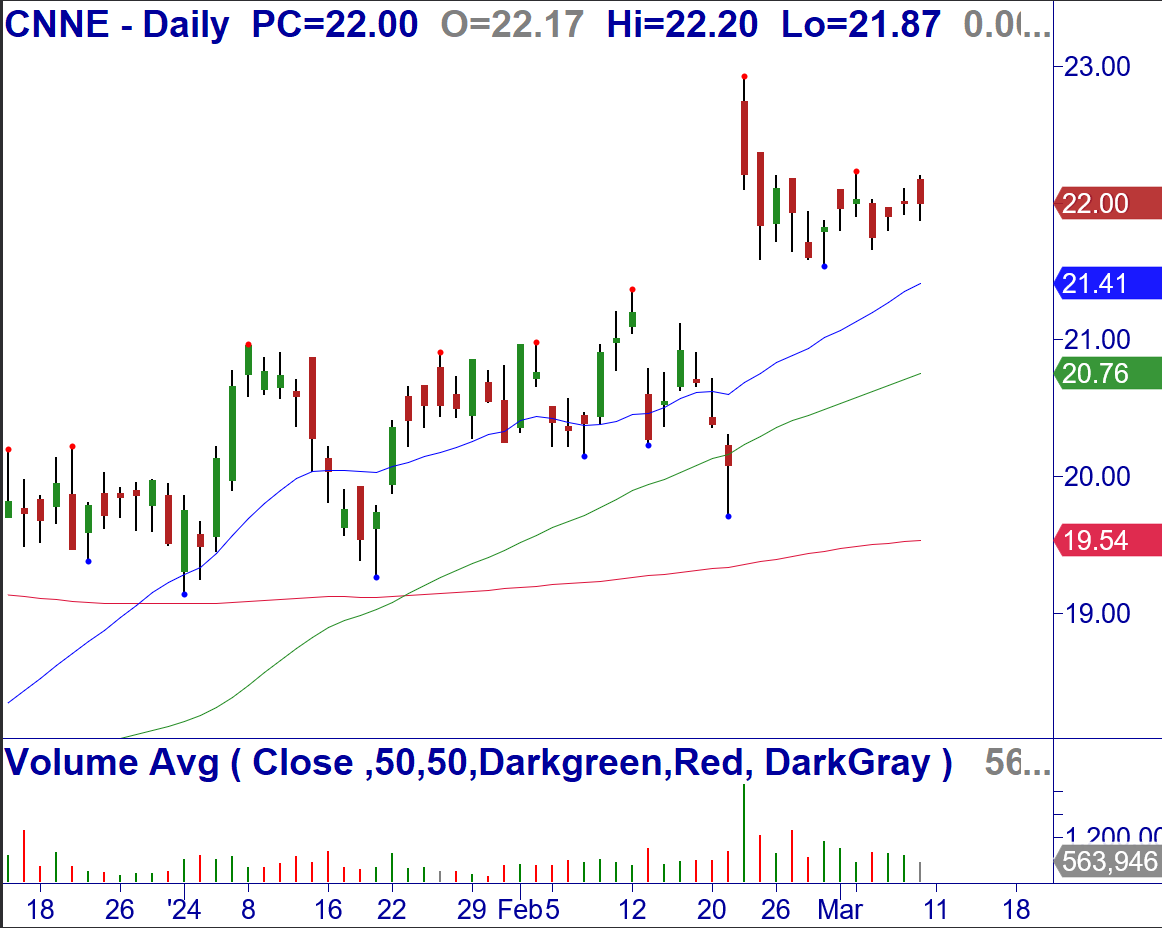
3/11: BGS – Over $11.31, consider buying the stock. Buy Setup and reversal at the 200-MA, +123 Breakout weekly. Stop $10.88.
Money Management for Trading and Investing
Proper money management for investing and Trading starts with position-sizing based on the amount of money you are willing to risk on a signal trade.
CLICK HERE to review these Master Trader Guidelines and Basic Money Management and Position Sizing Table.
NEW OPTIONS TRADING IDEAS and Video Update Below
Directional Options Strategies and Debit Spreads for Swing and Day Trading Course
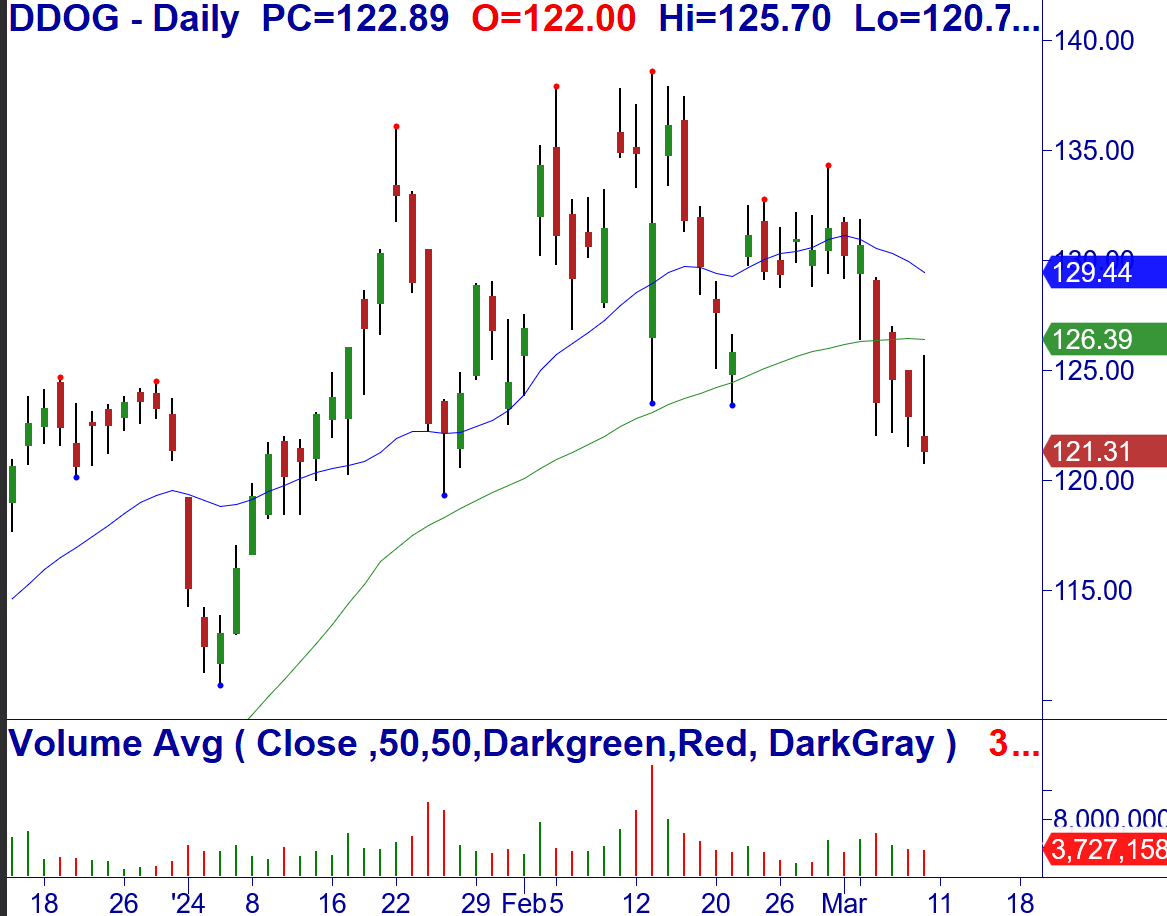
3/11: DDOG – Under $120.78, consider shorting the stock or buying Mar (3/15) $124/116 bear put debit spread for mid-point (closed at $3.40/share). Breakdown at the 50-MA. Stop $127.12.
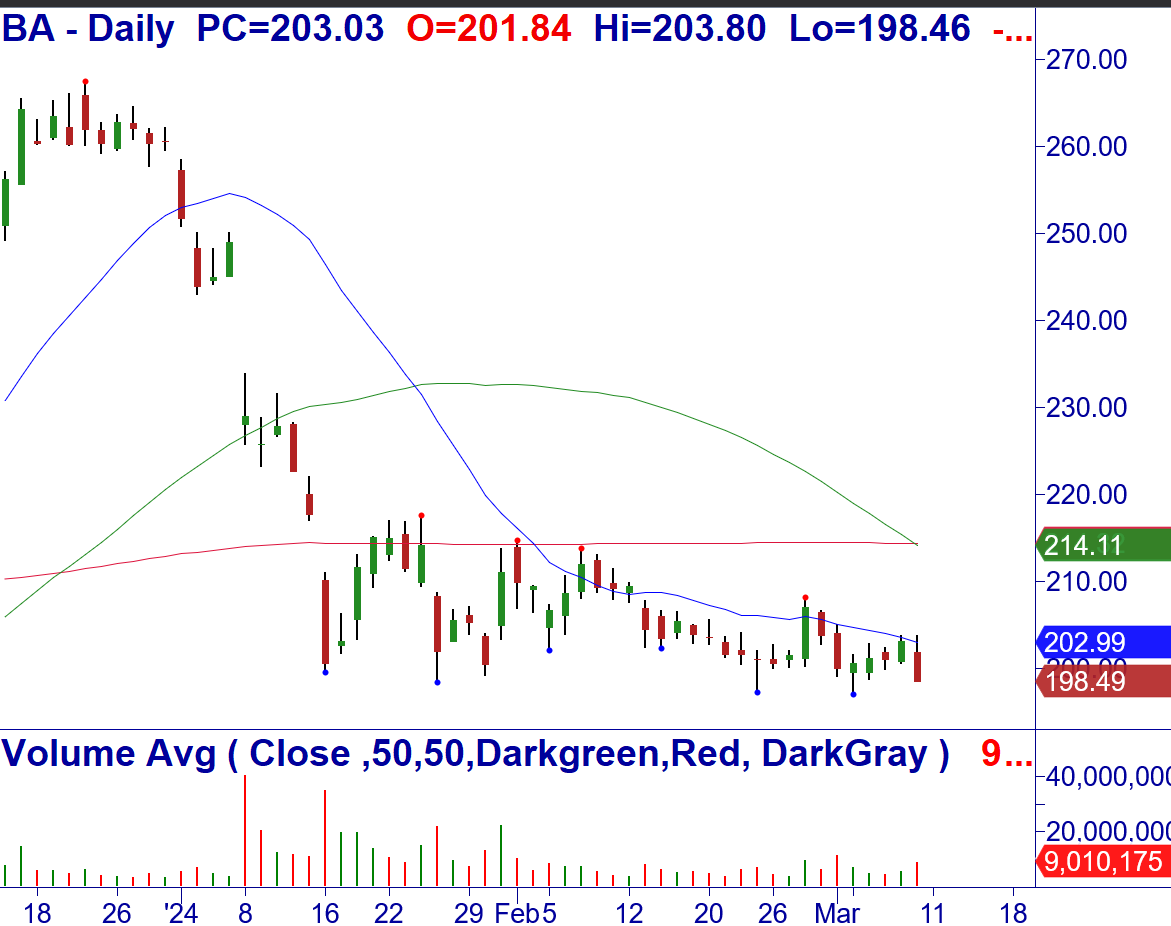
3/11: BA – Under $198.46, consider shorting the stock or buying Mar (3/15) $202.5/192.5 bear put debit spread for mid-point (closed at $4.46/share). Breakdown at the 20-MA. Stop $204.22.
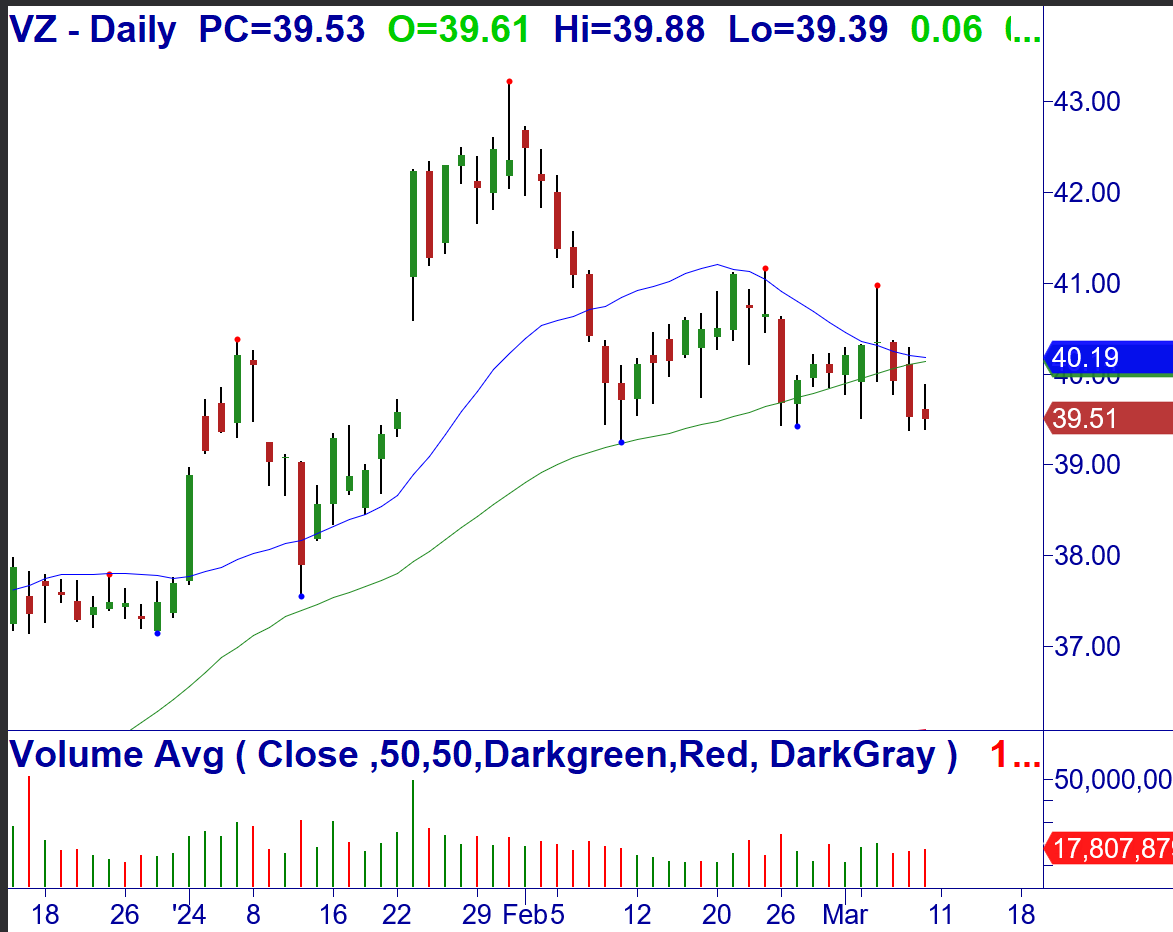
3/11: VZ – Under $39.38, consider shorting the stock or buying Mar (3/15) $40.5 puts for mid-point (closed at $1.09/share). -123 Breakdown at the 20/50-MA. Stop $40.32.
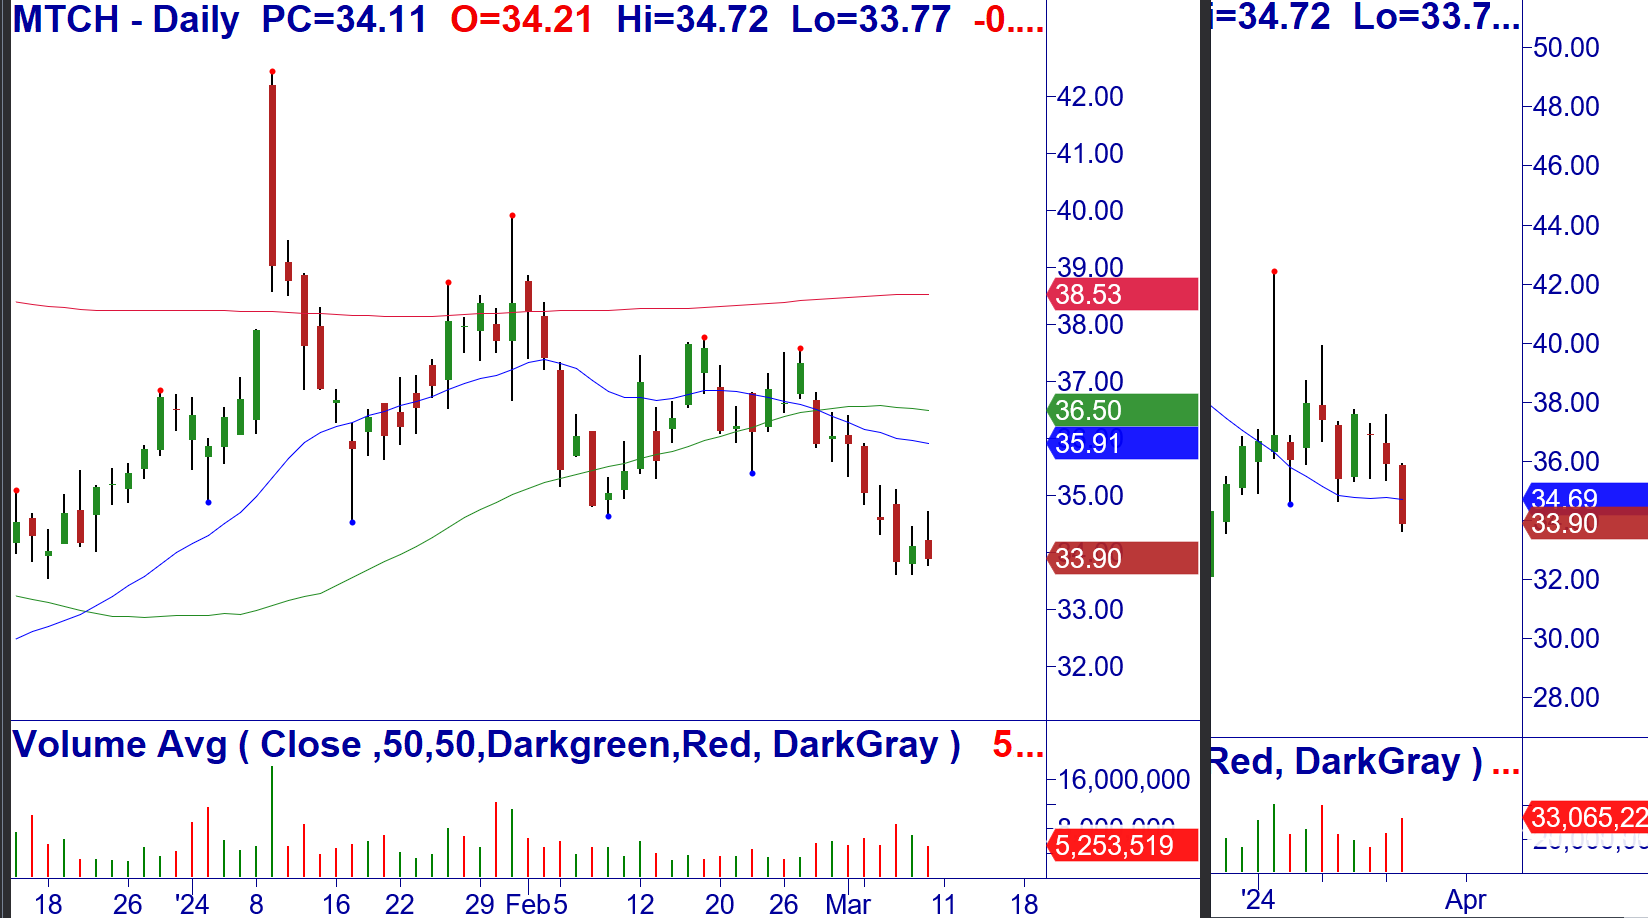
3/11: MTCH – Under $33.62, consider buying Mar (3/15) $35 puts for mid-point (closed at $1.43/share). -1234 Breakdown. Stop $35.12.
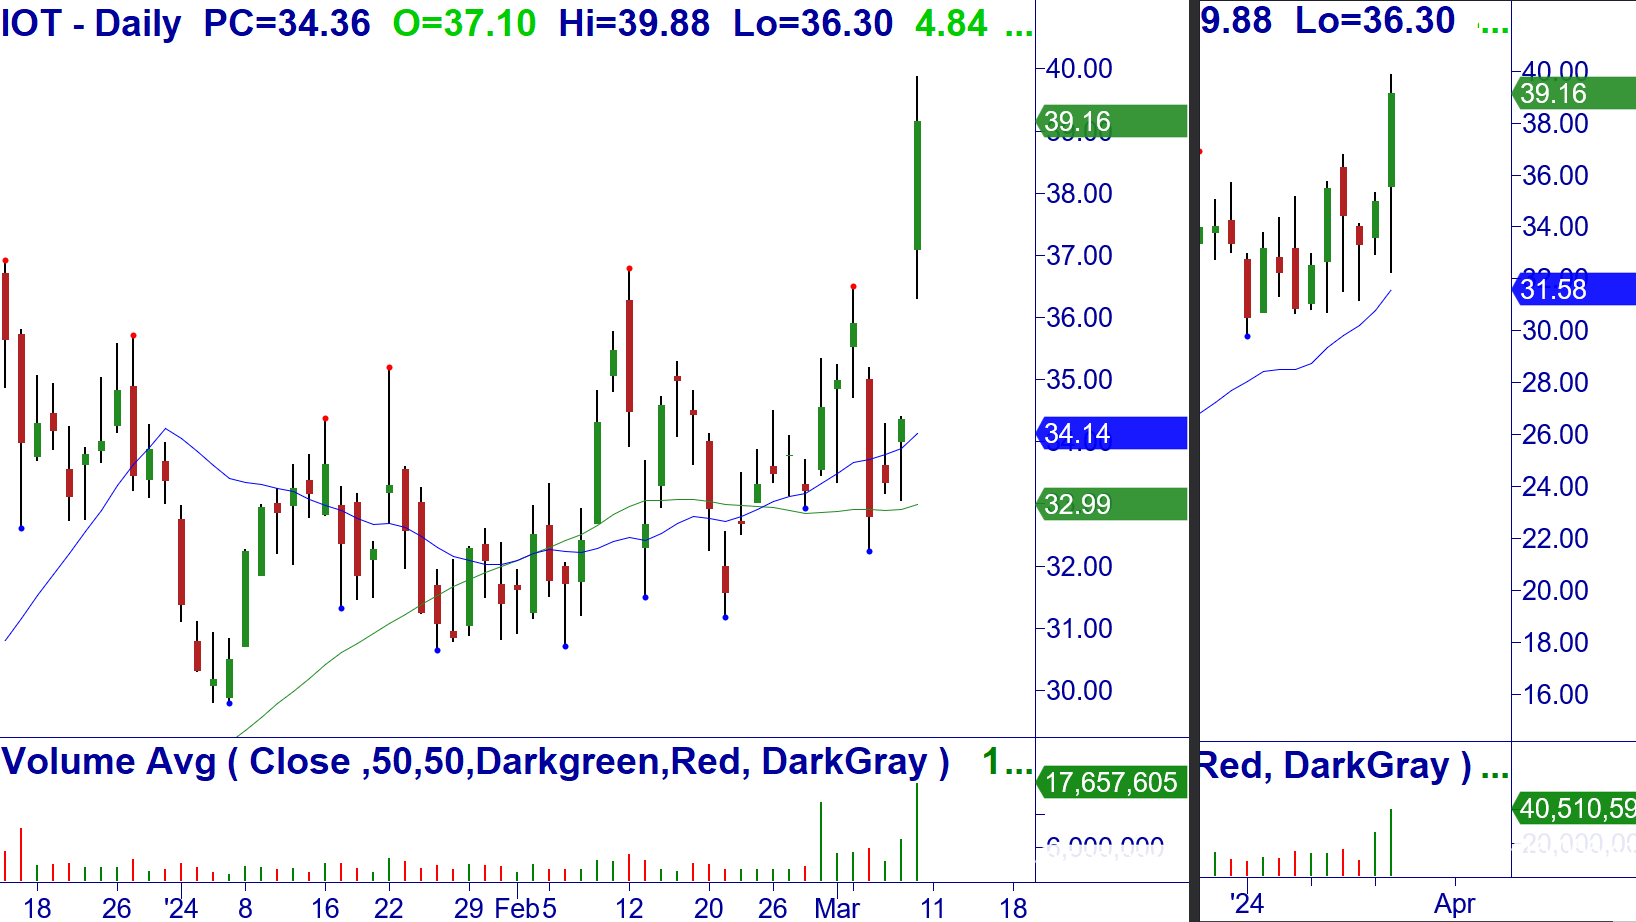
3/11: IOT – Over $39.16 (closing price), consider shorting Mar (3/15) $38.5 puts for a limit of $.90/share (closed at $1.00/share). +Gap Breakout to all-time highs. Stop $34.14 for now, will take an assignment as a core long if needed.
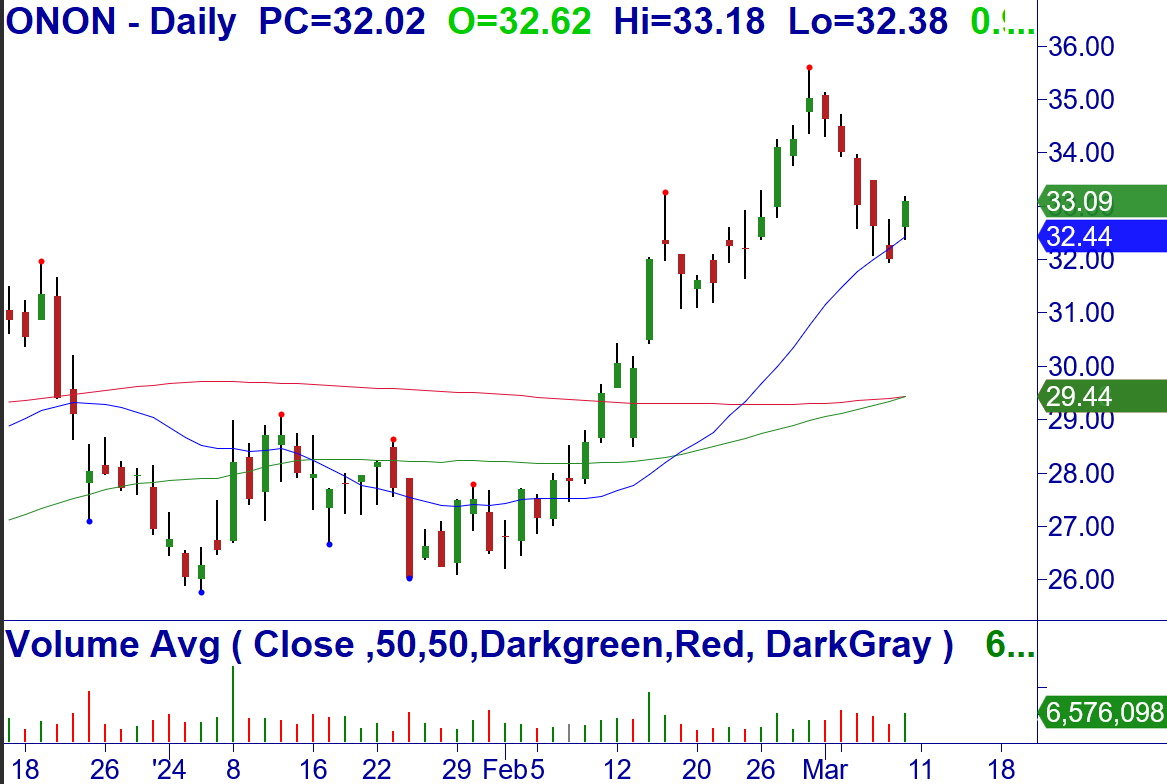
3/11: ONON – Over $33.18, consider shorting Mar (3/15) $29 puts for a limit of $.65/share (closed at $.68/share). Buy Setup and bullish reversal at the 20-MA. Stop $29.44 for now (50/200-MA). Earnings 3/12 but we plan to hold as a speculative earnings trade. Stop 55.760 for now. Please don’t take the trade unless you understand and accept the possible adverse gap risk with earnings.
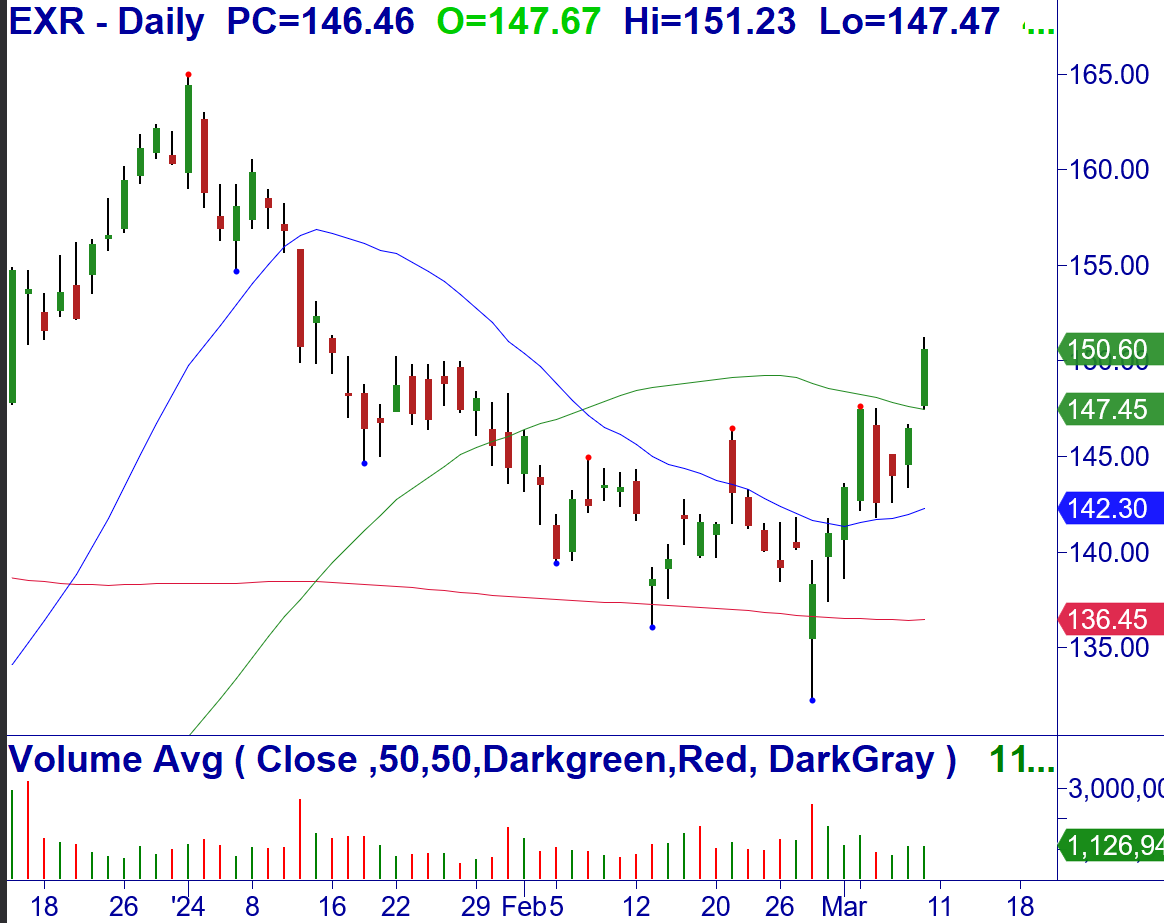
3/11: EXR – Over $150.60 (closing price), consider shorting Mar (3/15) $145 puts for a limit of $.80/share (closed at $.87/share). +Gap Breakout of a bottoming pattern at the 50-MA. Stop $144.98.
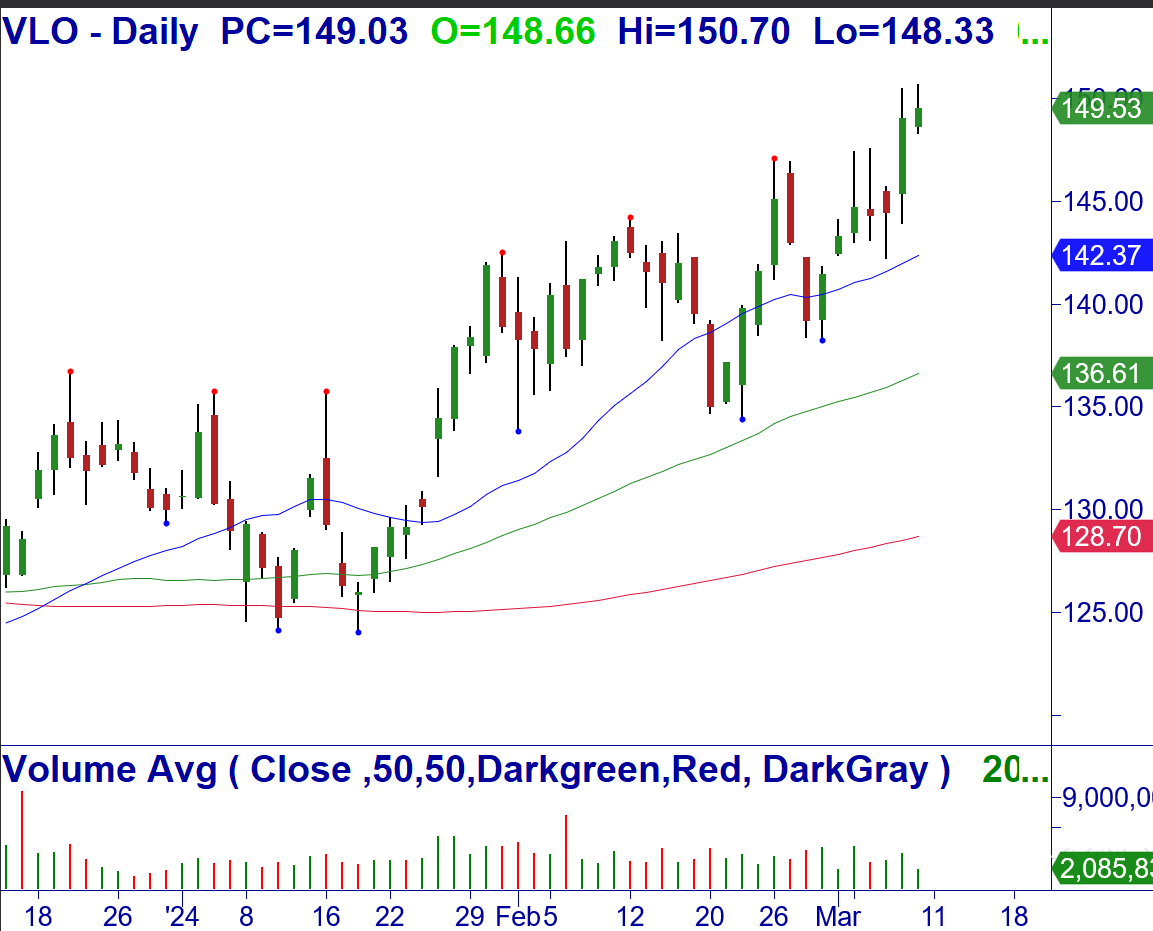
3/11: VLO – Over $150.70, consider buying Mar (3/15) $147/155 bull call debit spread for mid-point (closed at $3.26/share). +123 Breakout at the 20-MA. Stop $143.92.
VIDEO ON OPEN TRADES AND ADJUSTMENTS (Note: Also see the Open/Closed trade sheet in Member area
[s3mm type="video" s3bucket="mastertrader2" s3region="us-east-1" files="dans-video/advisory_240309.mp4" source="cloudfront" /]
Because your success is vital to you – and us.
Before selling options or credit spreads, we urge you to review the valuable and detailed information that we have provided for you in your Member’s Area Resources.
A quick simplified approach to calculating contract size is to simply base your contract size based on the number of shares permitted in your Trading Plan as if you were trading the stock or ETF. Simple Share Sizing = $ Risk / Stop Loss

The amount of money that you are willing to risk – divided by – the stop loss amount. For example, $100 / .20 = 500 shares. Credit Spread example, if your Trading Plan allowed you to trade 543 shares of AAPL based on the stop loss, then simply round down to the nearest hundred and short an equivalent number of contracts of the option. Since 1 contract represents 100 shares of the underlying, this would be five (5) contracts.
Master Trader and You Building Your Financial Future Together!
Happy trading! If you have any questions or comments, please e-mail Greg Capra at Greg@mastertrader.com or Dan Gibby at Dan@mastertrader.com
All the best,
Greg Capra Managing Director of Master Trader
Dan Gibby Chief Options Strategist
NOTE: Master Trader will show the opening and closing prices of all stock and options trades. We recommend that all traders and investors use proper share sizing for positions and money management. However, we cannot recommend what that is for your particular trading style, risk tolerance, or account balance. We urge you to calculate your own share/position size based on your individualized risk parameters, Trading Plan, and familiarity with the proposed trade strategy and risk. Advanced Management Strategies (AMS) covers in detail foundation and advanced position and money management.
NOTE: Master Trader and its representatives may have existing positions in actual or other trade recommendations before or after suggested herein. Additionally, we may manage them differently for internal purposes based on different risk parameters than noted herein. All trade ideas and content are for informational and educational purposes only. It is not, nor is it intended to be, trading or investment advice or a recommendation that any security, option, or investment strategy is suitable for any person. Trading securities can involve high risk and the loss of any funds. Significant gaps or volatility can increase these losses, particularly for short option strategies. Investment or trading information provided may not be appropriate for all investors, and is provided without respect to individual financial sophistication, financial situation, investing time horizon or risk tolerance. Supporting documentation for any claims (including claims made on behalf of options programs), comparison, statistics, or other technical data, if applicable, will be supplied upon request. Master Trader Consulting, Inc. is not a licensed financial advisor, registered investment advisor, or a registered broker-dealer. Options, futures, and futures options are not suitable for all investors.