Last week’s comments included,
“Unless some negative event happens over the weekend, prices will likely move into their Sell Zones.
The S&P 500 ETF (SPY) would be between 440 and 445. The NASDAQ 100 ETF (QQQ) would be between 350 and 355.
So, there’s still room to move higher to take advantage of. We will see if a reversal pattern forms in those areas.”
It took all week of flip-flopping back and forth before the broader markets could gap higher on Thursday into the bottom of the respective Sell Zones mentioned.
Thursday morning, our premarket commentary mentioned that the gap up might be a “Bull Trap.” It turned out to be exactly that as the markets immediately returned to the unfilled gap area.
Once there, buyers stepped up as they typically do when prices fill the morning gap, but after 15 minutes of trying to move prices, higher, the bulls gave up and prices collapsed.
After some wild up and down price action to grind prices halfway back into the morning range, buyers gave up, and the markets fell to the day’s low.
Finally, there was some follow-through to a previous day’s direction on Friday, and the broader markets gapped lower.
By the end of the week, most of the broader markets lost some ground but did not retrace much into the large bullish Wide Range Bar (+WRB) formed on February 24th.
The back-and-forth price action last week created a relatively small trading range.
The trend is still down, which benefits from the doubt of any bullish price action within a downtrend.
S&P Sector ETFs
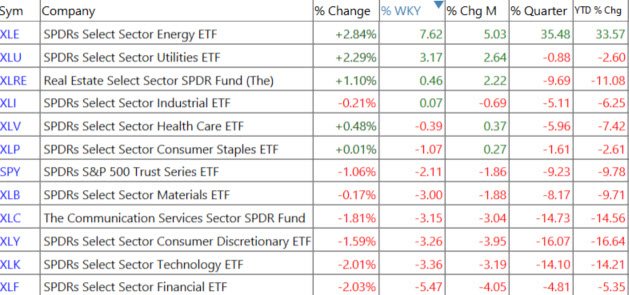
S&P Sector ETF Daily Charts
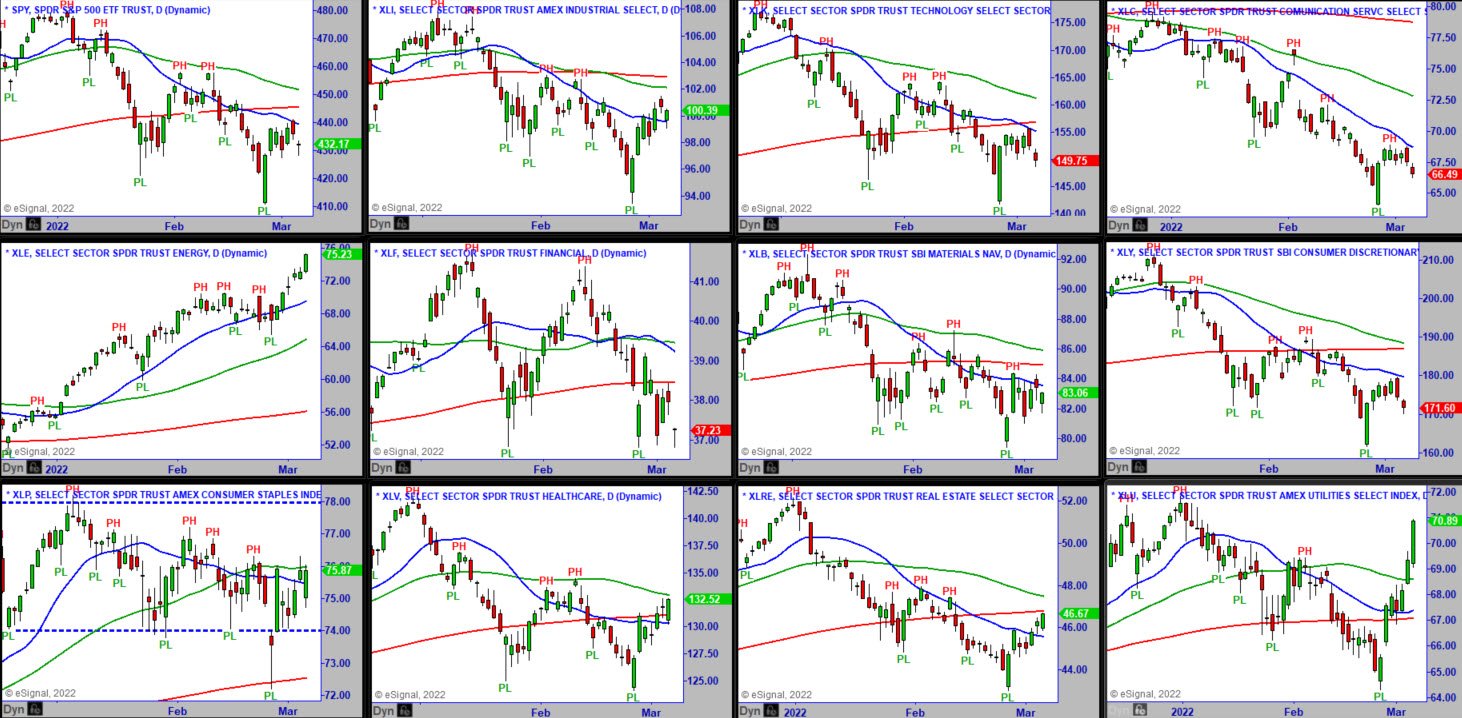
To see larger charts, right-click and then choose – Open in new tab.
The S&P 500 was able to touch its declining 20-MA for a moment on Thursday morning before sellers took advantage of its minor move higher into the Sell Zone. While the selling followed through on Friday, buyers held prices above the important $430 level on a closing basis. A break below Friday’s low should send prices lower, possibly down to the 410 area.
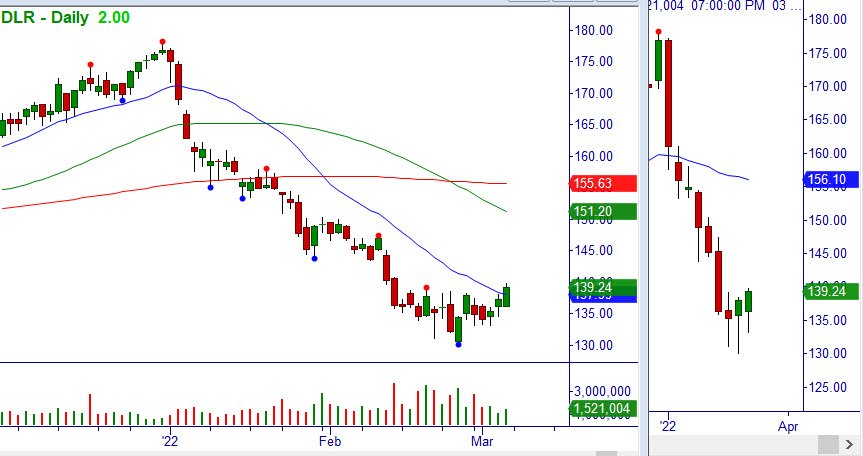
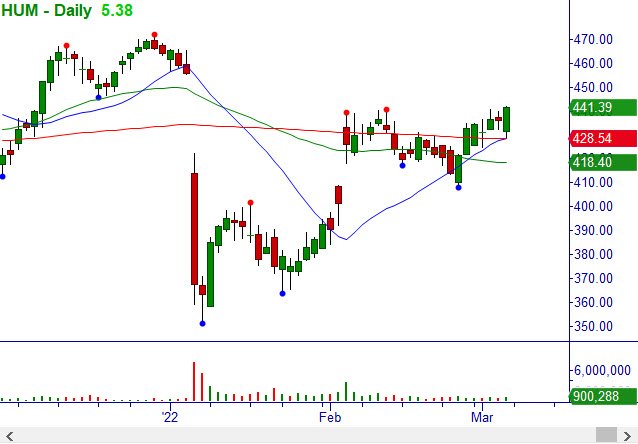
If the markets are moving higher, HUM has shown relative strength and closed strong on Friday. DLR is curling up from a bottom. Both are long setups.
The Industrials ETF was able to advance a bit last week into the Sell Zone and reversed lower. The depth of the retracement from the low near the prior Pivot Highs in February is somewhat encouraging for the bullish case. A break below $95 on a closing basis opens the door to the void below.
Defense stocks are a big part of why this ETF performed well. However, railroad stocks also did well last week. CSX, UNP, and NSC broke out.
The Technology ETF closed below its recent trading range. That break opens up the door to moving significantly lower. AAPL and MSFT are weak and look lower. If they do, this index has to go lower.
The Communications ETF that was a better performer last week gave it all back and a little more. This sector has been one of the weakest this year. FB and GOOGL are in this ETF and both look lower.
The Energy ETF returned to the top performer last week and is now up 36% this year. It is close to the top of a significant resistance area from 2016 to 2019. If you own stocks within this ETF that are extended higher, the timing of selling covered calls above current prices on those stocks is at hand.
The Financial ETF was the biggest loser last week, with an almost 5% loss. However, it has only returned to the bottom of its recent trading range. A close below this range will be bearish for the broader markets. If technology is moving lower simultaneously, the markets are likely going to be a broad-based sell-off.
The Materials ETF was a small loser last week but “marked time” within its small trading range. Agricultural stocks like MOS and CF were the big winners, and chemical stocks like PPG, IFF, and ALB were the big losers.
The Consumer Discretionary ETF also broke below its recent trading range. As long as this market is in a bear phase, this sector will underperform.
The Consumer Staples ETF was unchanged last week. Institutions bought the gap down on Friday and if the markets sell-off this week, staples should move higher.
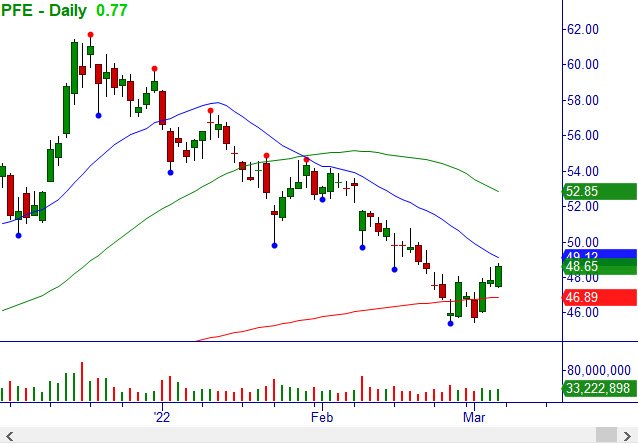
The Healthcare ETF is a chart pattern that could move higher from its retest and reversal. It’s been marking time at the February high but was also bought when it gaped lower on Friday. PFE is down about 25% from its 2021 high and has been stabilizing at its 200-MA. An initial position here by patient investors makes sense.
The Real Estate ETF moved higher last week as longer-term interest rates pulled back. The 50-MA is declining from overhead, and the 200-MA is overhead and flat—both converging in the area of price resistance. Stay away.
The Utilities ETF also benefited from the drop in interest rates and did much better than the downtrend suggested it could have. The sharp move higher in such a short time looks like another defensive move by institutions. Some of the stocks in this ETF — that are historically slow movers — moved like technology stocks in a bull market last week.
Where Are the Markets Headed This Week?
The trend is down, and last week’s sideways price action has created a new area of price resistance that the S&P 500 and the NASDAQ 100 moved below on Friday.
$4,300 in the S&P 500 and 430 in the S&P 500 ETF (SPY) was the level held all last week. There is a relatively large open interest of put options (bearish bets) at the 430 level in SPY. A break below should result in a move down to 420 or lower. A move above 440 should result in an attempt to move to 450.
Financial stocks measured by the ETFs XLF and KBE whipped back and forth last week but held their respective support areas at the bottom of their ranges. A break below those ranges will pull the S&P 500 lower. If they can rally off the bottom of those trading ranges, bulls may be able to pull a rabbit out of the hat.
The NASDAQ 100 and technology stocks have been weaker and unless prices can get decisively above 340, there is little to stop them from going down.
If Tech and Financials are moving lower, it’s unlikely the relative strength in energy will stop the broader markets from falling.
The internal market gauges are neutral, so there’s no guidance from that.
Ideally, the broader markets will sell off below the February low. That will create a larger Price Void above and align the internal market gauges.
Dow Jones Industrials
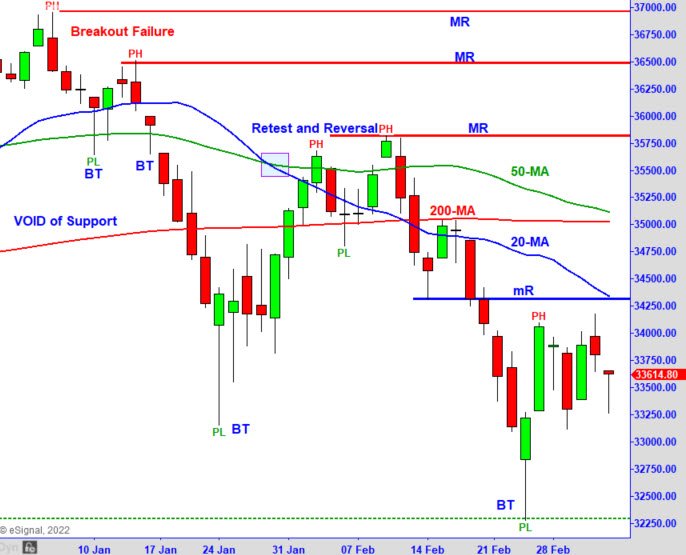
Above is the Dow Jones Industrial Average chart reviewed for MTS education and information each week.
Last week, we thought the Dow could move above the Minor Resistance (mR) and near the declining 20-MA. It could not reach above that level, and the 20-MA is now touching the mR level.
The Dow’s inability to rise above last weeks high confirms the downtrend and that selling is aggressive but not aggressive enough to push prices much lower.
Last week’s price action created a sloppy trading range that will likely be resolved this week.
Since the trend is down, it gets the benefit of the doubt. Last week’s price action communicates that neither the buyers nor sellers want to get aggressive while this uncertainty about Russia hangs over the markets.
Day-to-day news is moving the markets. A lack of news bounces prices back and forth from technical price support and resistance levels. This indecision will pass.
VIDEO REVIEW OF MARKETS AND INTERNALS
[s3mm type=”video” s3bucket=”mastertrader2″ s3region=”us-east-1″ files=”greg-letters-2022/MarketUPdate_3_7_22.mp4″ source=”cloudfront” /]
NEW STOCK TRADING IDEAS
Be sure to log into your Member’s Area to get connected to text messaging through Telegram — it’s critical to receive timely updates to new trades and trade adjustments! NOTE: New trade ideas included in these emails are not sent in Telegram when they trigger — only subsequent needed adjustments. Alerts for Targets and Stops triggered are also not sent; it is your responsibility to set alerts and manage in accordance with posted instructions if desired.
NOTE: We don’t take any trades in the first five minutes of trading unless a Telegram alert is sent explaining an alternate entry. Instead, it is acceptable to buy over the day’s high set after 9:35 ET for longs (or short under the day’s low set after 9:35 ET) unless the issue made an excessive gap or move within that time.
For further information, please see the document in RESOURCES entitled Master Trader Guidelines for Trading the Open and Gaps.

Log into Member’s Area and click the RESOURCES tab, or click HERE
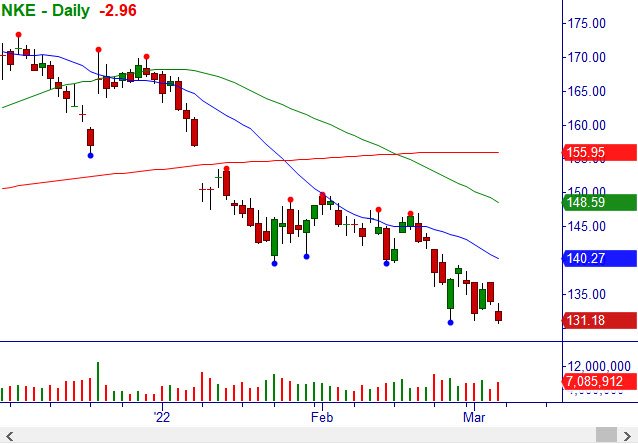
3/7: NKE – Under $130.70, consider shorting stock. Breakdown in a bearish downtrend. Earnings 3/21. Stop $136.02.
3/7: DLR – Over $139.79, consider buying stock. Breakout from bottoming pattern at 20-MA, Climactic Buy Setup and reversal weekly. Stop $134.58.
3/7: HUM – Over $442.12, consider buying stock. Breakout from inverse Head and Shoulders at 20/200-MA. Stop $428.38.
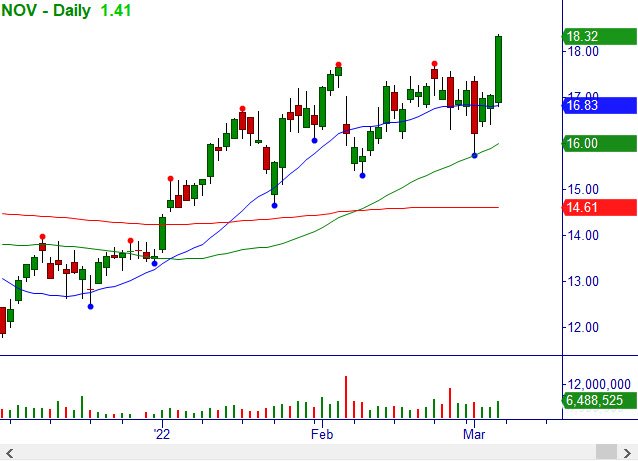
3/7: NOV – Over $18.37, consider buying stock as a core long. Breakout all time frames, bullish sector. Earnings 4/26. Stop $16.78.
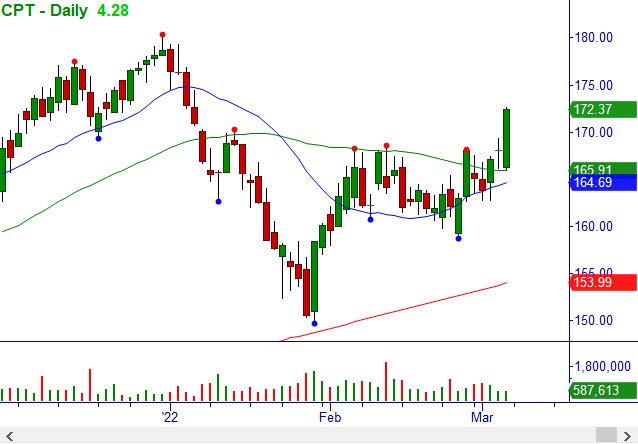
3/7: CPT – Over $172.63, consider buying stock. +WRB Breakout at 20/50-MA. Stop $165.88.
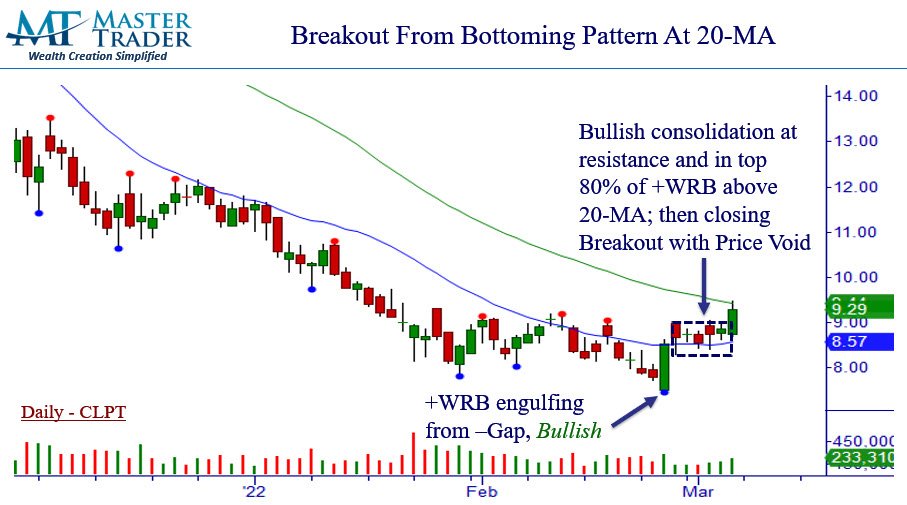
3/7: CLPT – Over $9.48, consider buying stock. Breakout From Bottoming Pattern At 20-MA. Stop $8.58.
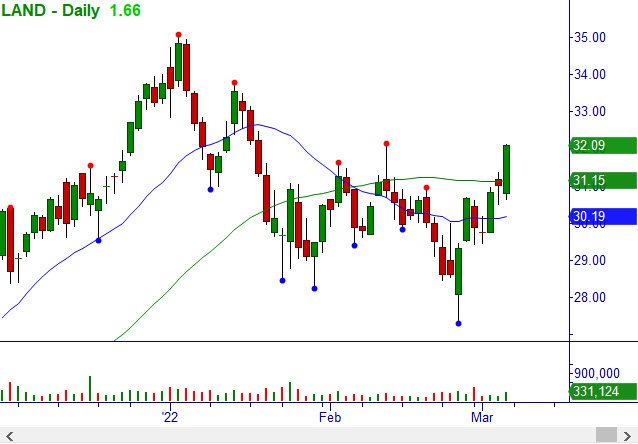
3/7: LAND – Over $32.12, consider buying stock. +WRB Breakout at 50-MA. Stop $30.48.
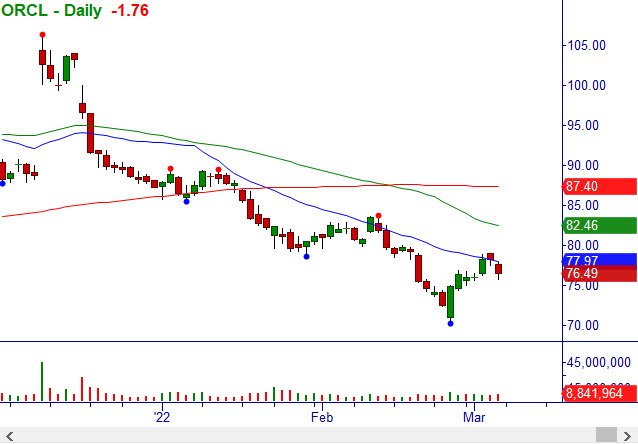
3/7: ORCL – Under $75.78, consider shorting stock. Continuation of Sell Setup at 20-MA. Earnings 3/10. Stop $79.05.
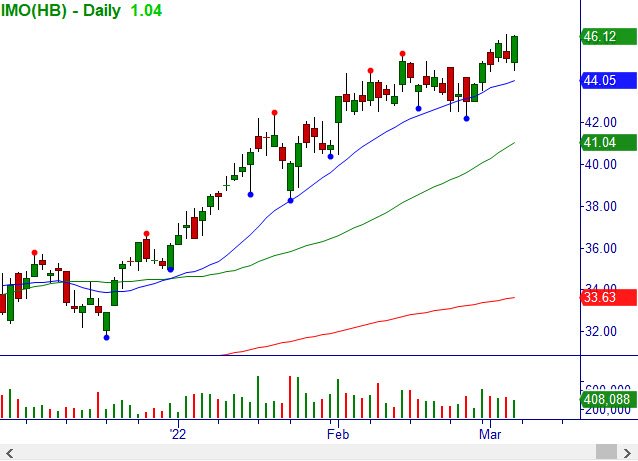
3/7: IMO – Over $46.18, consider buying stock. Breakout all time frames, bullish sector. Stop $44.38.
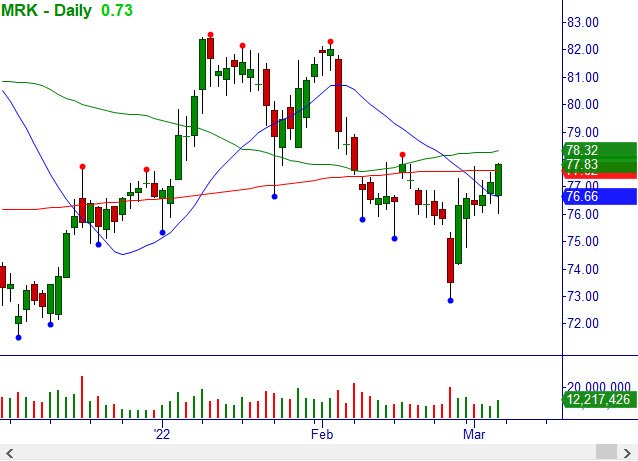
3/7: MRK – Over $77.86, consider buying stock. Bullish engulfing continuation bar Breakout at 200-MA. Stop $75.98.
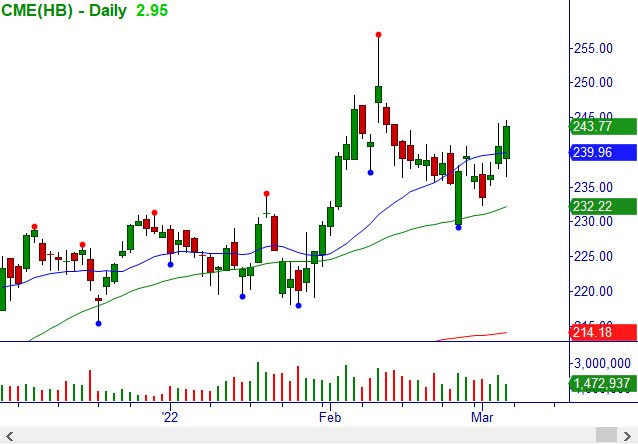
3/7: CME – Over $244.64, consider buying stock. Bullish engulfing continuation bar Breakout at 20-MA. Stop $236.48.
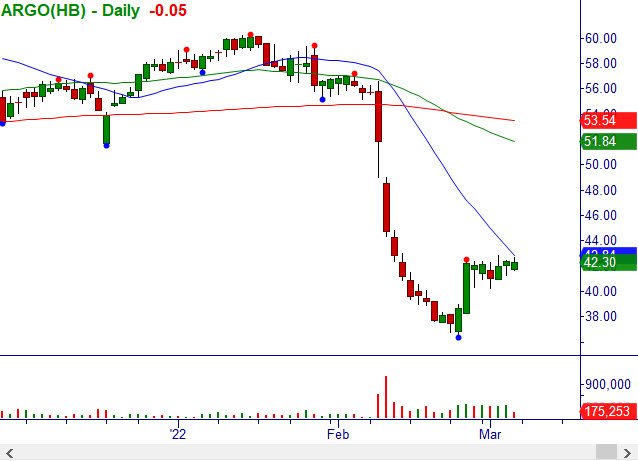
3/7: ARGO – Over $42.84, consider buying stock. Breakout from bullish consolidation in the top half of +WRB Igniting. Stop $40.18.
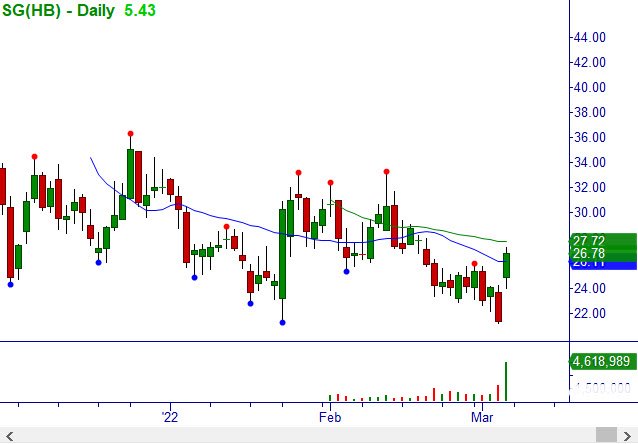
3/7: SG – Over $27.21, consider shorting Mar (3/18) $20/15 bull put credit spread for a limit of $.50/share (closed at $.55/share). +Gap Breakout on +Vol. over a red bar on earnings. Stop $21.17.
NEW OPTIONS TRADING IDEAS and Video Update Below
NOTE: For the directional options trades (i.e., buying options/spreads, not selling them), it is also acceptable to trade the stock instead with the same stop, but we prefer options when they are liquid because of the leverage and limited risk.
3/7: PFE – Over $48.77, consider buying Mar (3/11) $45/51 bull call debit spread for mid-point but not over $3.72/share (closed at $3.60/share). Bullish reversal at 200-MA. Stop $47.28.
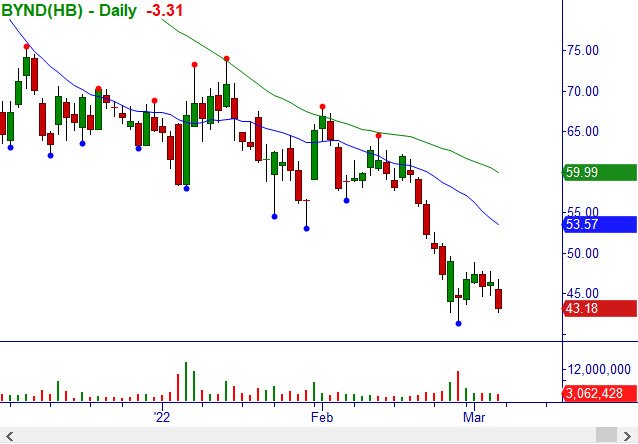
3/7: BYND – Under $42.70, consider buying Mar (3/11) $47/39 bear put debit spread for mid-point (closed at $3.80/share). Continuation of Sell Setup in a bearish downtrend. Stop $47.82.
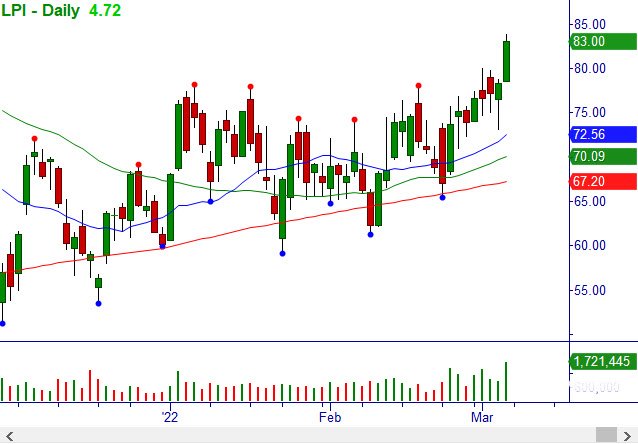
3/7: LPI – Over $83.82, consider buying stock and selling Mar (3/18) $95 calls for mid-point (closed at $80.90/share). Breakout all time frames, bullish sector. Stop $75.63.
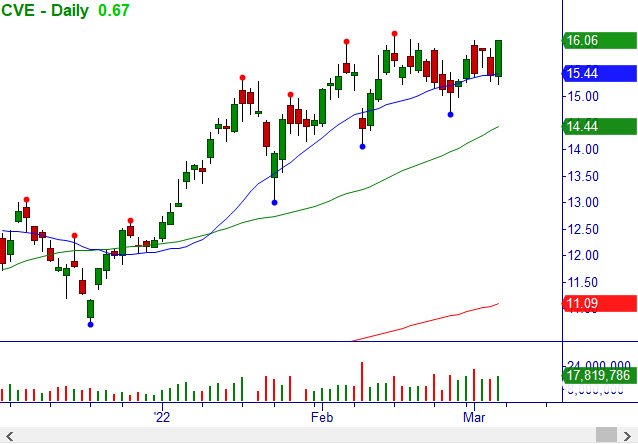
3/7: CVE – Over $16.06, consider buying Mar (3/11) $14/17 bull call debit spread for a limit of $1.78/share (closed at $1.75/share). Breakout daily/weekly, bullish sector. Stop $15.18.
if you are interested to learn how to buy options and debit spreads for directional setups using Master Trader Strategies, click HERE
Directional Options Strategies for Swing and Day Trading – Buying options to profit on Directional moves with Candlestick patterns offers incredible benefits over trading stocks when properly used with MTS.
VIDEO ON OPEN TRADES AND ADJUSTMENTS (NOTE: Also in Member’s Area in Open/Closed Trade Sheet)
[s3mm type=”video” s3bucket=”mastertrader2″ s3region=”us-east-1″ files=”dans-video/advisory_220305.mp4″ source=”cloudfront” /]
Options Strategies Definitions Videos Here
Please read the information on Money Management below Learn how Master Trader Technical Strategies – MTS and MTS with Options Strategies can make consistent money.
Please read the valuable information in the RESOURCES tab after you log into your Member’s Area:

Click Here – to Access the Options Credit Spread Program that puts you on the Master Trader Income Path.
Click Here to Learn The Master Trader Swing Trading Strategies to profits over a few days to weeks. To invest in ETFs for weeks to months to generate wealth with compelling patterns using MTS, see Master Trader ETF Investment Trader.
Click HERE Master Trader Weekly Lessons for Investors and Traders will build your investing and trading knowledge and confidence to profit in all markets! Each lesson can change your financial future — only $11.97/month!
Because your success is vital to you – and us.
Before selling options or credit spreads, we urge you to review the valuable and detailed information that we have provided for you in your Member’s Area.
If You’re in a Rush to Start A quick simplified approach to calculating contract size is to simply base your contract size based on the number of shares permitted in your Trading Plan as if you were trading the stock or ETF. Simple Share Sizing = $ Risk / Stop Loss The amount of money that you are willing to risk – divided by – the stop loss amount. For example, $100 / .20 = 500 shares. Credit Spread example, if your Trading Plan allowed you to trade 543 shares of AAPL based on the stop loss, then simply round down to the nearest hundred and short an equivalent number of contracts of the option. Since 1 contract represents 100 shares of the underlying, this would be five (5) contracts.
Master Trader and You Building Your Financial Future Together!
Happy trading! If you have any questions or comments, please e-mail Greg Capra at Greg@mastertrader.com or Dan Gibby at Dan@mastertrader.com
All the best,
Greg Capra Managing Director of Master Trader
Dan Gibby Chief Options Strategist
NOTE: Master Trader will show the opening and closing prices of all stock and options trades. We recommend that all traders and investors use proper share sizing for positions and money management. However, we cannot recommend what that is for your particular trading style, risk tolerance, or account balance. We urge you to calculate your own share/position size based on your individualized risk parameters, Trading Plan, and familiarity with the proposed trade strategy and risk. Advanced Management Strategies (AMS) covers in detail foundation and advanced position and money management.
NOTE: Master Trader and its representatives may have existing positions in actual or other trade recommendations before or after suggested herein. Additionally, we may manage them differently for internal purposes based on different risk parameters than noted herein. All trade ideas and content are for informational and educational purposes only. It is not, nor is it intended to be, trading or investment advice or a recommendation that any security, option, or investment strategy is suitable for any person. Trading securities can involve high risk and the loss of any funds. Significant gaps or volatility can increase these losses, particularly for short option strategies. Investment or trading information provided may not be appropriate for all investors, and is provided without respect to individual financial sophistication, financial situation, investing time horizon or risk tolerance. Supporting documentation for any claims (including claims made on behalf of options programs), comparison, statistics, or other technical data, if applicable, will be supplied upon request. Master Trader Consulting, Inc. is not a licensed financial advisor, registered investment advisor, or a registered broker-dealer. Options, futures, and futures options are not suitable for all investors.