Last week in the “Where Are the Markets Headed” section it said, “There is no doubt whatsoever; they are going up.”
That was followed by a disclaimer that said the fact that I said that was a concern.
The broader markets measured by the S&P 500 and the NASDAQ 100 did move higher. It wasn’t impressive; it was more of a jump up and grind sideways.
Maybe I should’ve said, “There’s no doubt whatsoever that they are not going down.”
Since the flash crash Corona low, which has been 17 months now, the S&P 500 only violated the prior month’s low intra-month.
Meaning, there has not been a close below a prior month’s low in 17 months!
And while historically, the September October months have produced corrections, nothing has occurred technically bearish yet.
On the contrary, breadth has moderately improved, long-term interest rates in the Transportation index have been bottoming, and the Fed has broadcasted that they’re not going to raise interest rates.
In 2018, when the broader markets started a downward move at this time of the year, the Fed raised interest rates several times. There was a retest topping pattern that formed before the beginning of the drop.
And while the markets did bounce after the end of October, the full correction wasn’t done until the markets had fallen almost 20% from the September high.
In 2019, the S&P 500 was in a broad trading range and testing past price resistance and an M-Top. That downturn resulted in a 5% correction.
In 2020, the markets were trending higher after the Corona flash-crash and began to accelerate higher in August and peaked September 2nd with a Wide Range Bar (+ WRB) that ended the move higher.
That top resulted in a 10% correction in September, followed by a 9% advance that ended in the middle of October, and then another 8% correction to test the September low.
At this time, there are none of the technical patterns that preceded those seasonal pullbacks.
I’m not suggesting to be complacent, but we must be objective and not assume that history will repeat itself without a technical pattern.
S&P Sector ETFs
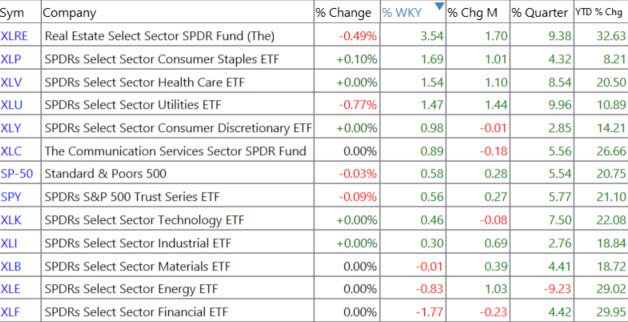
S&P Sector ETF Daily Charts
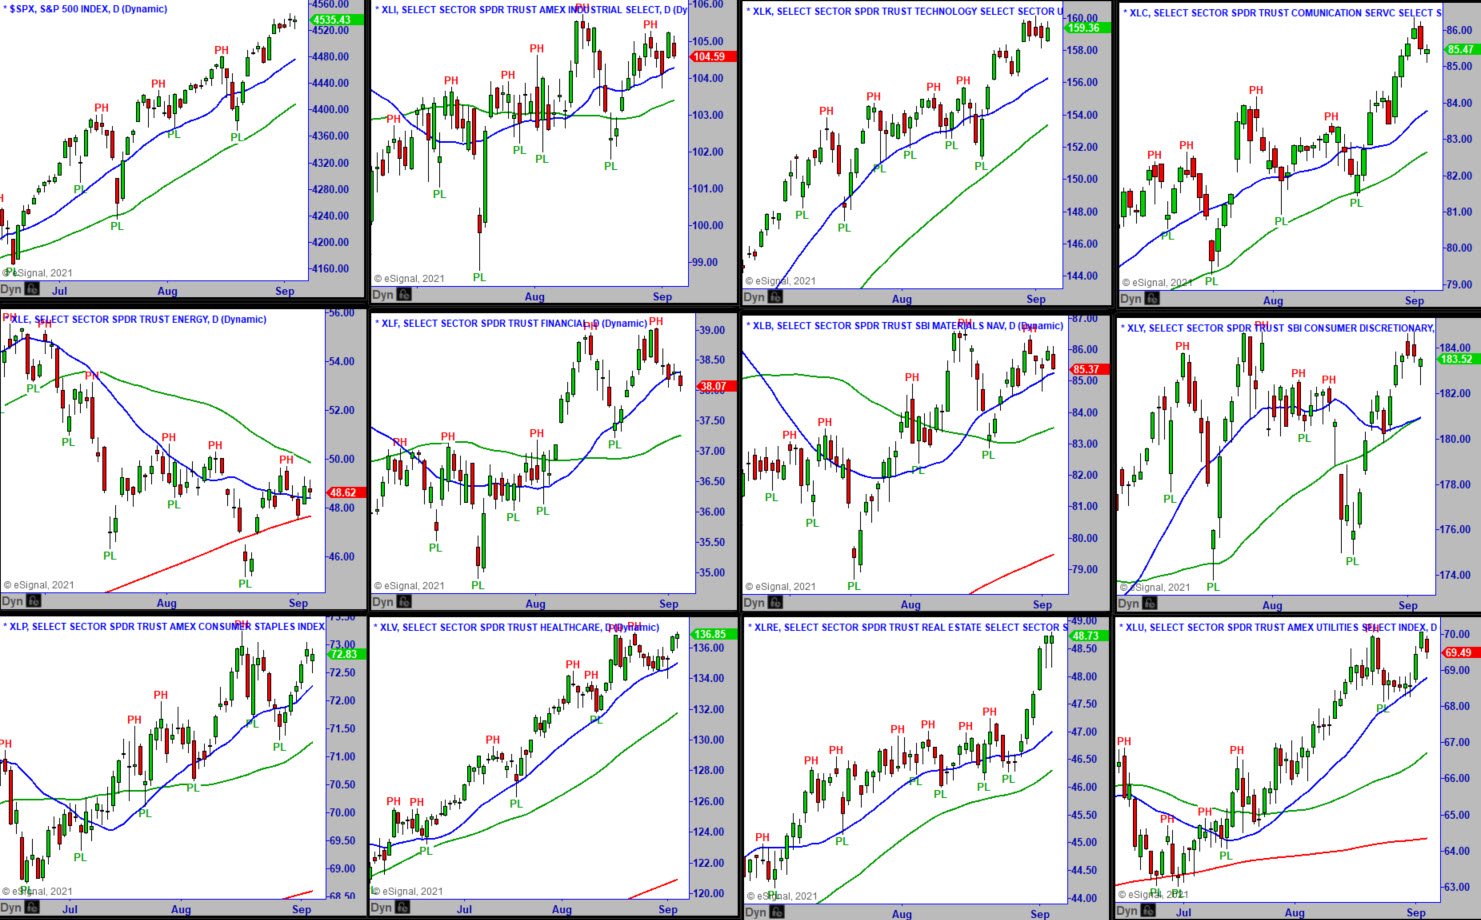
To see larger charts, right-click and then choose – Open in a new tab.
It was a relatively quiet week, with last week’s underperformers moving up a bit and the prior week’s performers flat to giving back a bit.
The S&P 500 was able to grind out half a percent increase, but overall the price action was back-and-forth.
The Industrials barely moved from last week’s close but are moving sideways at the prior high from the middle of August. There was a downward dip on Wednesday that quickly recovered on Thursday. That type of bullish price action at prior resistance suggests prices could move higher if they clear Thursday’s high.
The Technology ETF continues to show relative strength, and last week’s consolidation after Monday’s initial move up suggests higher prices.
The Communications ETF continued higher from the prior Friday’s +WRB at the beginning of the week, but buyers faded away Thursday and Friday.
Energy continues its whippy price action in the area of the 200-MA, which buyers held that location on Wednesday. The bottoming price action over the last month or so is getting tighter. Notice how the three moving averages are converging.
Energy was weak, but the week before last the biggest winner with a 3% gain. Maybe next week Energy will move out of this tightening range. If you don’t mind getting into a trade of a bottoming pattern that hasn’t proven itself yet, consider a buy stop above Thursday’s high. It could be a catch-up trade.
Financials were the worst performer last week but were one of the best performers the week before last. This seesaw price action week to week has been occurring a lot lately. Prices of this sector pulled back far enough to where buyers should want to step in. If they do, the sector should help the S&P 500.
Materials have been trading in a similar pattern as the one in the Industrials. For that reason, I suspect they’ll both move together. Both are consolidating at their respective prior resistance areas.
Consumer Discretionary is back to the top of its trading range, where sellers showed up Wednesday and Thursday. Buyers bought the dip on Friday. It’s too early to tell if this is a correction bar that could become a continuation pattern.
Consumer Staples was one of the biggest losers the week before last, and this week is one of the largest gainers. It’s now at its prior high and formed a Bottoming Tail (BT) on Friday. Institutions keep buying whatever dips to price support.
Healthcare has been moving sideways over the last 23 weeks after forming a + WRB on August 17th. Most sectors dipped at or around that date. However, healthcare was one of the ones that dipped the least, which showed relative strength. Last week’s price action suggests that it should move higher this week.
Real Estate accelerated out of its two-month-long whippy consolidation last week. The two BTs formed on Thursday and Friday created an unusual pattern of multiple bottoming tail bars next to each other. Recently, the biggest winners one week have taken a rest the next. Real Estate may do the same.
Utilities rallied off its rising 20-MA at the end of last week and stalled right after moving above the prior high near $70, which is not unusual. The trend is up, and prices should not get back to where the advanced started last week.
Subscribe to the Advisory Swing and Options Letter HERE
Where Are the Markets Headed This Week?
Breadth improved last week, and four more sectors turned green within the ETF multiple timeframe sector Matrix.
The sentiment has not pushed up through the upper bands that have been an excellent guide to an extreme in this unique market environment. For that reason, internals still has room before they could give a bearish signal.
There were no bearish patterns of significance last week.
Even Gold and the Gold minors advanced as the US Dollar pulled back.
Bitcoin-related stocks and ETFs did well also. We closed many of our positions with great gains.
As already mentioned, there are no technical patterns to suggest the seasonal September-October weakness.
Should we see an accelerated and unified advance across broader markets and ETFs, that would be an event to suspect a short-term high is near.
We would also look for confirmation from our internal market gauges.
Dow Jones Industrials
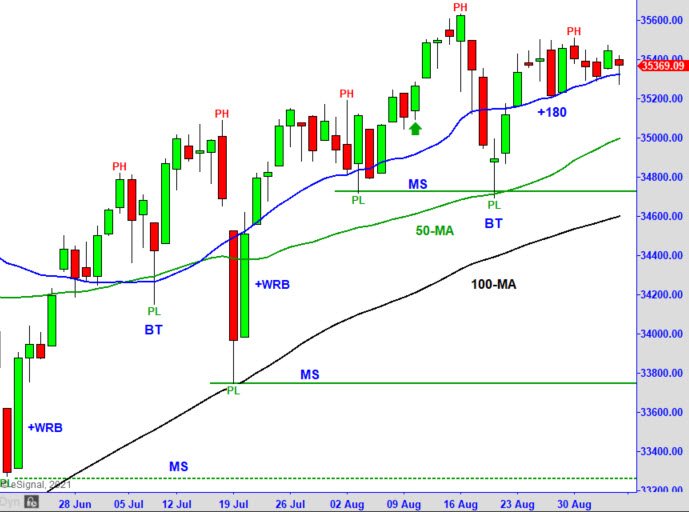
Above is the Dow Jones Industrial Average chart that we review each week for MTS education and information.
The Dow chopped sideways last week and lost a fraction of a percent.
The +180 reversal formed the week before last did not follow through, but it did not fail either.
Prices traded within the range of those two bars. If we see prices clear the most recent highs, we should see new all-time highs in the Dow industrials.
A break and close below that +180 wouldn’t negate the uptrend, but it wouldn’t be aligned with an overall bullish bias.
VIDEO REVIEW OF MARKETS AND INTERNALS
[s3mm type=”video” s3bucket=”mastertrader2″ s3region=”us-east-1″ files=”greg-letters-2021/Market_Update_9_7_21.mp4″ source=”cloudfront” /]
NEW STOCK TRADING IDEAS
Be sure to log into your Member’s Area to get connected to text messaging through Telegram — it’s critical to receive timely updates to new trades and trade adjustments! NOTE: New trade ideas included in these emails are not sent in Telegram when they trigger — only subsequent needed adjustments.
9/7: GD – Over $202.90, consider buying stock. Bullish +123 Continuation at 20-MA and Major Support. Stop $200.28.

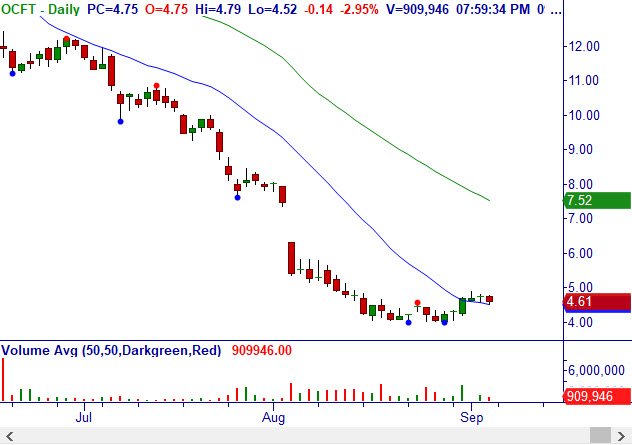
9/7: OCFT – Over $4.90, consider buying stock. Breakout of bottoming pattern at 20/50-MA. Stop $4.45.
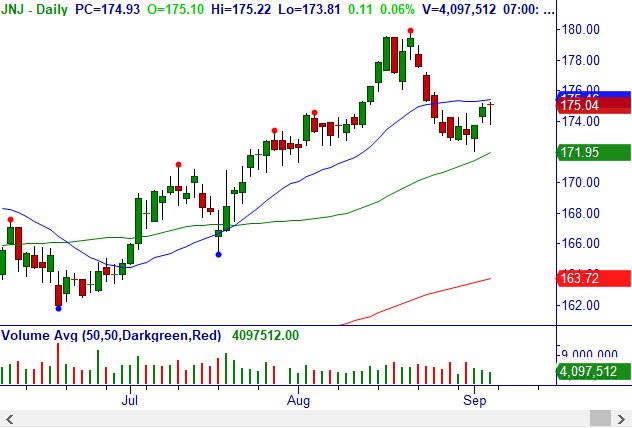
9/7: JNJ – Over $175.22, consider buying Sep (9/17) $170 calls for mid-point (closed for $5.40/share). Buy Setup and bullish reversal at 50-MA and support. Stop $173.68.
9/7: BTG – Over $4.06, consider buying stock. Breakout of bottoming pattern at 20/50-MA. Stop $3.78.

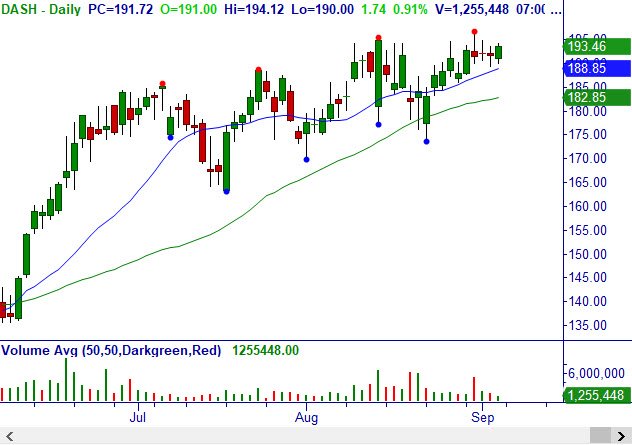
9/7: DASH – Over $194.80, consider buying stock. Breakout at 20-MA. Stop $187.58.
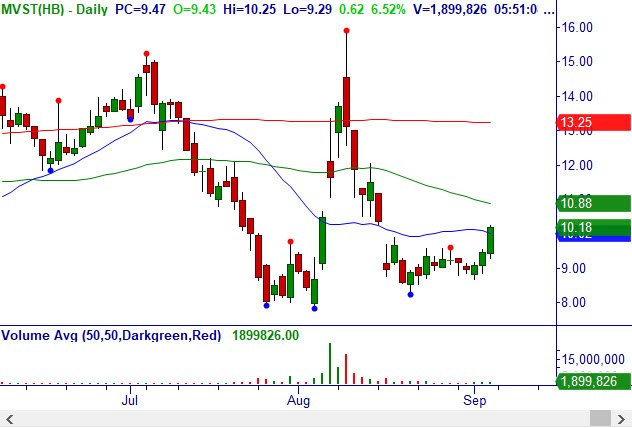
9/7: MVST – Over $10.25, consider buying stock. Breakout of bottoming pattern at 20-MA. Stop $9.23.
9/7: HUM – Over $417.92, consider buying stock. Bullish +123 Continuation at 20-MA and Major Support, bullish +180 reversal weekly. Stop $404.96.

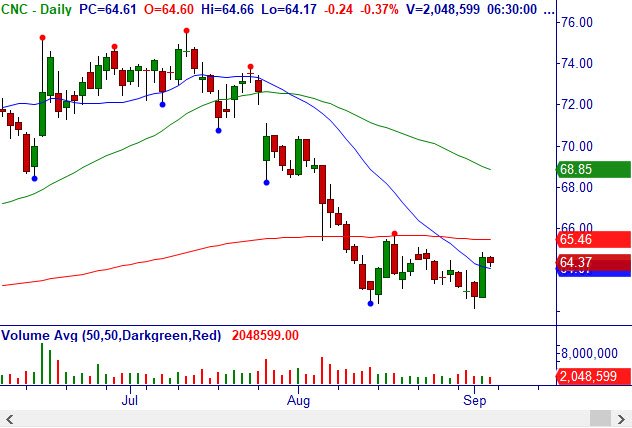
9/7: CNC – Over $64.86, consider buying stock. Bullish +123 Continuation at 20-MA and Major Support. Stop $62.69.
9/7: UNH – Over $424.40, consider buying stock. Bullish +123 Continuation from consolidation and 20-MA. Stop $418.23.

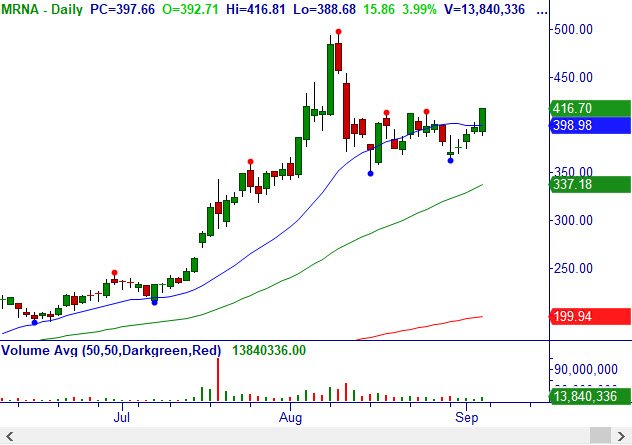
9/7: MRNA – Over $416.81, consider buying stock. Breakout at 20-MA, bullish weekly. Stop $388.68.
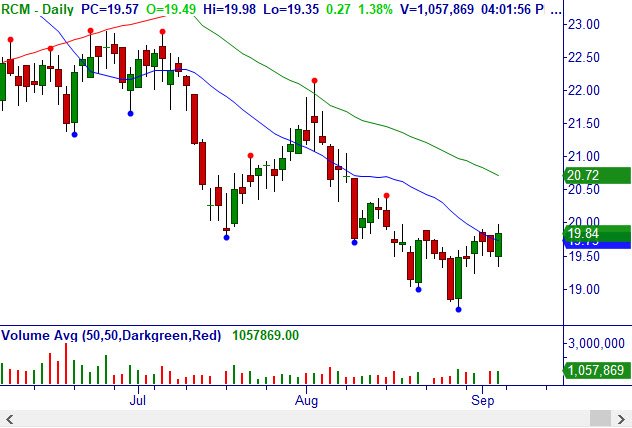
9/7: RCM – Over $20.00, consider buying stock. Anticipated Breakout of inverse head and shoulders bottoming pattern. Stop $19.28.
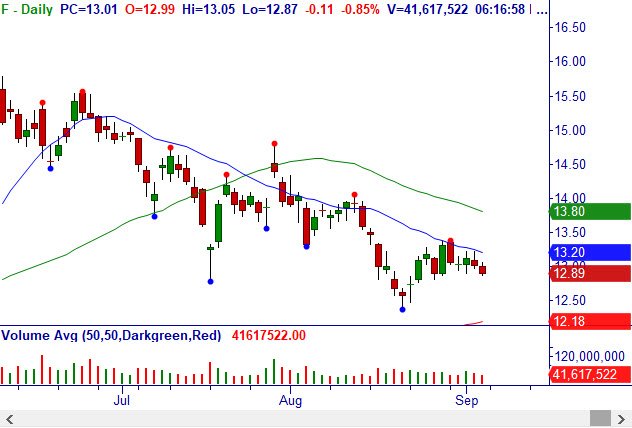
9/7: F – Under $12.87, consider shorting stock. Sell Setup and bearish reversal at resistance and 20-MA daily, bearish weekly. Stop $13.23.
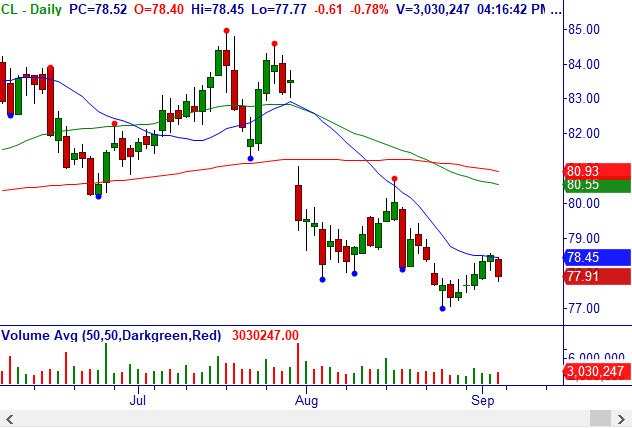
9/7: CL – Under $77.77, consider shorting stock. Sell Setup and bearish reversal at resistance and 20-MA daily, bearish weekly. Stop $78.62.
NEW OPTIONS TRADING IDEAS and Video Update Below
NOTE: For the directional options trades (i.e., buying options/spreads, not selling them), it is also acceptable to trade the stock instead with the same stop, but we prefer options when they are liquid because of the leverage and limited risk.
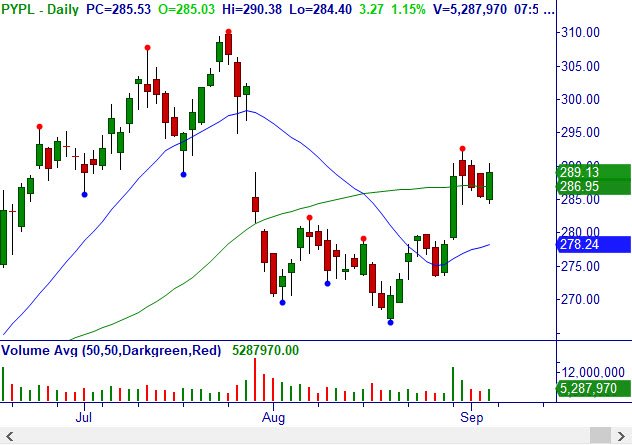
9/7: PYPL – Over $290.38, consider buying Sep (9/17) $275/300 bull call debit spread for mid-point (closed for $13.76/share). Buy Setup and bullish engulfing reversal at 50-MA. Stop $284.28.
9/7: AAPL – Over $154.72, consider buying Sep (9/17) $150 calls for mid-point (closed for $5.35/share). Bullish consolidation after +WRB Breakout to all-time highs. Stop $151.18.

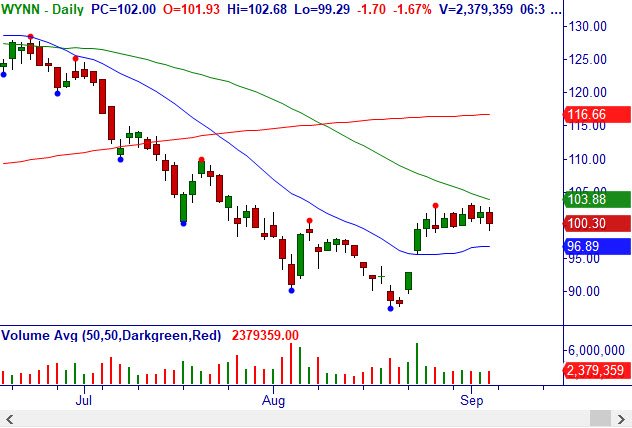
9/7: WYNN – Over $103.25, consider buying Sep (9/17) $98 calls for mid-point (closed for $4.03/share). Buy Setup and bullish engulfing reversal at 50-MA. Stop $99.18.
if you are interested to learn how to buy options and debit spreads for directional setups using Master Trader Strategies, click HERE
Directional Options Strategies for Swing and Day Trading – Buying options to profit on Directional moves with Candlestick patterns offers incredible benefits over trading stocks when properly used with MTS.
VIDEO ON OPEN TRADES AND ADJUSTMENTS (NOTE: Also in Member’s Area in Open/Closed Trade Sheet)
[s3mm type=”video” s3bucket=”mastertrader2″ s3region=”us-east-1″ files=”dans-video/advisory_210904.mp4″ source=”cloudfront” /]
Traders and investors often “pick the bottom,” thinking they are getting a great price.
But stocks are often cheap for a reason, and can remain “dogs” — and some go bankrupt.
At Master Trader, we have several criteria to define quality setups based on the structure of the price pattern.
The Structure of the price pattern will speak to us about the relationship between buyers (demand) and sellers (supply) and the likelihood of reversals and trend continuation.
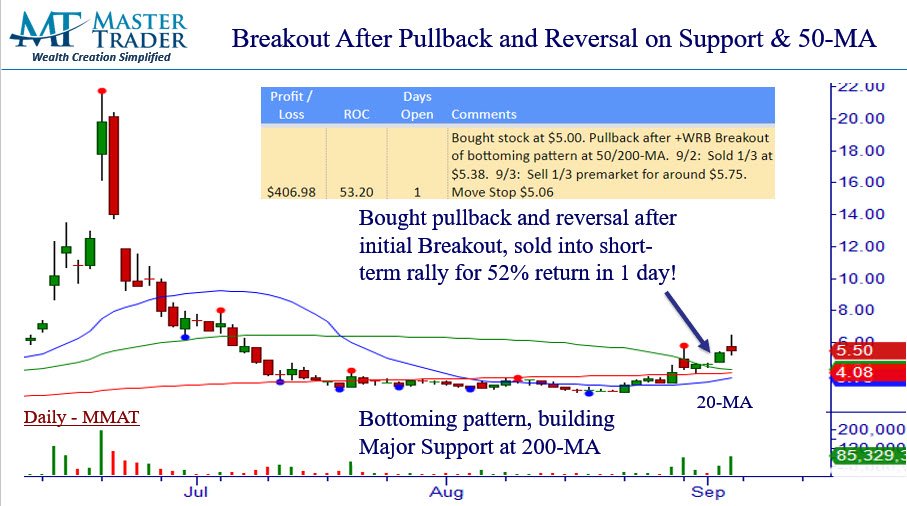
Here are three quality bottoming patterns which we gave last week – closing each within days for huge gains.


Options Strategies Definitions Videos Here
Please read the information on Money Management below Learn how Master Trader Technical Strategies – MTS and MTS with Options Strategies can make consistent money.
Please read the valuable information in the RESOURCES tab after you log into your Member’s Area:

Click Here – to Access the Options Credit Spread Program that puts you on the Master Trader Income Path.
Click Here to Learn The Master Trader Swing Trading Strategies to profits over a few days to weeks. To invest in ETFs for weeks to months to generate wealth with compelling patterns using MTS, see Master Trader ETF Investment Trader.
Click HERE Master Trader Weekly Lessons for Investors and Traders will build your investing and trading knowledge and confidence to profit in all markets! Each lesson can change your financial future — only $11.97/month!
Because your success is vital to you – and us.
Before selling options or credit spreads, we urge you to review the valuable and detailed information that we have provided for you in your Member’s Area.
If You’re in a Rush to Start A quick simplified approach to calculating contract size is to simply base your contract size based on the number of shares permitted in your Trading Plan as if you were trading the stock or ETF. Simple Share Sizing = $ Risk / Stop Loss The amount of money that you are willing to risk – divided by – the stop loss amount. For example, $100 / .20 = 500 shares. Credit Spread example, if your Trading Plan allowed you to trade 543 shares of AAPL based on the stop loss, then simply round down to the nearest hundred and short an equivalent number of contracts of the option. Since 1 contract represents 100 shares of the underlying, this would be five (5) contracts.
Master Trader and You Building Your Financial Future Together!
Happy trading! If you have any questions or comments, please e-mail Greg Capra at Greg@mastertrader.com or Dan Gibby at Dan@mastertrader.com
All the best,
Greg Capra Managing Director of Master Trader
Dan Gibby Chief Options Strategist
NOTE: Master Trader will show the opening and closing prices of all stock and options trades. We recommend that all traders and investors use proper share sizing for positions and money management. However, we cannot recommend what that is for your particular trading style, risk tolerance, or account balance. We urge you to calculate your own share/position size based on your individualized risk parameters, Trading Plan, and familiarity with the proposed trade strategy and risk. Advanced Management Strategies (AMS) covers in detail foundation and advanced position and money management.
NOTE: Master Trader and its representatives may have existing positions in actual or other trade recommendations before or after suggested herein. Additionally, we may manage them differently for internal purposes based on different risk parameters than noted herein. All trade ideas and content are for informational and educational purposes only. It is not, nor is it intended to be, trading or investment advice or a recommendation that any security, option, or investment strategy is suitable for any person. Trading securities can involve high risk and the loss of any funds. Significant gaps or volatility can increase these losses, particularly for short option strategies. Investment or trading information provided may not be appropriate for all investors, and is provided without respect to individual financial sophistication, financial situation, investing time horizon or risk tolerance. Supporting documentation for any claims (including claims made on behalf of options programs), comparison, statistics, or other technical data, if applicable, will be supplied upon request. Master Trader Consulting, Inc. is not a licensed financial advisor, registered investment advisor, or a registered broker-dealer. Options, futures, and futures options are not suitable for all investors.